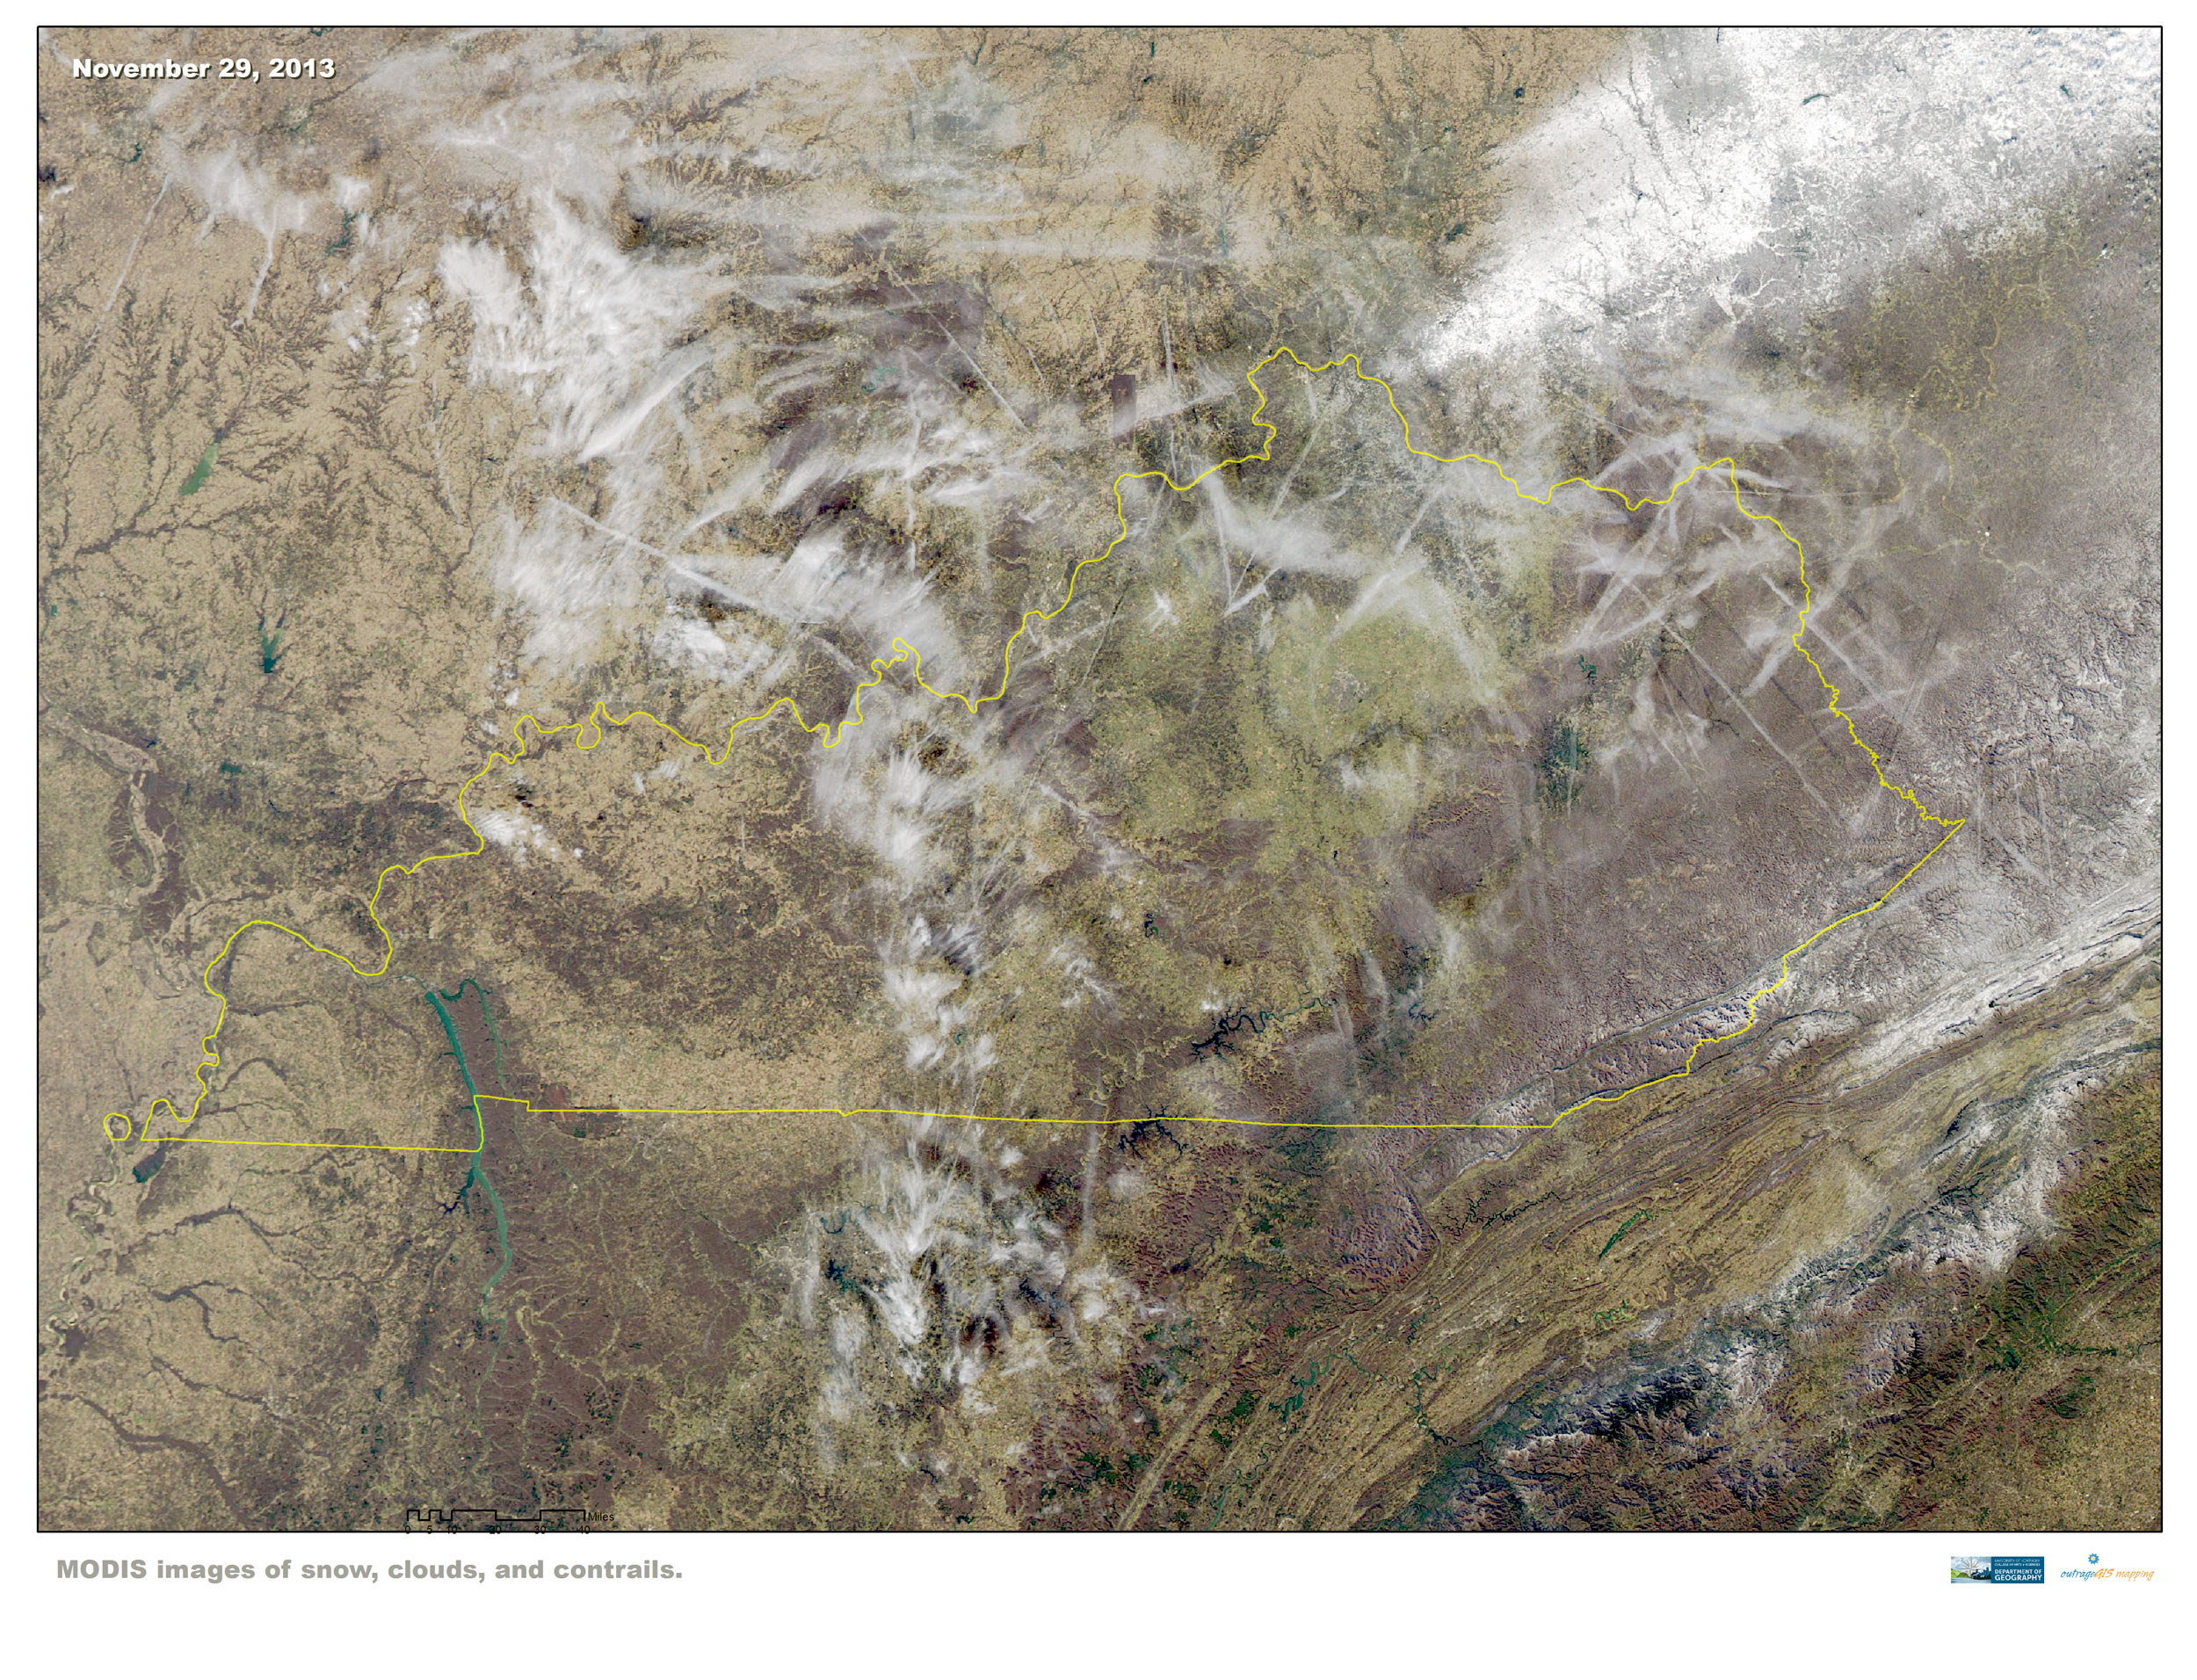
 On the day after Thanksgiving, the eye in the sky from MODIS shows heavy snowfall in southeast Ohio and in the highest Kentucky and West Virginia mountain locations. Contrails fill most of Kentucky’s northern skies.
Snow, Clouds, and Contrails
November 30, 2013 by Leave a Comment
Kentucky transitions into fall
November 17, 2013 by Leave a Comment
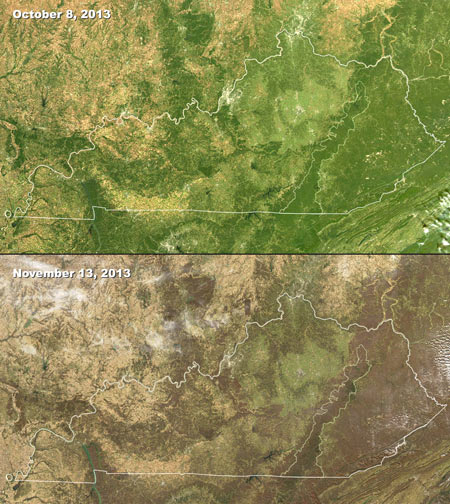
MODIS images of changing seasons in Kentucky, 2013
These satellite images are from the Moderate Resolution Imaging Spectroradiometer (MODIS) instruments on two satellites, Aqua and Terra. MODIS captures 36 electromagnetic wavelength bands to measure atmospheric water vapor, ozone, aerosols, land fire, surface temperature, and many other important variables of global climate. These images are visible light and clearly show the change in deciduous canopy cover within roughly a month of time. Spatial resolutions are between 250 m to 1 km.
The Daily Aesthetic Oral Histories
November 17, 2013 by Leave a Comment

Online Oral Histories
Between 1996-1998, I completed about 30 hours of oral histories about once-segregated black parks in Kentucky. About six hours are available online at the University of Kentucky Louie B Nunn Center for Oral History. They’re missing my interview with John Will “Scoop” Brown, a Lexington park programmer and raconteur of zoot suits in Douglass Park. More to be available to be sure.
Here’s the oral history index: The Daily Aesthetic: an oral history of a southern city’s black park system, 1916-1956
“This project focuses on African American culture during the time of segregated park systems in Lexington, Kentucky. These interviews, originally conducted by Boyd Shearer, Jr. for a multimedia presentation, contain descriptions of African American park activities, particularly in Douglass Park. Activities ranged from doll shows, to carnivals, to sports programs. This community also celebrated the visual arts, music, and holidays such as the 4th of July and Easter. The focus of this collection is not discrimination experienced by African Americans at this time, but rather how the park provided a place for them to come together and cultivate a sense of identity and community.”
For an audio documentary using some of these interviews, visit:Â http://www.outragegis.com/trails/2001/08/08/at-leisures-edge/. The documentary can be downloaded or viewed on SoundCloud. A complete audio script is available.
A paper from this research was produced:
index:Â http://www.uky.edu/Projects/TDA/archive/TableofContentsandAbstract.pdf
main body: http://www.uky.edu/Projects/TDA/archive/TDA.pdf
Boone Trace
August 27, 2013 by 1 Comment

Boone Trace from James Boone Gravesite Marker to Fort Boonesboro
We’ve been working for a client developing a Boone Trace map and guide requiring maps at a few different scales. One scale is the “big picture” map and we selected a 3D basemap for this overview, letter-sized map. I spent only a few hours labeling the map, but with a little more work, I think it will look good. The color intensity might need to be reduced, if it’s decided to use the 3D map. It be more appropriate to make a simple line drawing map, in a nod to older map markers and the historic nature of the subject.
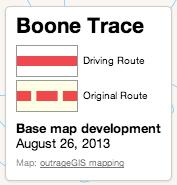
Interactive map legend
Many more hours were used to develop the driving tour basemap. Bringing in Kentucky state GIS data, the map was developed and labeled with shapefiles in TileMill. The idea is to build a good basemap for the client using online proofing and updating. After the production format and scale are chosen, we’ll create bounding boxes and clip out the print pages. TileMill styling and label placement can easily be transferred to Illustrator and with the goal of quickly designing a final proof.
Works in Firefox, Chrome, Safari, and IE8. You’ll need to run compatibility mode if your browser is IE9 or greater.
The Woodland Art Fair Weekend
August 19, 2013 by Leave a Comment

Ending a busy Saturday.
What an awesome weekend! We want to sincerely thank all of our friends, new and old, who came by our booth to talk about their adventures and uses of maps. We couldn’t have been happier after a busy day’s work with the excitement folks still have for good ‘ol paper maps. It’s inspiration that fuels our tanks. The weather held, this year’s food and beverage selection was superior, and our neighbors were fantastic. That’s why we say awesome!
One visitor, Emmett, epitomizes our type of person who loves maps and loves to use them. He recently moved to Lexington and committed himself to hiking all the official trails in the Red River Gorge. As he was outfitting his gear at Lexington’s Benchmark outdoor store, he came across one of our publications.

John at command/control in 2005, our first year at the church.
After a few dozen miles of using our map in the backcountry, he said, “That map was the best $15 I ever spent, hands down.” After he hikes all the trails, he’ll mount and frame his maps. Emmett, we’re gonna hold you to your pledge to send us a photograph of the framed map set.
This was our eight year at the same spot in the Woodland Christian Church fair annex. While we perhaps don’t have the same number of visitors as the Woodland Park grounds, we love our shady corner at the bottom of the hill.
We hope to see you next year and thanks for all your support!
Draft of North Sheltowee Trace Map
August 19, 2013 by 4 Comments
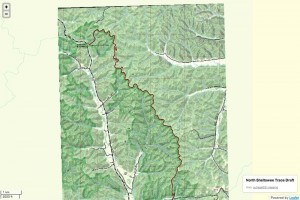
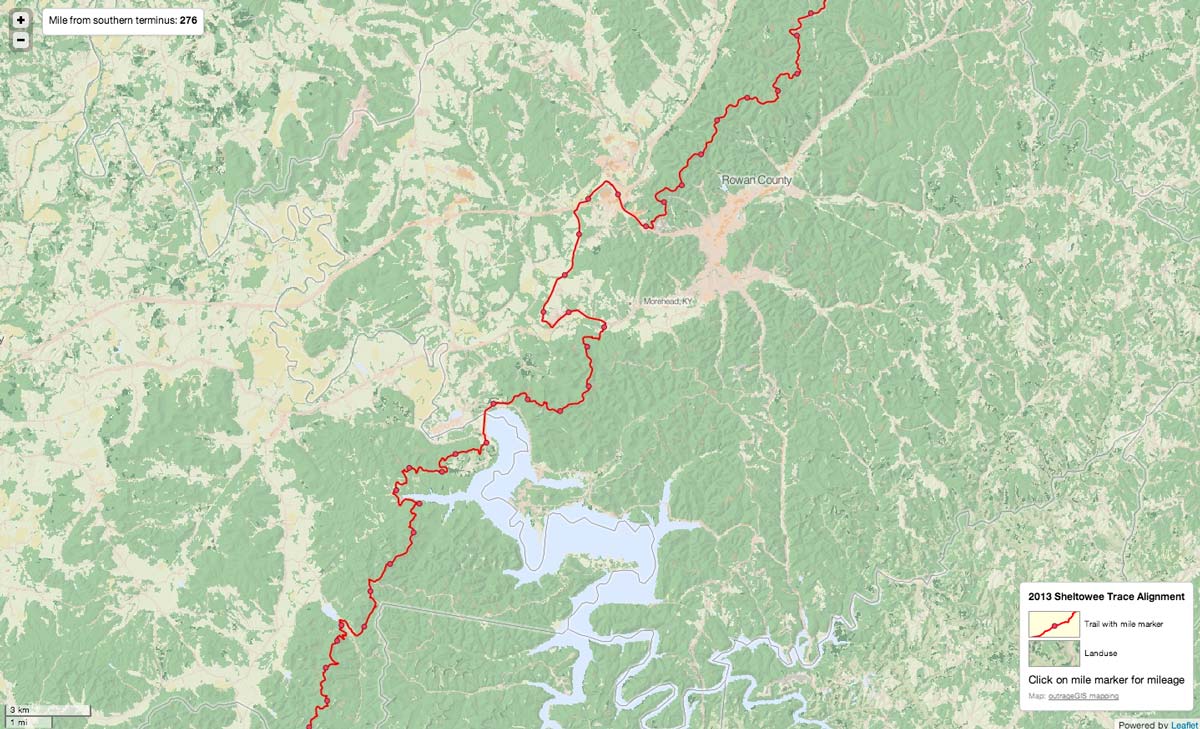
Interactive viewer to proof the content of the map.
We are sharing our first draft of the Sheltowee Trace North map and we encourage you to proof it and give us feedback. The map covers the ST from the north terminus in Rowan County, Kentucky to DBNF’s Turkey Foot Campground along the banks of the War Fork near McKee, Jackson County.
The print format of this map will be 19″ x 27″ and on two double-sided sheets. The layout format is following: map one is Northern Terminus to Corner Ridge at Mariba; and map two is Corner Ridge to Turkey Foot.
Since the northern half of the ST has more contiguous public land, we went to the big sheet showing larger tracts of area. Trails in the Cave Run Lake and Red River Gorge areas are completely covered; in fact, this map might cover all official trails in the Cumberland Ranger District.
What needs to be done? We still need to add elevation contour labels and Sheltowee Trace mile markers. The south map counts miles from the old southern terminus and is no longer correct. To resolve mile markers on the north map, we’ll start counting from the northern terminus and provide a conversion for north-bound hikers using either the new or old southern terminus. Any suggestions about this mile maker plan?
A few notes about the map viewer. This map viewer is built out of TileMill and should work with most modern browsers, including mobile. As we develop new data about the alignment and distance of the Trace, we can easily update this draft. The images are reduced in resolution and they will appear a little ragged. We’re proofing content, here so please don’t the aesthetics, yet!
NOTE: the interactive works in Firefox, Chrome, Safari, and IE8. You’ll need to run compatibility mode if your browser is IE9 or greater.
New Bike Lex Map
July 29, 2013 by Leave a Comment

Online map for shared-use trails and bike lanes
A new Bike Lexington map was released in June 2013. We developed a Tilemill online map version and it is online here. I have two directions we would like to go with this map. One, I’d like to establish legibility at all zoom levels so it can work on mobile devices. Two, I want to develop a version where users can submit reports on important or problematic locations with a focus on safety. It would be obvious to first map accidents and fatalities to communicate and understand how they happen.
We welcome any recommendations or contributions.
Hello TileMill: looking at Sheltowee Trace mileage
July 27, 2013 by Leave a Comment
Sheltowee Trace trail with mile markers and landuse background image. First draft.
As we update the Sheltowee Trace maps, I took a diversion and looked at Tilemill from the folks at MapBox to create an interactive online map of the new alignment. Tilemill is pretty awesome app and allows you create a projects using a variety of spatial data, including Shapefiles, GeoTIFFs and GeoJSON (a new format to me, but shows some interesting possibilities).
 The strength of Tilemill centers on few features; you can style layers in markup very similar to CSS, attribute data can be used for styling and interactively shown on the published map, attributes and features can be displayed differently at different zoom levels, and you publish to an MBtile file, a SQlite database. This format contains many thousands, no millions, of raster tiles that are served quite fast in your browser. In my opinion, a ton of creativity can be found in this free app.
For the Sheltowee Trace map, I pulled in a GeoTIFF of landuse with elevation hillshading, the ST trail with mile markers, and polygons of county and larger towns. After tinkering with the style sheets, I made a fairly simple map. I wanted to add so many more layers, but I had to see how it looked online. The simplest way to publish it to use MapBox’s service, but the .mbtiles file was 300 MB and I wanted to host on SheltoweeTrace.com. I needed to to use a few javascript libraries to serve this map on our server. I chose Leaflet through MapBox’s Wax library (inspired by this post) and it was fairly easy to setup. One thing I learned after a little frustration, the newest version of Leaflet.js will not work with the .js files in Wax. Use only the files included in Wax and it will work perfectly. The only other bit of code needed is something to read the data in the mbtiles file and format it properly for Wax. I used tileserver.php and it is important link if you want to display attribute data interactively.
While the map is very simple, it has some potential I think. Obviously the base map needs finishing with a good legend, but some exciting options include adding popup photos of significant trail features (with the future hope make this an interactive submission for users) and using Leaflet’s geolocation feature for mobile devices (pretty buggy now and there’s issue of offlining the data for use in the field).
Artwork & Copy submission for your Ad
June 25, 2013 by
Please provide contact information for your designer, if needed. We can build your ad from content you provide. We can also directly place your designed ad, if it does not exceed the ad’s dimension.
If you attach any artwork or document, please make sure it is no larger than 8mb and it is in the following format: .jpeg (JPEG photographic image), .png (graphics format), .ai (Adobe Illustrator), .pdf (Acrobat PDF), .doc (Microsoft Word) or .zip (a compressed file that could contain many files).
After you submit your artwork, we will give you a draft to edit or accept for publishing. You will also see and confirm the ad before the ad is printed.
[si-contact-form form=’1′]
**************************
Late May in the Mountains
May 24, 2013 by Leave a Comment

May 24 weather animation for Cold Mountain
Cold Mountain clears into view after the morning fog burns off and reveals the marvelous green from this spring’s abundant moisture. One can see that spring is just reaching the summit and a beautiful sunset occurred on this spring day.
Spring Day
April 19, 2013 by Leave a Comment

April 15 weather animation
A nice cloud swept sunrise this past Monday and a fantastic afternoon to follow. Special days ahead.
UK Campus Native Tree Tour
April 14, 2013 by Leave a Comment

The University of Kentucky Native Tree Trail
The great document was made by Forestry students in UK’s College of Agriculture in 2007 and we just found it! This 2.2-mile tour locates 45 native tree species on UK’s campus and includes pictures. From the description, the document appears to be a class project for FOR 599: Geographic Information Systems in Natural Resources. Now this is a great example of using classwork & technology to keep us green and appreciate our diverse flora.
By: Lee Moser and Matt Strong
Course Instructor: Dr. Songlin Fei
This project is supported by the UK Service-Learning Grant Program, Department of Forestry, and College of Agriculture.
Download and for other local tours, visit the Department of Forestry website and click on the left-hand link, “Links and Opportunities.”
Tale of Two Years
April 1, 2013 by Leave a Comment
We have a late spring this year and you can see it with the Look Rock webcam. The first image is from April 1, 2013 and doesn’t show much greening of the trees. The second image is an animation from April 1, 2012 and you can quickly notice much more tender green.
Early Spring Snow in the Great Smokies
March 27, 2013 by Leave a Comment

Snow on Mt. LeConte
In winters past, the highlands of the Great Smokies could expect an average of 8-10 feet of snow. This winter we’ve had much less, though the average temperatures have about normal. On March 26, however, we saw a dramatic snowfall with Mt. LeConte getting about 20″ in one storm with little snowfall at lower elevations. These images clearly show the snow line and give a unique feeling to the mountain scenery.
Web page update
March 14, 2013 by Leave a Comment
As we update the site for our 2013 hiking season, please don’t mind our fuss, too much. We’re trying organize our site better and offer more maps for spring.


