Website of collision maps
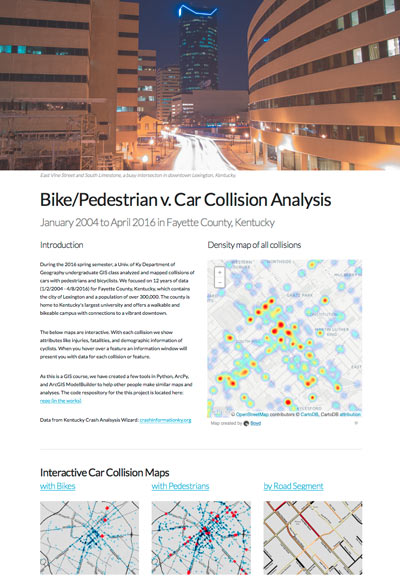
For a GIS course at the University of Kentucky Department of Geography (GEO 409), we mapped and analyzed the incidences of car collisions with pedestrians and bicyclists. Using data from Kentucky Crash Analysis Wizard (crashinformationky.org), we harvested collisions for Fayette County from January 2004 until April 8, 2016, the entire dataset at that point in time.Â
The website of collision maps is available here: http://boydx.github.io/collisions/ and the bike map is http://boydx.github.io/collisions/bikes
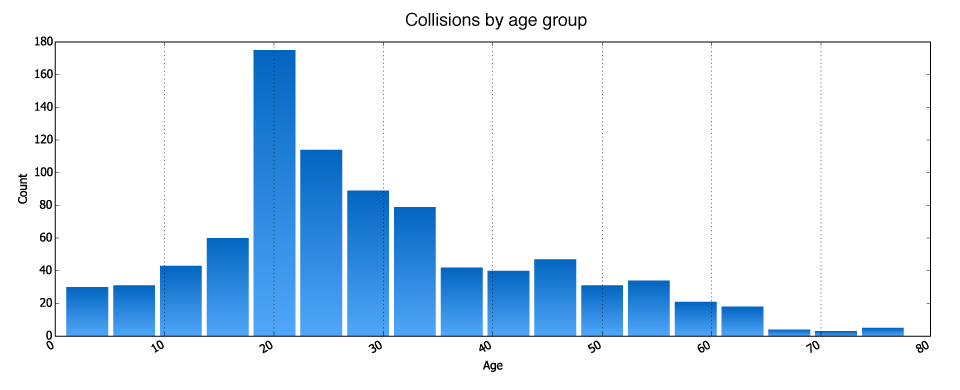
Along mapping fatalities, injuries, and hit and run cases, we incorporated the available demographic data for cyclist involved collisions, e.g., age, gender, and helmet use of the cyclist. We added this information onto an interactive map that shows these details when a user hovers or clicks the collision point. A few bar charts were added to help visualize the datasets.Â
Part of this GIS course involved making tools to analyze and visualize this data. We used ArcGIS to create tools in Python and ModelBuilder. Those tools are hosted as a Github repository here: https://github.com/boydx/collision-wizard.
Below is an example bar chart that shows age of cyclists involved in car collisions:
Cyclists collisions


Leave a Reply