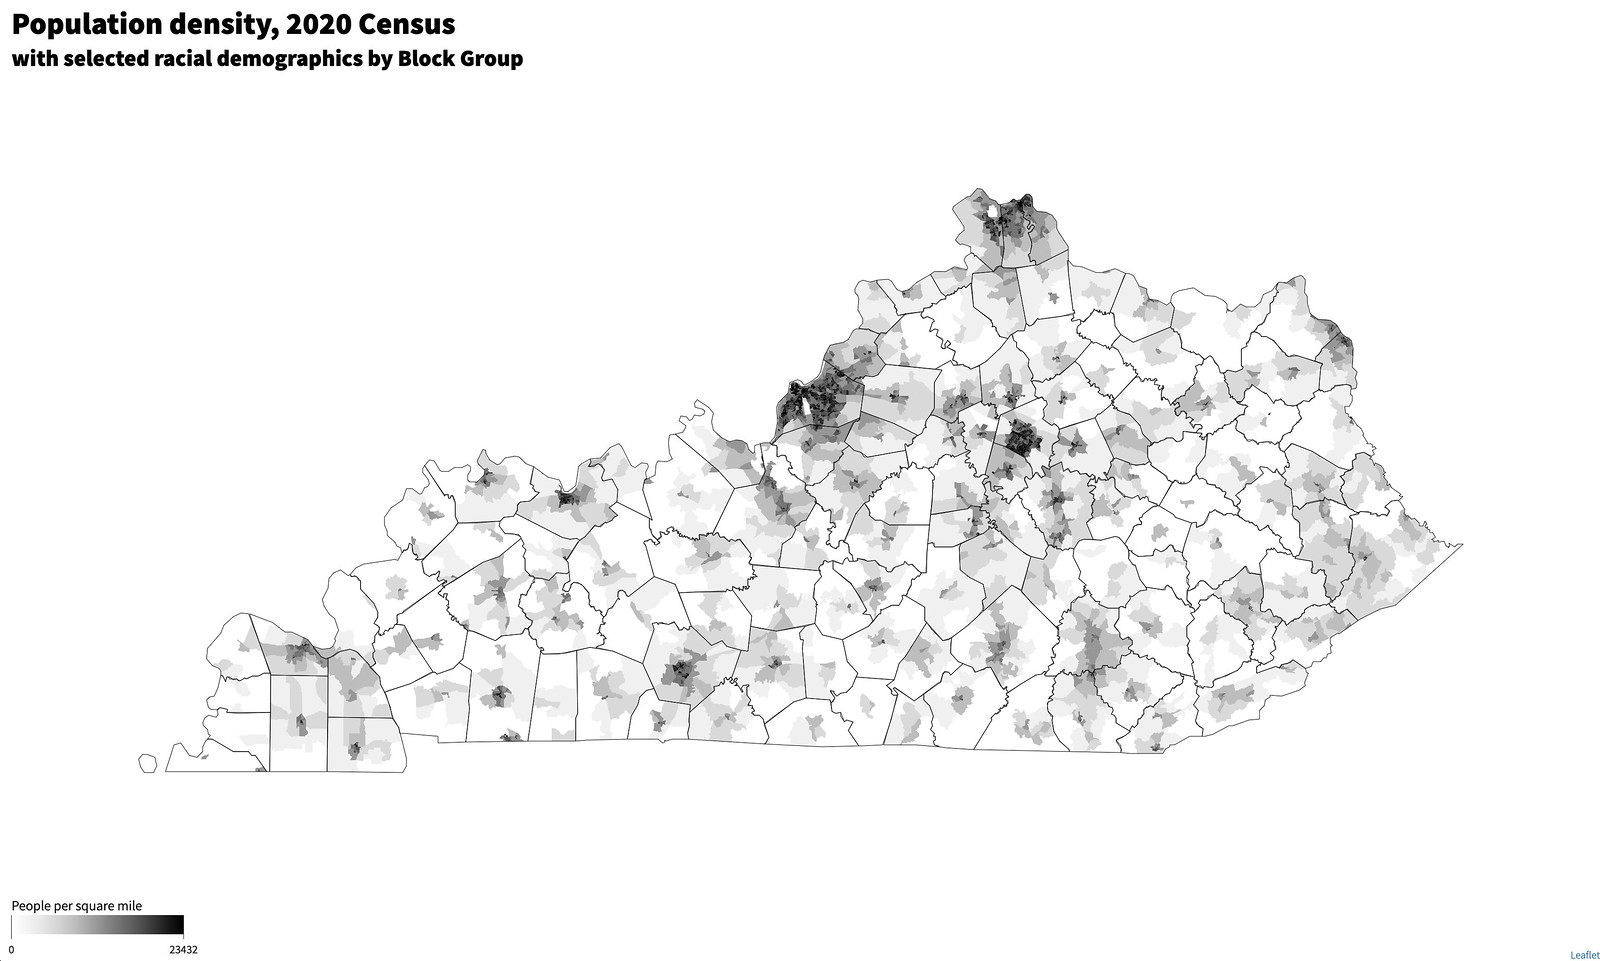
Time to explore the data on a map. The experiment is show block group data for select demographic data, which was used for redistricting. This interactive presentation is a test of concept to show population density. Eventually, an UI element will be added to symbolize block groups by precent population in self-identified racial group – as defined in Census categories.


Speak Your Mind
You must be logged in to post a comment.