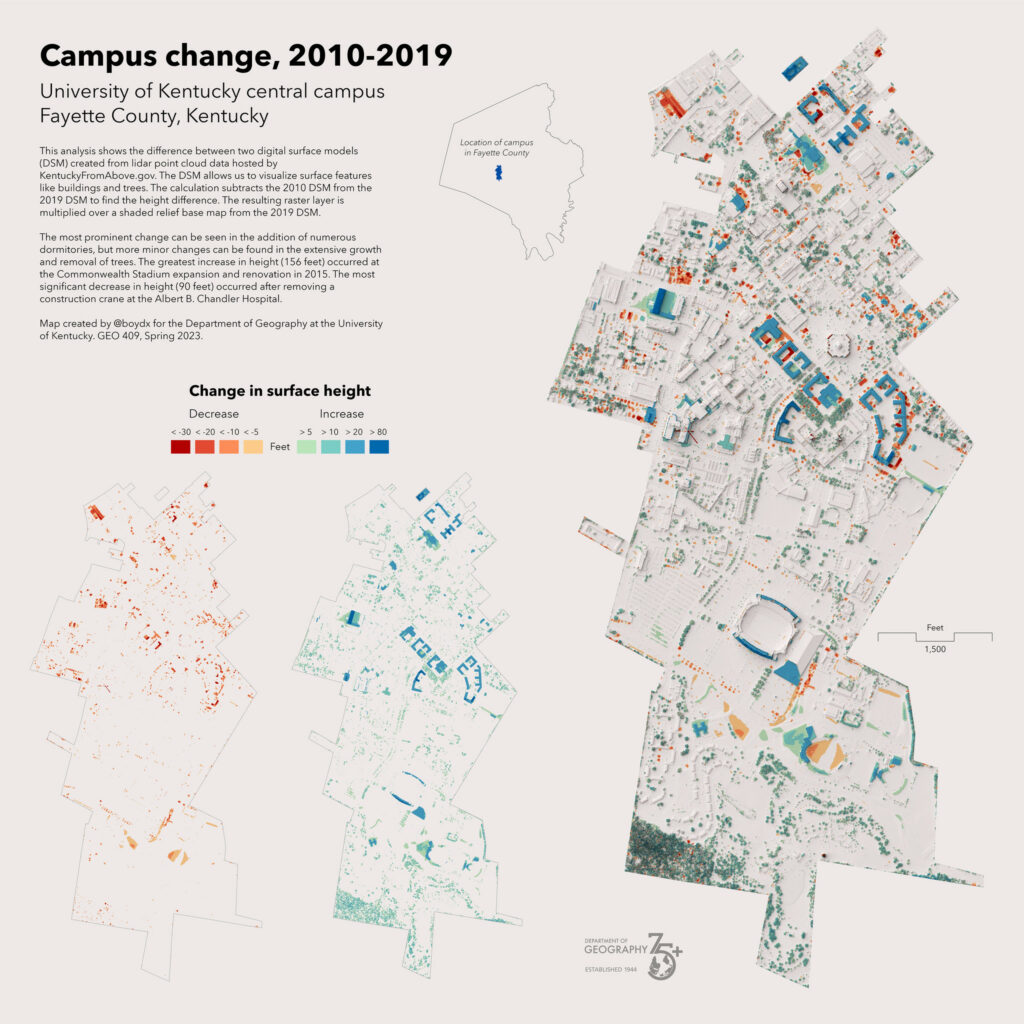
Can we detect changes in surface height over time, at a neighborhood scale? The changes in heights represent the loss and growth of trees, buildings, and other features of the built environment.
KyFromAbove has multiple phases of lidar point clouds for Kentucky as open data. In this interactive map of Lexington, Kentucky (inside New Circle), we demonstrate how to visualize and explore these changes in surface height between 2010 (Phase 1) and 2019 (Phase 2) lidar point clouds.
While most point clouds are colorized by aerial photography to give a realistic view of the surface, this project uses a different approach. Points are colorized by the amount of change in surface height between the two phases. The color scale is from red (decrease in height) to blue (increase in height). Both phases are shown simultaneously with the ability to toggle the visibility of each phase.
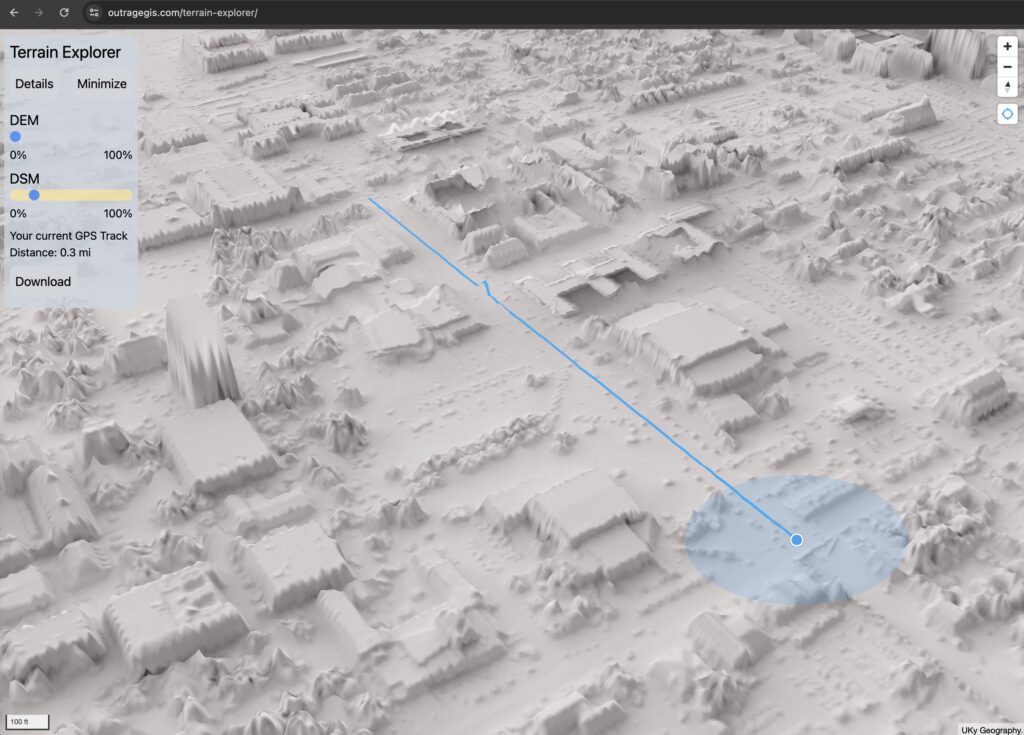
View the interactive Potree scene viewer (which is VR-enabled) through this website:
Below are some screenshots of the viewer focused on Kentucky Proud Park at the University of Kentucky campus.
 Phase 1 decrease in height
 Phase 2 increase in height
 Phases combined
 Phase 2 colorized with aerial photography