Time to Explore the Trails
Enjoy ruby-flushed sunsets sweeping through hemlocks and fresh rhododendron blooms as you hike through murals of eroded sandstone and natural arches. Our detailed topographic trail maps guide you to all the overlooks, waterfalls, and scenic vistas across Appalachia.

Hike with confidence on the trails of the Daniel Boone National Forest, Great Smoky Mountains National Park, Cumberland Gap National Historical Park, or Kentucky state parks with our trail maps and digital geodata. Visit the Map Shop to get your detailed hiking maps for Kentucky, Tennessee, and beyond—available for instant download or shipped directly to you.
Plan your adventure before you leave home by checking out our weather stations where we aggregate data from the National Weather Service, National Park Service, and various weather cams to help hikers like you understand weather and road conditions for the Daniel Boone National Forest and the Great Smoky Mountains National Park.
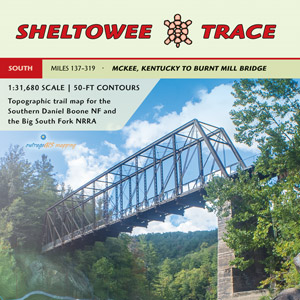
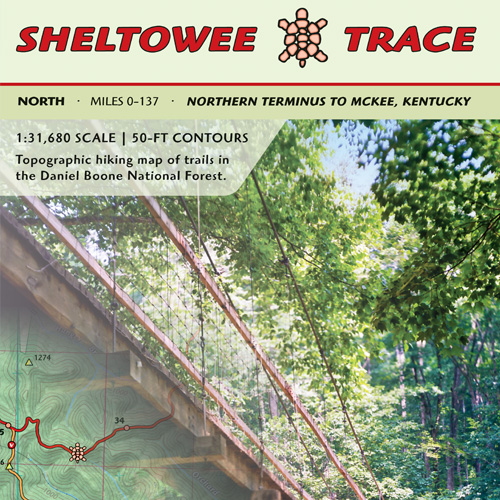
Need to escape the screen and get lost in the wilderness? We have maps to help. The Sheltowee Trace offers 353 miles of backpacking adventures through dramatic sandstone cliffs, river crossings, and remote backcountry across Daniel Boone National Forest and Big South Fork. Shop Sheltowee Trace North and South maps.
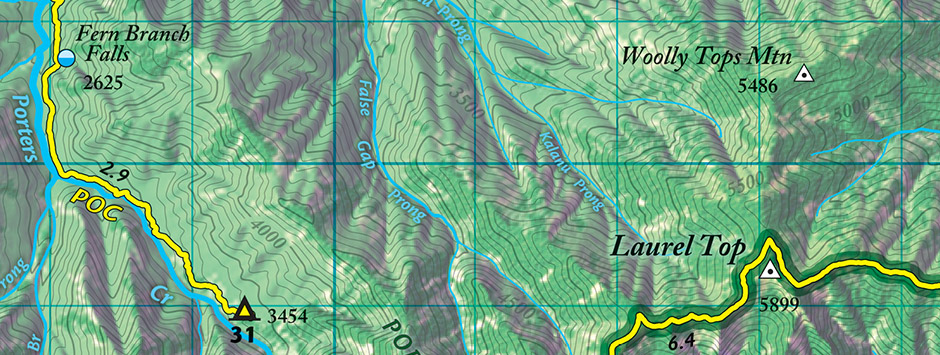
Each of our printed topographic maps is finely crafted for precise navigation and exploration. We use the latest aerial imagery and elevation data to create detailed elevation contours and full-color base maps showing canopy cover and type. Each map has GPS coordinate grids for precise location finding with latitude, longitude, and a UTM grid in meters. We personally GPS-map and field check our data—these are maps made by hikers, for hikers. Check our GitHub repository for projects that we are actively developing and for recent presentations. You are invited to collaborate.
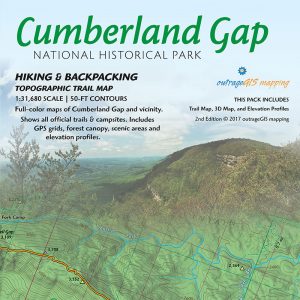
A true mountain adventure awaits at Cumberland Gap: “At this place we encamped, and made a shelter to defend us from the inclement season, and began to hunt and reconnoitre the country. We found every where abundance of wild beasts of all sorts, through this vast forest. The buffaloes were more frequent than I have seen cattle in the settlements, browzing on the leaves of the cane, or croping the herbage on those extensive plains, fearless, because ignorant, of the violence of man. Sometimes we saw hundreds in a drove, and the numbers about the salt springs were amazing.“
— An account by Daniel Boone, “The Adventures of Colonel Daniel Boone” (1784), by John Filson and Daniel Boone.
Visit the Great Smoky Mountains National Park with our GPS pack and GeoPDF
Exploring Soon?
We actively develop and experiment with navigation tools. If you’re traveling in Kentucky, you’ll want your basemaps powered with KyFromAbove data. Our collection of experimental apps exploring KyFromAbove data can be used for additional navigation on your next adventure.
If you’re hiking the Sheltowee Trace and recall the days of waypoint finding and Geocaching, check out our GPS mile-marker finder.
Our Blog
Follow our progress and read all our updates chronologically on the blog for the latest outrageGIS news.
Unfold your next Appalachian adventure with outrageGIS mapping.


