Maps and Analysis
Point locations for collisions were downloaded from the Kentucky Collision Analysis for the Public (http://crashinformationky.org/) hosted by the Kentucky State Police. Analysis was performed for Kentucky’s Fayette and Jefferson Counties for data period January 5, 2003 – February 23, 2014 as part of University of Kentucky Department of Geography course GEO 409, Spring 2014.
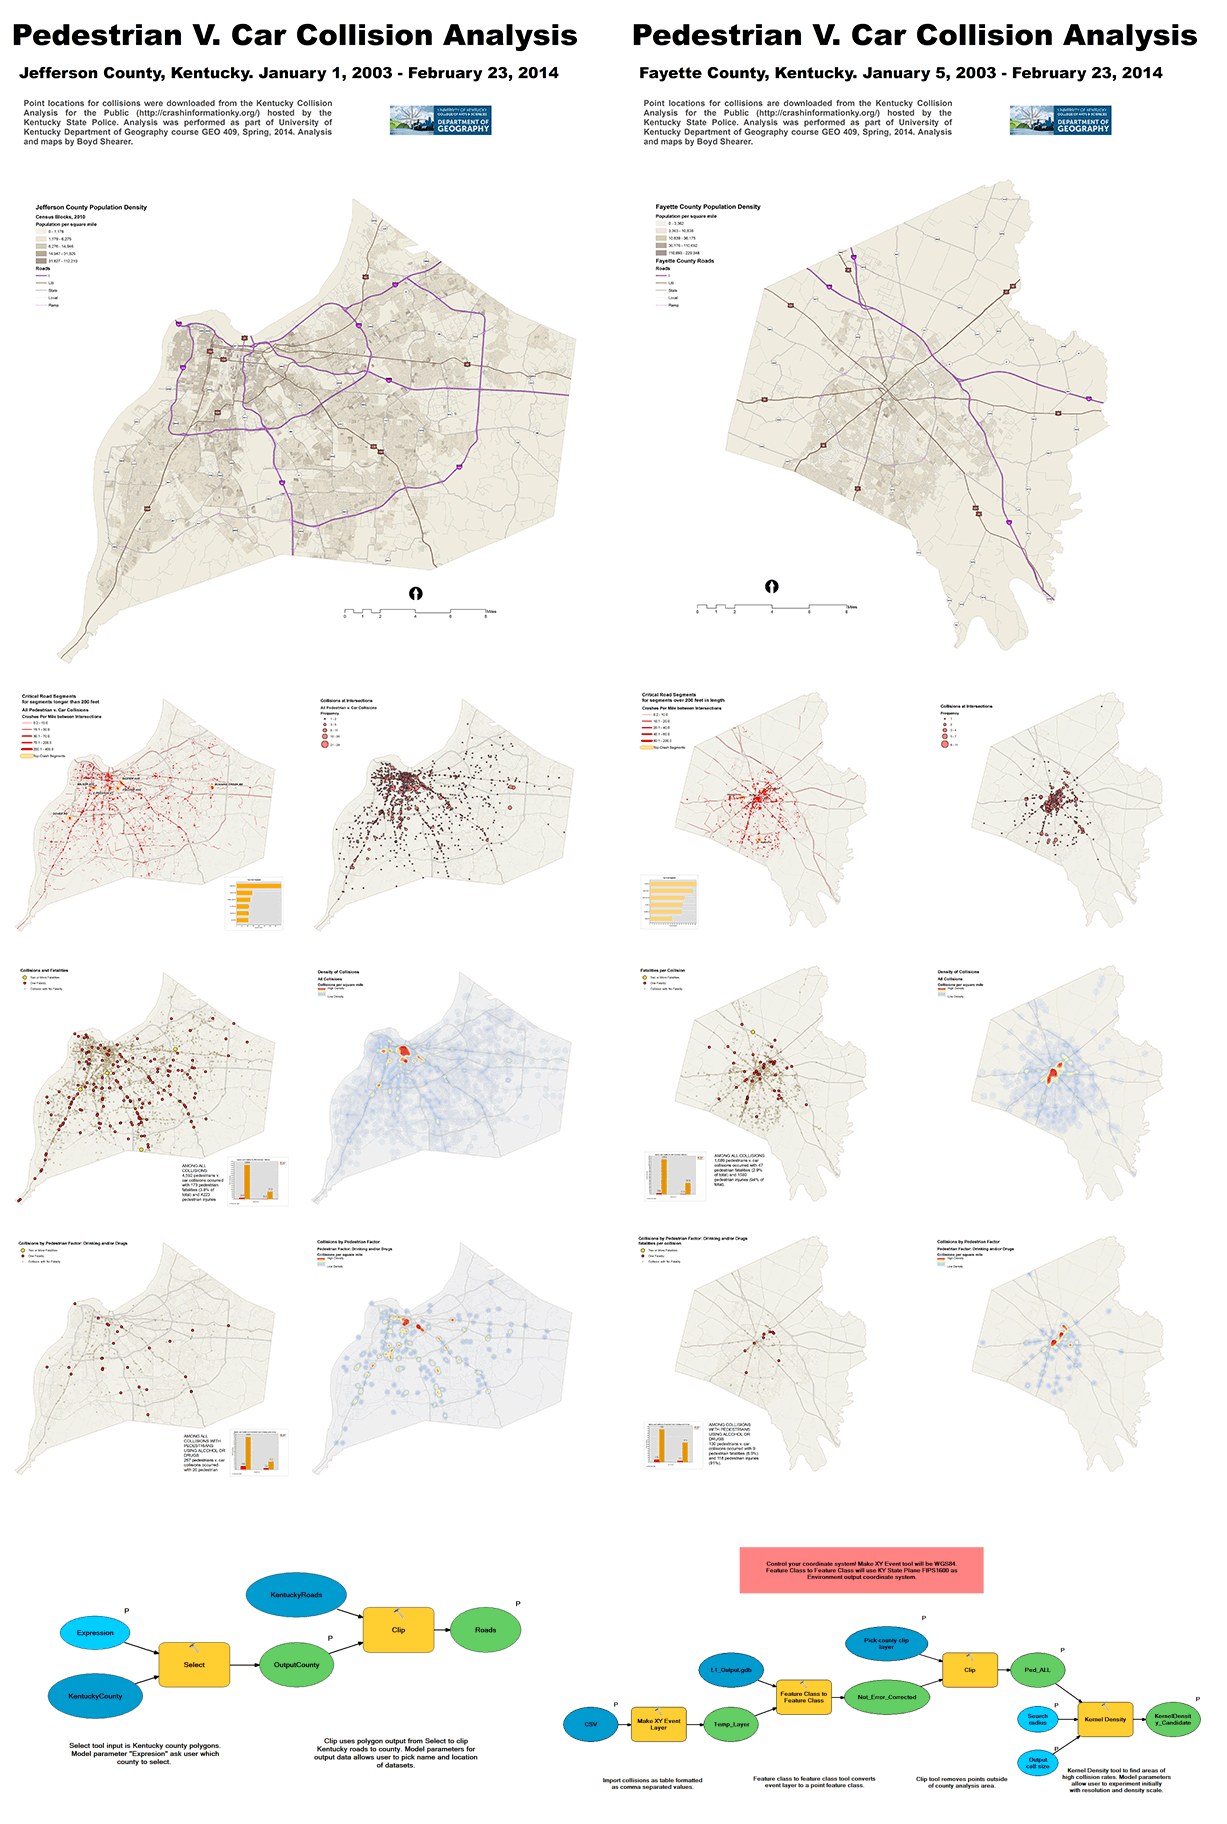
Combined Maps. Click individual county for map.
Louisville Statistics
- AMONG ALL COLLISIONS
4,592 pedestrians v. car collisions occurred with 173 pedestrian fatalities (3.8% of total) and 4223 pedestrian injuries (92% of total). - AMONG ALL COLLISIONS WITH PEDESTRIANS USING ALCOHOL OR DRUGS
257 pedestrians v. car collisions occurred with 26 pedestrian fatalities (10%) and 227 pedestrian injuries (88% of total). - Rate: 6.1 collisions per 1,000 current residents
- Download Map
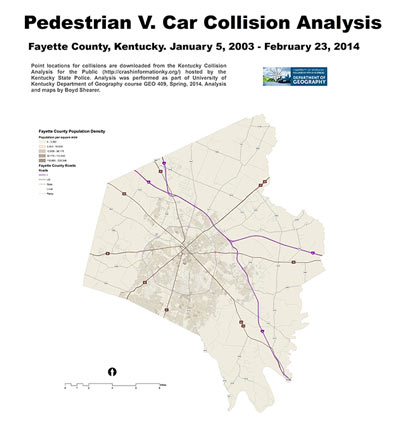
Lexington Statistics
- AMONG ALL COLLISIONS
1,689 pedestrians v. car collisions occurred with 47 pedestrian fatalities (2.9% of total) and 1580 pedestrian injuries (94% of total). - AMONG ALL COLLISIONS WITH PEDESTRIANS USING ALCOHOL OR DRUGS
130 pedestrians v. car collisions occurred with 9 pedestrian fatalities (6.9%) and 118 pedestrian injuries (91%). - Rate: 5.5 collisions per 1,000 current residents
- Download Map
Analysis and maps by Boyd Shearer.


Speak Your Mind
You must be logged in to post a comment.