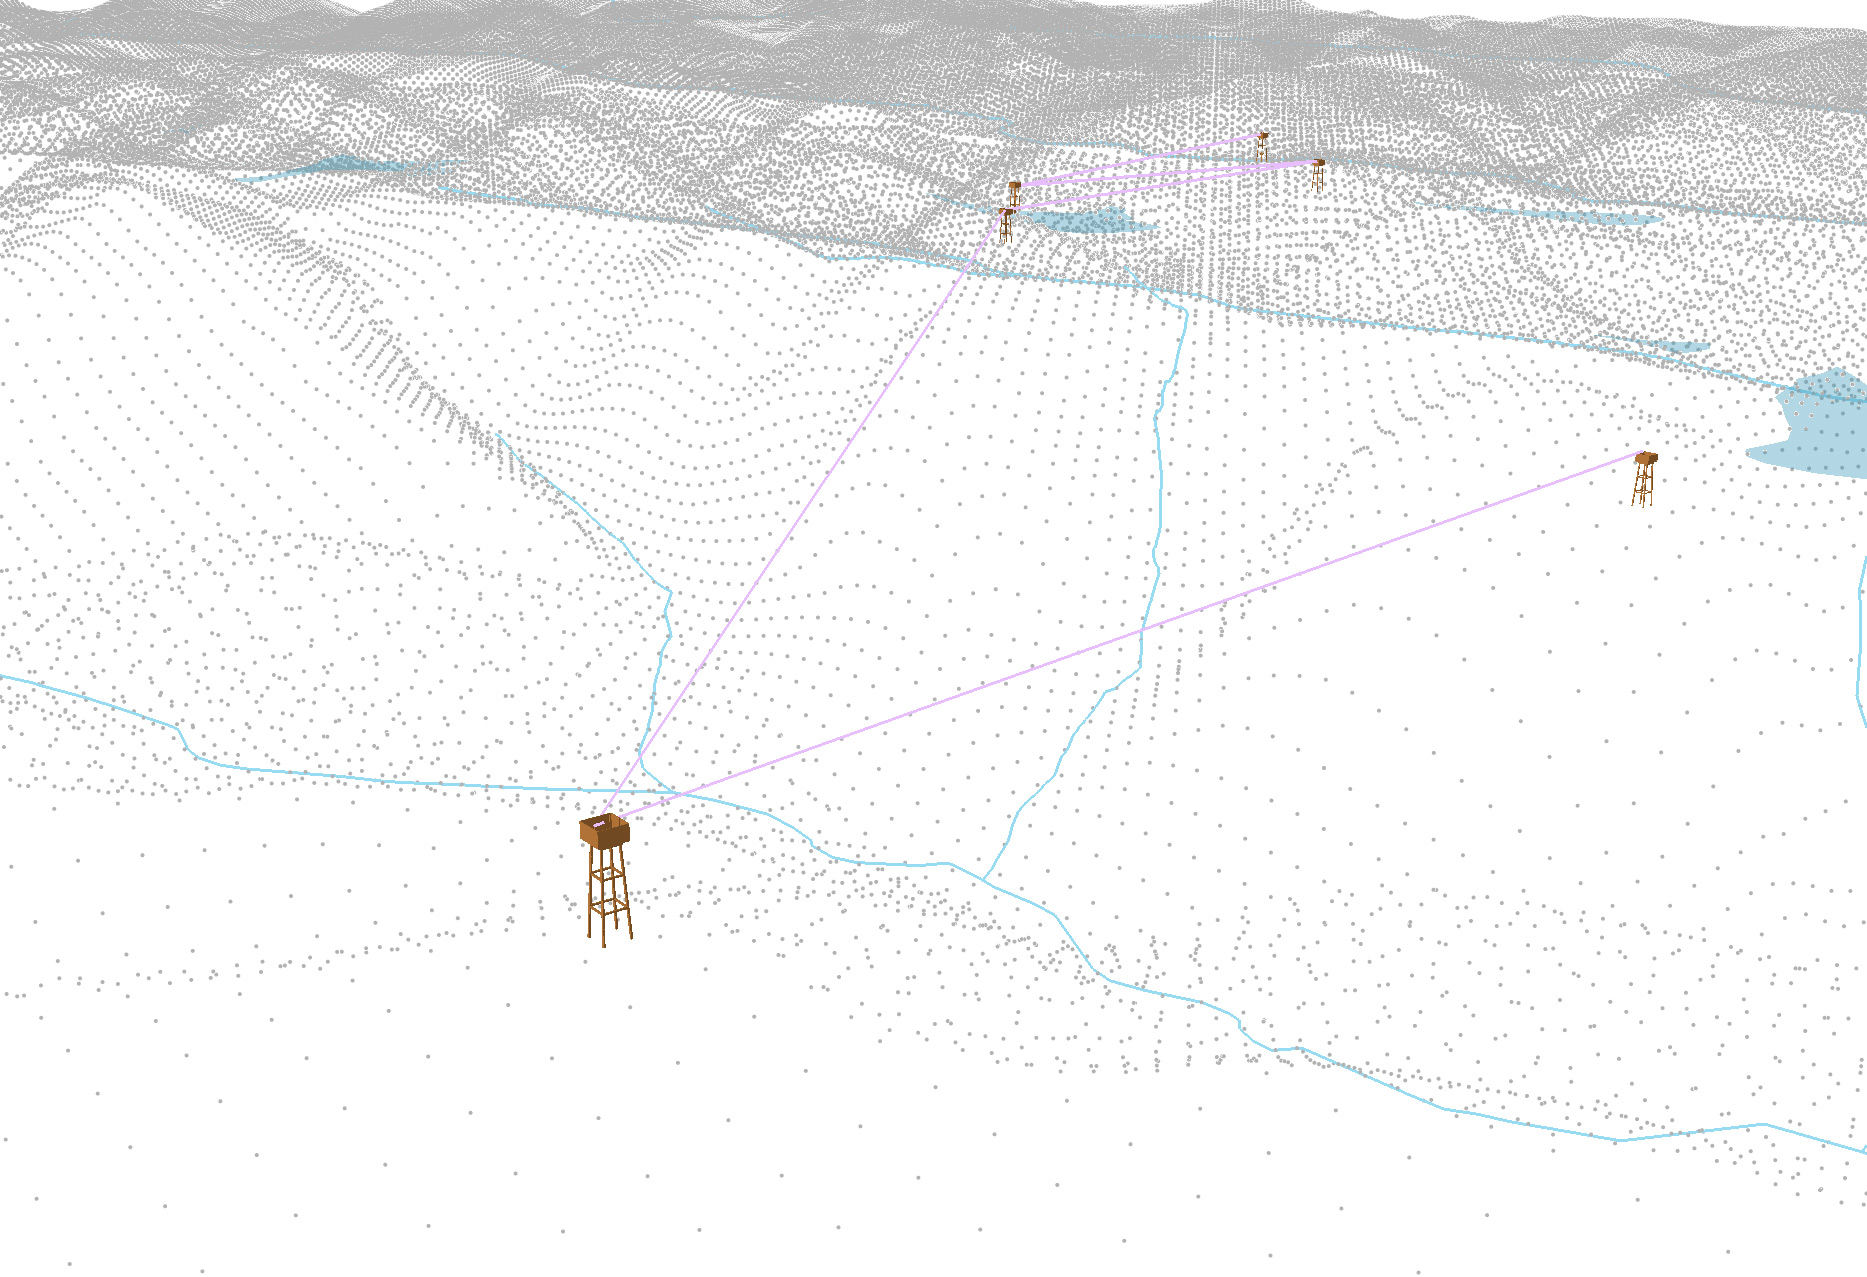
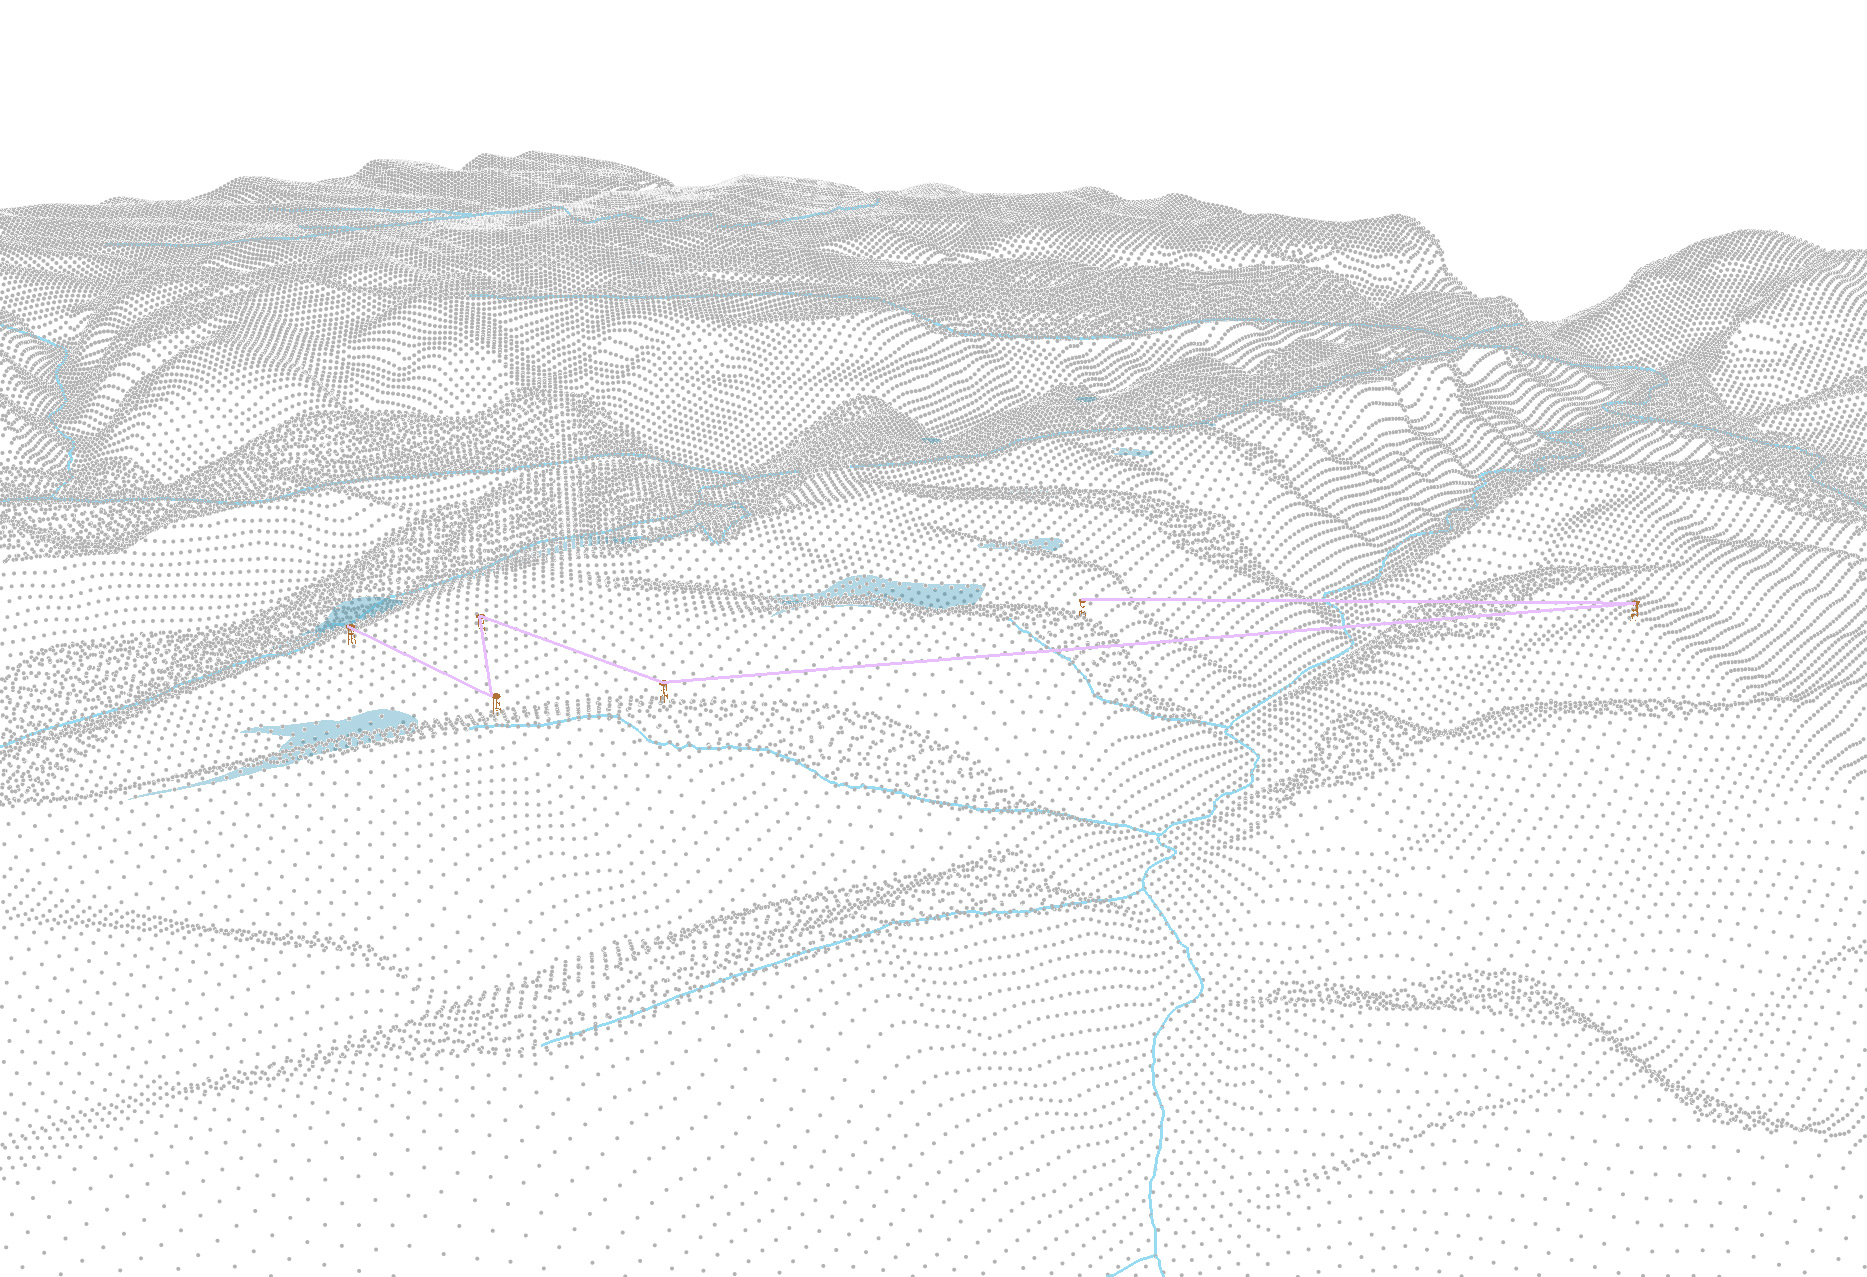
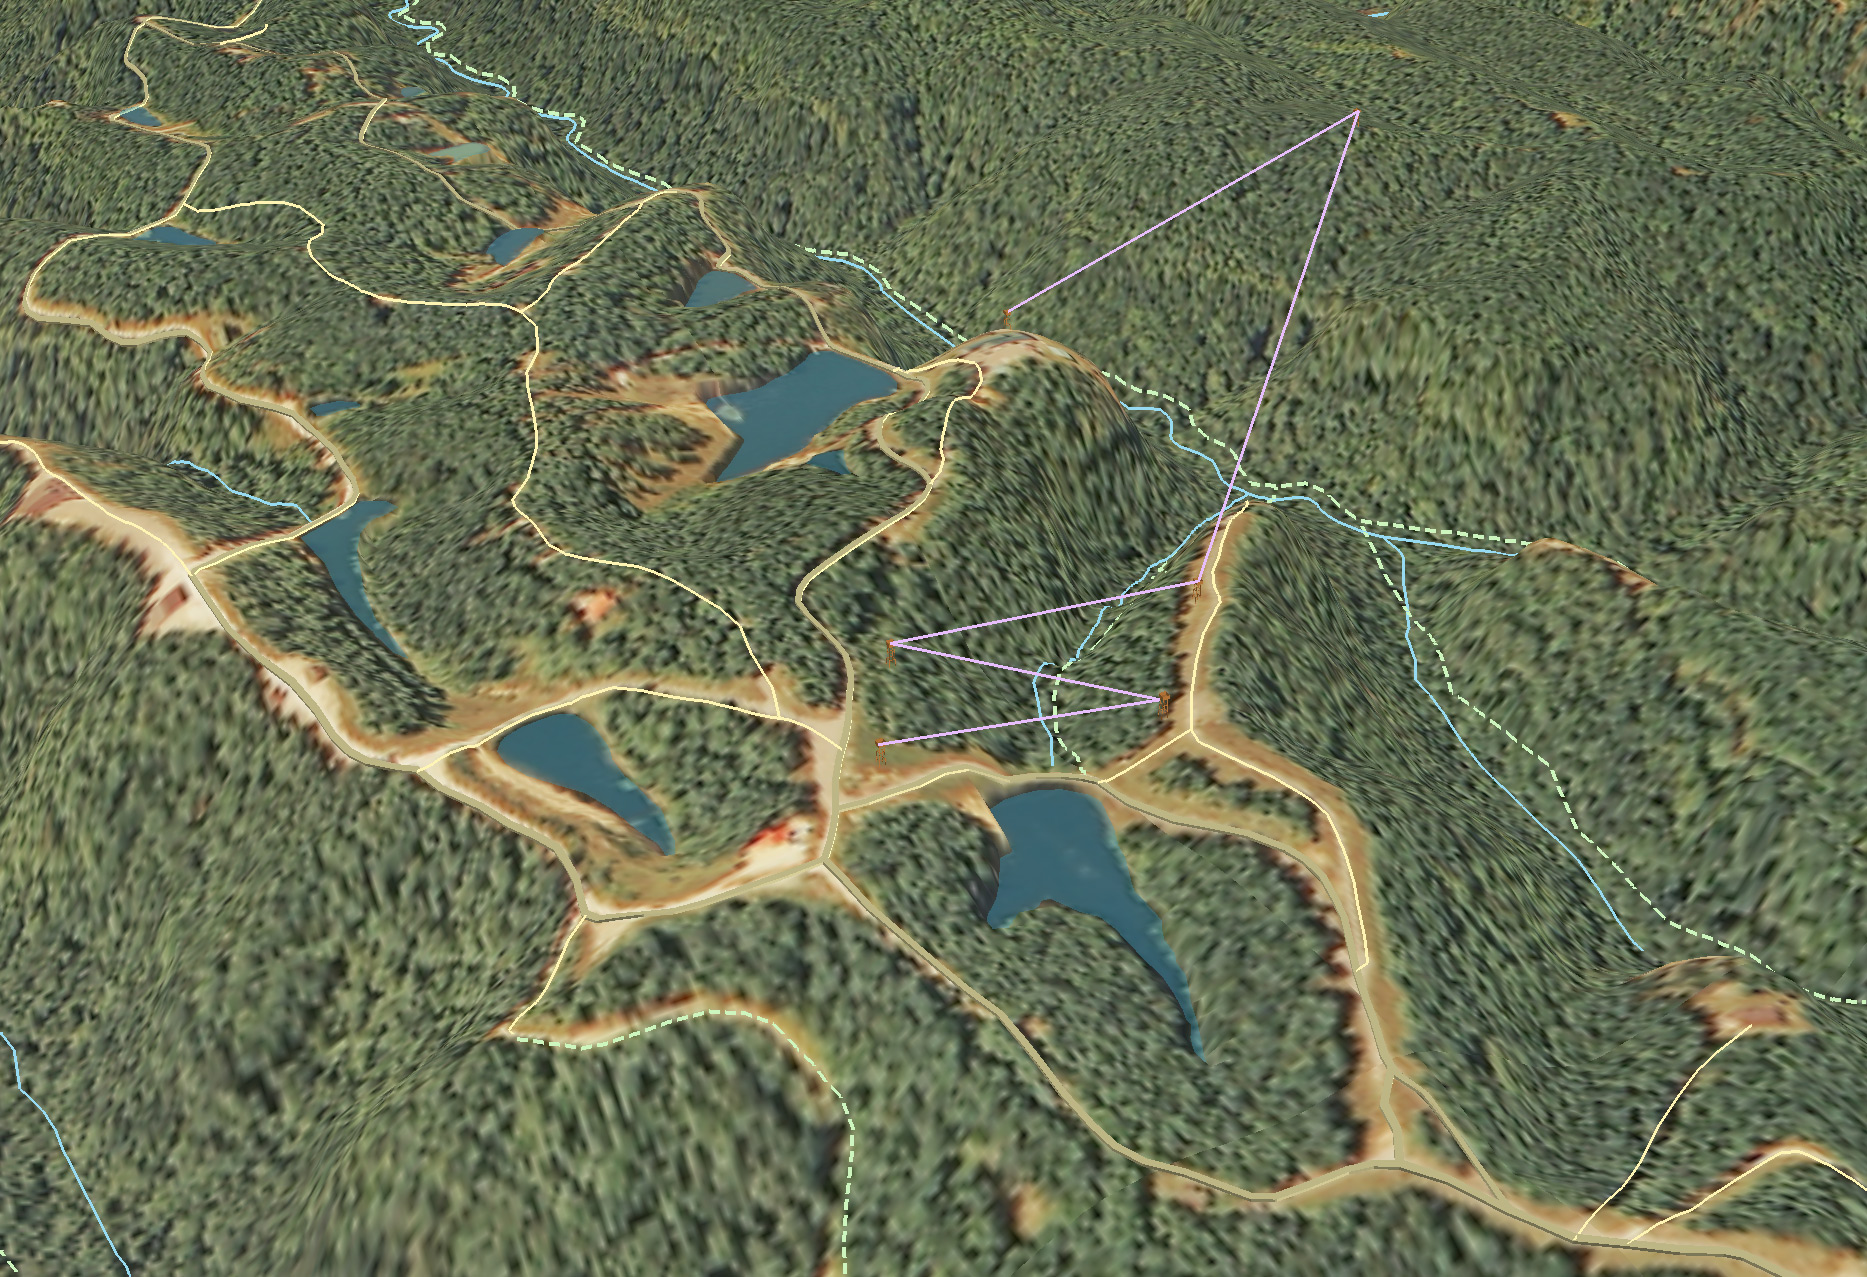
Building on our elevation profile maker, we examined height and elevation measures generated in the browser from Phase 2 elevation data within Lexington’s New Circle Road area.
Given the absence of a statewide digital surface model (DSM) for Phase 2, we created a self-hosted raster tileset. This approach encodes elevations as RGB JPEGs or PNGs, which can be natively read by browsers.
The DSM was calculated from the Phase 2 point cloud using the highest first-return in a 2-foot resolution raster. The DSM was converted to an RGB terrain. The following formula converts the three-band values to elevations:
e = (r * 256) + g + (b / 256)
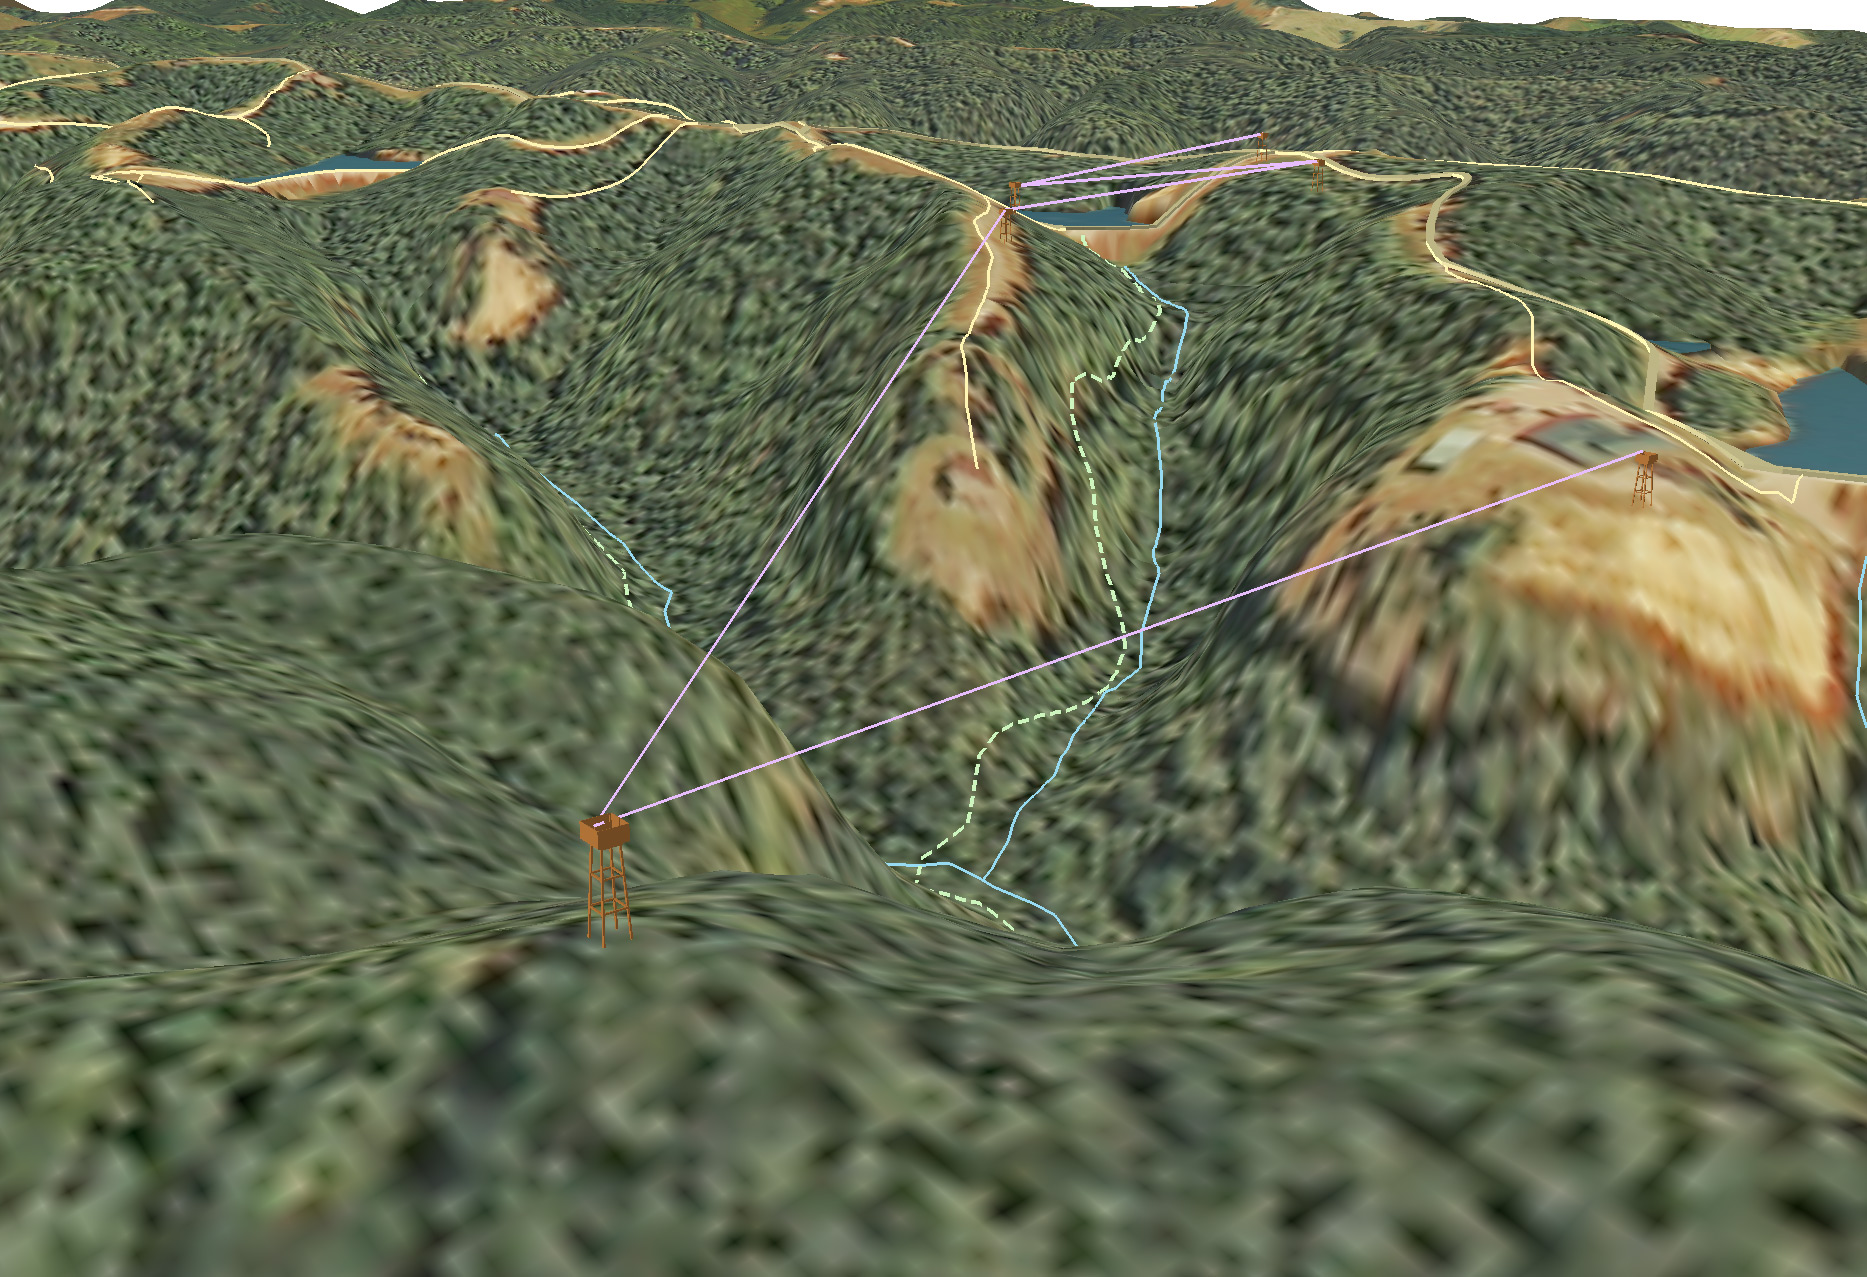
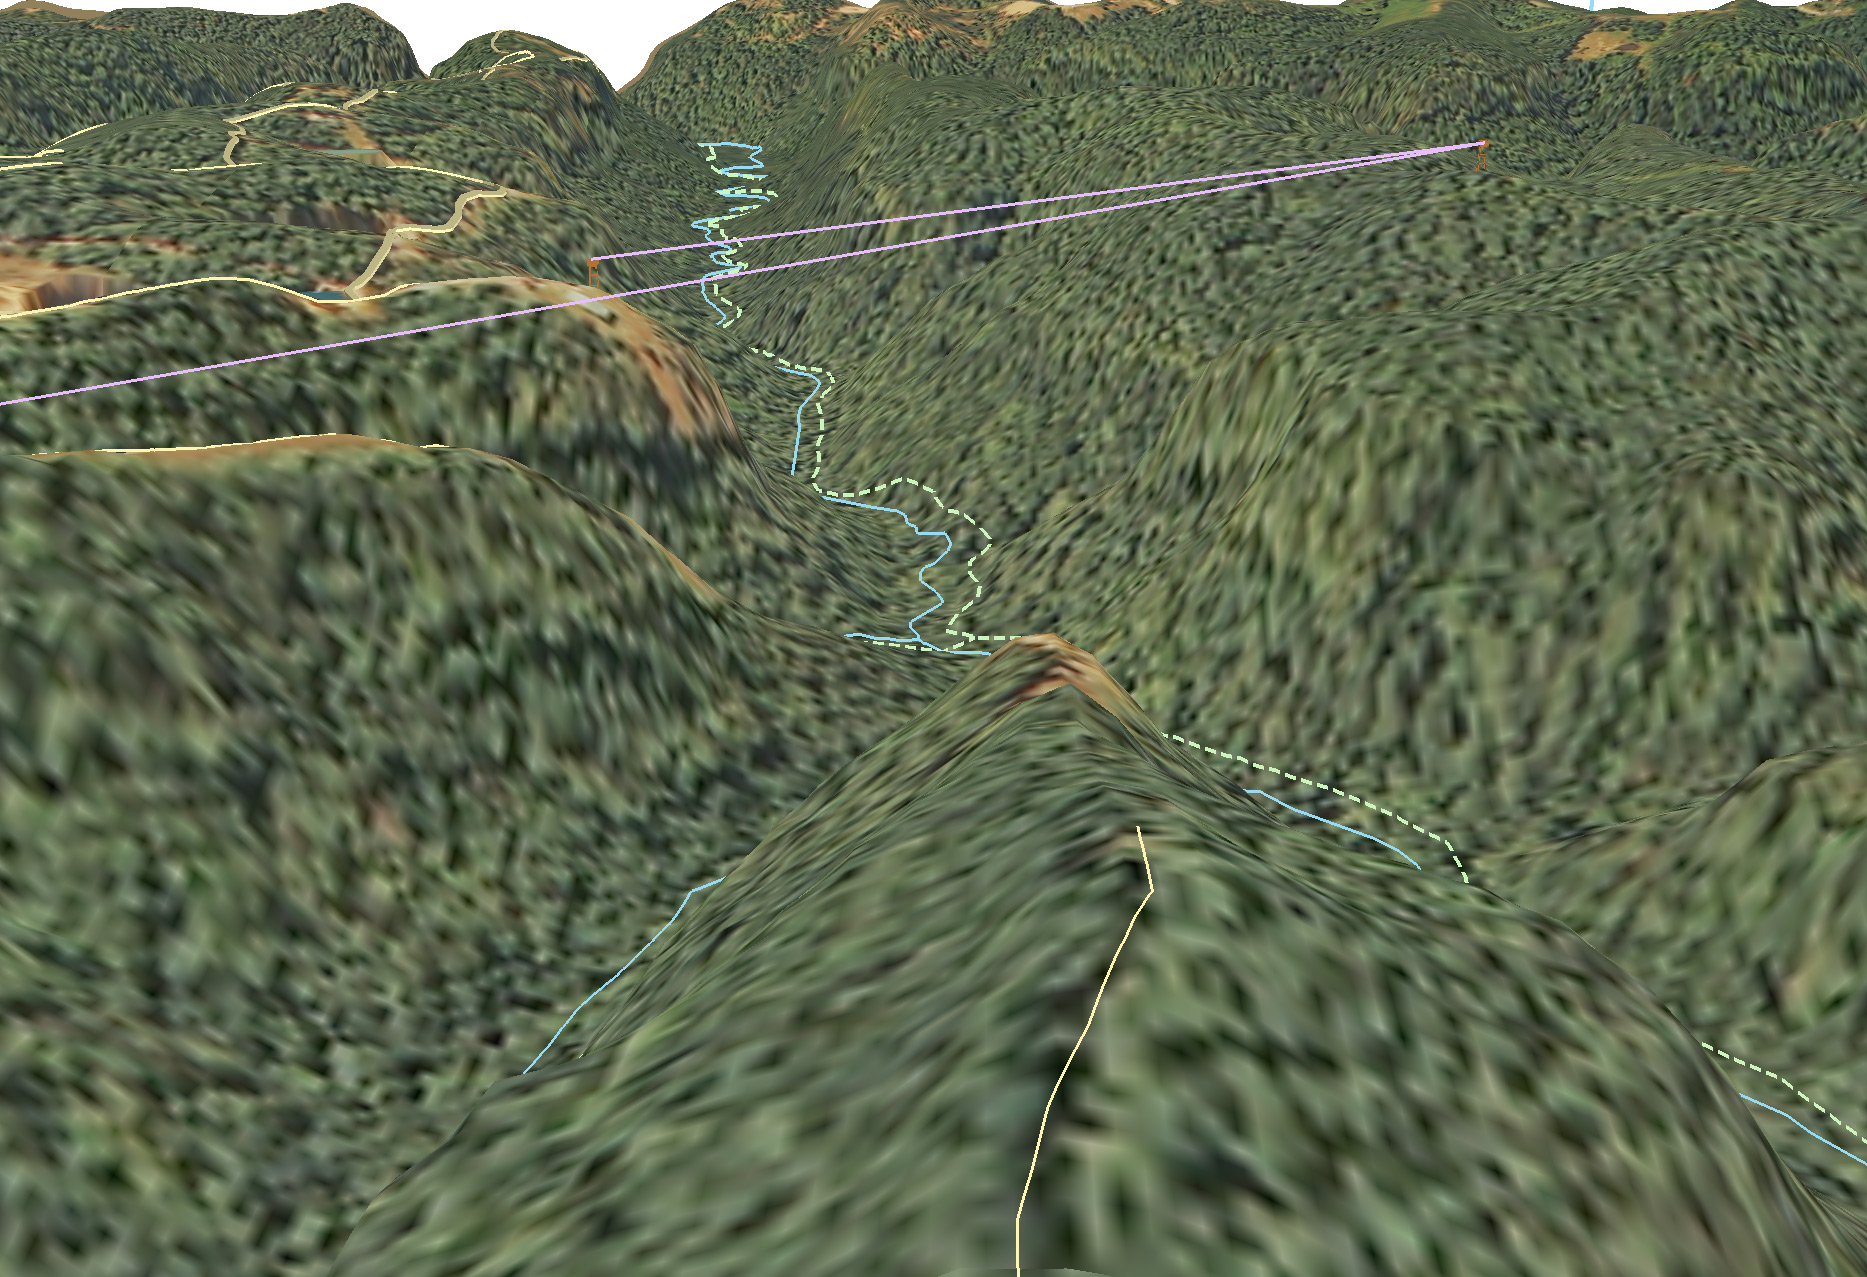
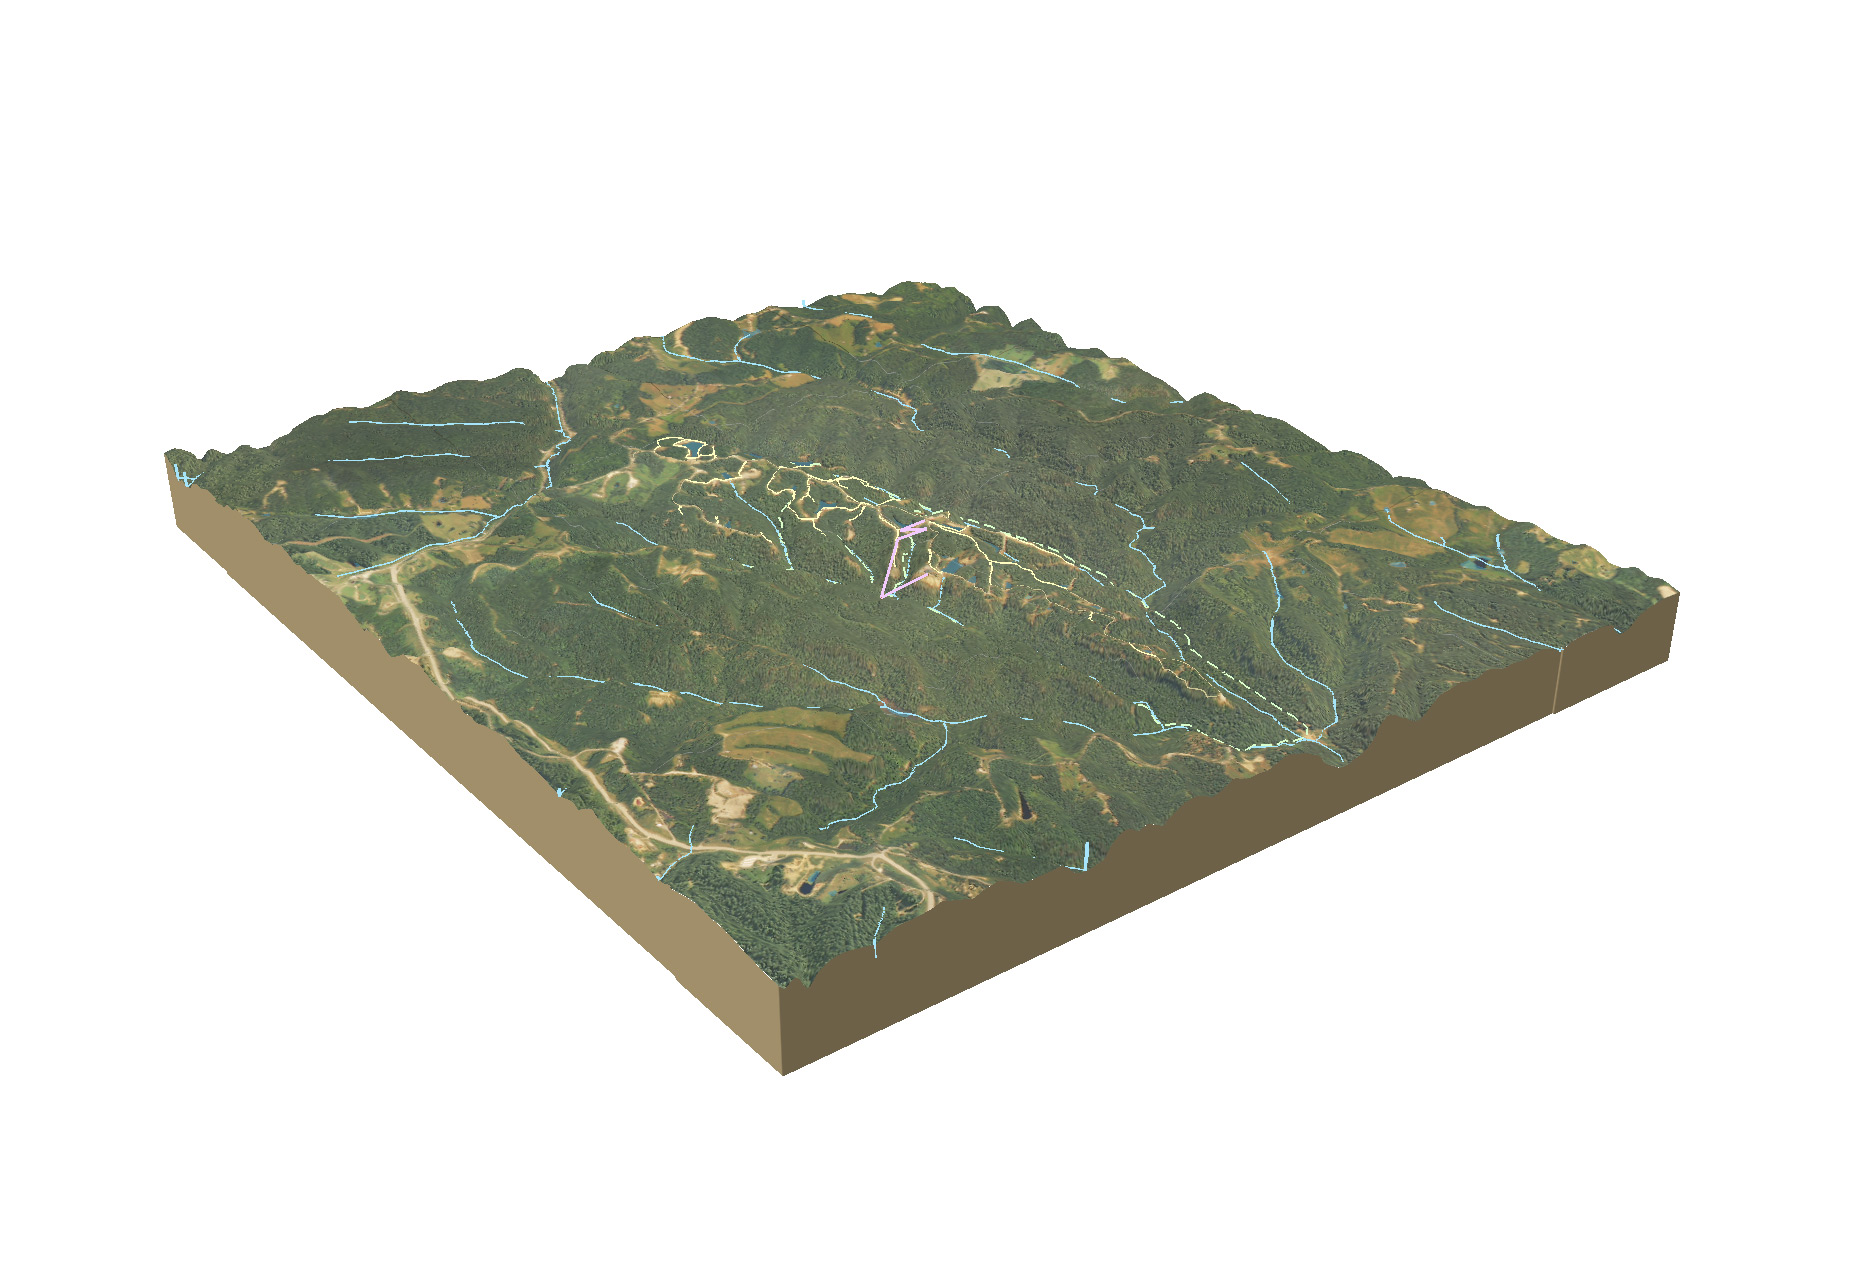
Pretty simple! This encoding works for Lexington’s range of surface elevations, has a sub-inch precision, and can be interpreted by MapLibre as a ground surface on which to drape features. A shaded relief map of the DSM with tree canopy cover height is the default base map. In terrain mode, the map becomes a 3D surface showing relative heights of features.
Height is calculated by subtracting the digital elevation model (DEM) elevation from the DSM surface elevation. The DEM is a 2-foot resolution raster that models bare-earth ground elevation and is hosted on kyraster.ky.gov.
Explore the web page here: https://boydx.github.io/urban-observation-towers
Click the map to sample heights and elevations. Export the samples as a GeoJSON for use in another application.

Enlarge screenshot from the web page


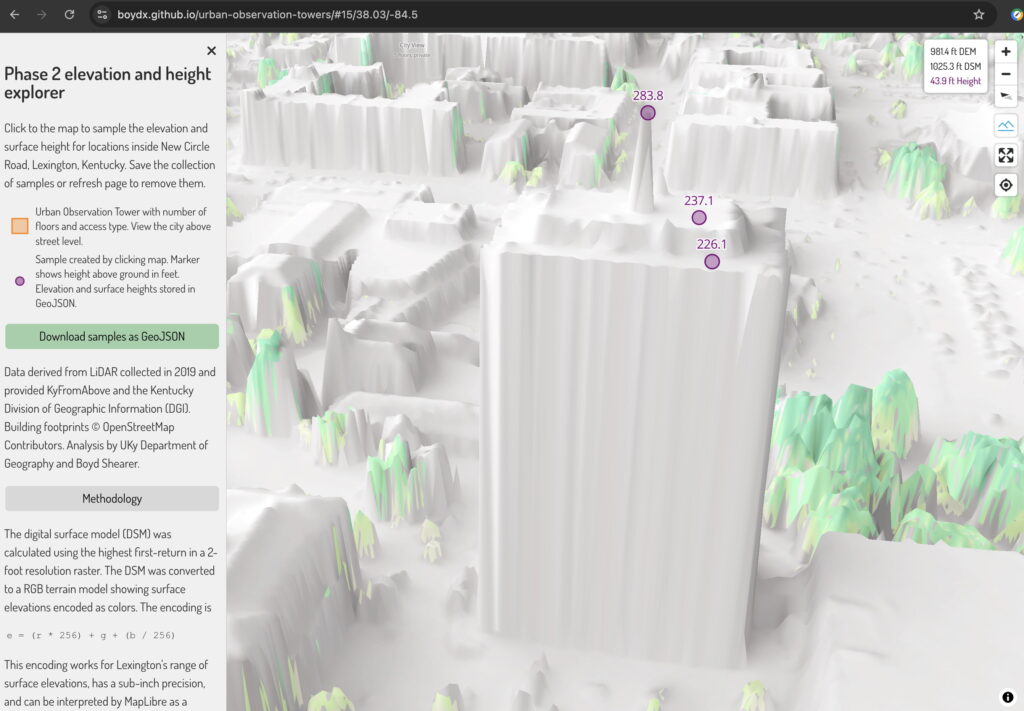
Data derived from LiDAR collected in 2019 and provided KyFromAbove and the Kentucky Division of Geographic Information (DGI). Building footprints © OpenStreetMap Contributors. Analysis by UKy Department of Geography and Boyd Shearer.


You must be logged in to post a comment.