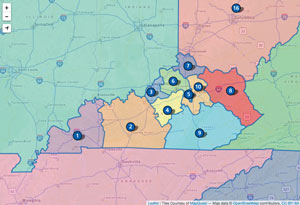
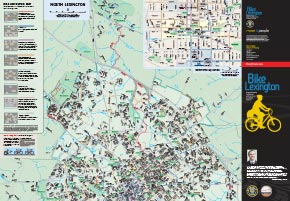
Johnson Highway Day Map

Click to open map

Click to open map

On September 20, 2014 a downtown Lexington neighborhood hosted a block party and potluck. Raffles were held, which indeed included some outrageGIS mapping hiking maps. This map is entirely custom and shows only sidewalks and the location of the block party. The map layers two different tile sets. The minimal aspect focuses one’s attention to pedestrian modes of travel, since block parties kick out the cars.

University of Kentucky Alumni Map

UoKy Alumni Districts

Click to view

A slippy map that shows alumni districts for the University of Kentucky. A shapefile of the districts was simplified with polygon edges snapped to align and then converted to a GeoJSON file. Tried to convert to TopoJSON with the hope to minimize file size, but unfortunately with little luck. District centroids were exported and converted to marker icons. A simple example of open source mapping.

More 3D maps

Open 3D map

Open draft of map in browser.

We’re almost finished with a 38″ x 13″ map of cabins and ziplines in Cliffview Resort. This is an unusual map, since it is a bird’s eye view with latitude and longitude as the index grid for locating cabins and other destinations. The base map is an ArcGIS terrain dataset with National Agriculture Imagery Program (NAIP) aerial photography draped over a rendered TIN surface in ArcScene. The maps was then composited and illustrated in Photoshop and Illustrator.

Boone Trace, A Kentucky Frontier Trail

Interactive map

Draft of interactive map, try it out.

In 1775, Daniel Boone and his party blazed a route into Kentucky and created the pioneer settlement, Boonesborough. The Trace is often confused with the Wilderness Road, since they follow the same route through southern Kentucky, but the Trace predates the Wilderness Road. Boone established the main road through the Kentucky mountains and into the outer Bluegrass. That road would later be known as the Wilderness Road. Boone Trace leaves the Wilderness Road south of Richmond, Kentucky and travels north to Fort Boonesboro.

Today, plenty of historical monuments exists along drivable portions of the Trace. BooneTrace1775.org describes, “There is a monument at the Daniel Boone Park in Flat Lick, Ky. Emblazoned on it are these words which pretty much say it all–   ‘No other trail is of greater historical significant to the founding of Kentucky and opening of the west (than Boone Trace).'”

This map attempts to show a driving tour of the Trace and aggregates many of the cultural and historical destinations once could visit today. It was designed for mobile web browsers and uses Leaflet to power the interactivity.

Flash-type interactive map, 2004

Flash-type interactive map, 2004

It’s pretty amazing to see how much dynamic web mapping has changed over the past decade. Before, we had Flash content and static layouts, as illustrated by the Elkhorn City Living Cemetery project. Today, we have data-rich maps that take a fraction of the time to create.

Working on a Cumberland Falls map

July draft of Cumberland Falls trail map

July draft of Cumberland Falls trail map

This July we have started a topographic trail map for the Cumberland Falls State Resort Park. The map will use aerial photography, 20-foot elevation contours, and GPS mapped trails. This two-sided 13.5″ x 19″ full-color map will show the entire park and connecting trails into the Daniel Boone NF, including Dog Slaughter Falls. This map is at 1:15,000 scale. The second map will zoom into the central area of the park and show trails at 1:5,000 scale. We anticipate this will be an awesome map, especially when used under a moonbow.

Cliffview Resort Perspective Views

Mass Elevation Points

Mass Elevation Points

A project to develop a large-format printed document that helps visitors navigate the resort and better understand the unique ridge. This map requires developing a terrain dataset to model cliffline and dams, because the resolution of the elevation data is not sufficient for this scale. These samples focus on the zipline tour in the resort. Hopefully, this completed map will be released in late June.

Mass Elevation Points

Mass Elevation Points

Zipline

Zipline

Zipline

Zipline

Zipline

Zipline

Block Diagram

Block Diagram

Style sample

Style sample

Lexington Walkability Analysis

How close do you live to a pedestrian path?

How close do you live to a pedestrian path?

A Pedshed is used to show how many people are connected by pedestrian paths and sidewalks with either a five-minute or fifteen-minute walk. Only roads with sidewalks are included in the analysis. It is assumed that people can walk faster on pedestrian paths (3.4 mph) than roads with sidewalks (2.8 mph).

Paved paths and sidewalks were attributed and digitized from 2010 aerial photography by students in University of Kentucky Department of Geography’s GEO 409 course, Spring 2014.

This analysis has a focus on existing access and potential future access (of various completed designs)of Lexington’s two longest shared-use trails, the Legacy and Town Branch Trails.

How more connected would Lexington be if the Legacy Trail and Town Branch Trail were completed?

How more connected would Lexington be if the Legacy Trail and Town Branch Trail were completed?

Analysis Results

Five-Minute Walk From All Existing Pedestrian Paths
Approximately 149,000 Fayette County residents (50%) live within a five-minute walk (on a sidewalk) of an existing paved pedestrian path, such as shared-use trail, park walking trail, and school walking path.

Fifteen-Minute Walk From Existing Town Branch & Legacy Trails
Approximately 11,500 Fayette County residents (approximately 3.8%) live within a fifteen-minute walk (on a sidewalk) of existing Town Branch Trail and Legacy Trail facilities. View a dynamic map of this scenario here.

Fifteen-Minute Walk From Completed Town Branch Trail Phase III Without Bridge Across Town Branch
Approximately 12,800 Fayette County residents (4.3%) would live within a fifteen-minute walk (on a sidewalk) of Phase III of Town Branch Trail and Legacy Trail facilities. This option does not include a bridge across Town Branch.

Fifteen-Minute Walk From Potential Future Town Branch & Legacy Trails (with bridge across Town Branch)
Approximately 38,900 Fayette County residents (12.5%) would live within a fifteen-minute walk (on a sidewalk) of finished Town Branch Trail and Legacy Trail facilities.  View a dynamic map of this scenario here.

Pedestrian V. Car Collision Analysis

Maps and Analysis

Maps and Analysis

Point locations for collisions were downloaded from the Kentucky Collision Analysis for the Public (http://crashinformationky.org/) hosted by the Kentucky State Police. Analysis was performed for Kentucky’s Fayette and Jefferson Counties for data period January 5, 2003 – February 23, 2014 as part of University of Kentucky Department of Geography course GEO 409, Spring 2014.

Combined Maps. Click individual county for map.

Combined Maps. Click individual county for map.

Louisville Statistics

  • AMONG ALL COLLISIONS
    4,592 pedestrians v. car collisions occurred with 173 pedestrian fatalities (3.8% of total) and 4223 pedestrian injuries (92% of total).
  • AMONG ALL COLLISIONS WITH PEDESTRIANS USING ALCOHOL OR DRUGS
    257 pedestrians v. car collisions occurred with 26 pedestrian fatalities (10%) and 227 pedestrian injuries (88% of total).
  • Rate: 6.1 collisions per 1,000 current residents
  • Download Map

Lexington Statistics

  • AMONG ALL COLLISIONS
    1,689 pedestrians v. car collisions occurred with 47 pedestrian fatalities (2.9% of total) and 1580 pedestrian injuries (94% of total).
  • AMONG ALL COLLISIONS WITH PEDESTRIANS USING ALCOHOL OR DRUGS
    130 pedestrians v. car collisions occurred with 9 pedestrian fatalities (6.9%) and 118 pedestrian injuries (91%).
  • Rate: 5.5 collisions per 1,000 current residents
  • Download Map

Analysis and maps by Boyd Shearer.

Scenic Landscape Index

Fayette County, Kentucky

Fayette County, Kentucky

Summary
This index favors more natural settings such as rural areas, forests, stream valleys, larger public parks, and areas of high relief. National Register of Historic Properties are included and while most properties were small and located in the urban core, larger properties with tree canopy scored a relatively high value in the index; Ashland and the Lexington Cemetery are examples. Locations in southern Fayette County scored the highest values because of their proximity to the forested cliffs of the Kentucky River Palisades. Neighboring river tributaries, such as Boone Creek and Elk Lick, extend high scenic values northward.

Link to full version of map

Link to full version of map

The area with highest contiguous value is Raven Run Park, primarily because it is publicly accessible, though unfortunately not during the time one might watch a sunrise or sunset. Notable scenic corridors are found along Town Branch, and the North and South Forks of Elkhorn Creek. Because the data used to calculate this index is from 2001 and 1998, some areas that score a high value, e.g. Hamburg area, have since been altered and would score lower values as the density of the built environment increased.

Methodology
Scenic conditions were converted to raster datasets and assessed an integer value based on a location’s proximity to tree canopy, water, historic areas, parks, scenic roads, and the probability of seeing a sunrise or sunset at that location. Those conditions are shown in the Fayette County maps found at the bottom of this page. A location is defined as a 5-foot resolution raster cell. Using Map Algebra, all raster datasets were overlaid to find which locations had the greatest number of scenic conditions. The resulting map provides a relative scenic landscape index. Locations with higher values in the index have more scenic conditions. For example, areas with the highest values offer the best chance to see a sunrise or sunset in a natural setting of forested parks, historic areas, or rural places with ponds or lakes. Areas with the lowest values are primarily dense urban environments without tree canopy cover, parks, historic areas, or ponds.

Layers in Index
Views of Sunsets and Sunrises is an index of areas to view sunsets and sunrises on the solstices, assuming one has a clear view of the sun at 8 degrees above the horizon on these two days. Areas that had the most likely view of a sunset or sunrise were awarded more value than areas with a less likely view.

Proximity to Tree Canopy and Water is an index of areas that are under tree canopy or on a waterbody (greater than a 1/4 acre), or within 200 feet of either. Any of these conditions awarded equal value in the index. Tree canopy derived from 1998 aerial photography.

Parks, National Register of Historic Properties, and Scenic Roads is an index of areas that were state parks or passive natural setting parks were awarded higher value in the index. Community parks, publicly accessible national register properties, and areas within 500 feet of county designated scenic roads were awarded lower, but equal, value in the index.

Densely Built Urban Environment is an index of areas with increasing density of built environment were awarded lower values in the index. Derived from the 2001 National Land Cover Database.

Bicycle vs. Car Crash Analysis

Lexington, Kentucky. October 15, 2008 – October 14, 2013.

Lab_3_previewAn analysis of bicycle accidents reported by Kentucky law enforcement agencies over 5 years in Fayette County.

Within Fayette County, 396 bicycle and motor vehicle collisions were reported with 293 injuries and 3 fatalities. The average age of the cyclist was 29 years, 76% were male, and only 25% were wearing a helmet. 21% of the collisions were hit-and-run. The greatest rate, or density, of crashes centers on UK’s campus. The next highest density was downtown, followed by small increases in crashes near Harrodsburg and Waller Ave, Winchester Rd, and on Loudon Ave. Critical street segments in order of greatest number of crashes are: Limestone north of Virginia Ave, Euclid Ave east of Woodland Ave, Rose St between Euclid and Huguelet Dr, and Winchester Road near intersection with East Third St.

Lab_3.Preview_Build

Of all workers (16 years and older) living in the Urban Service Area, only 0.94% say the actively bike commute to work. Within 0.5 miles of a bike lane or sharrow, the share of workers saying they bike commute rises to 1.7%. Also, 89% of bike commuters live within a half mile of a bike lane or sharrow. It is estimated that 25% of all reported accidents have happened on streets with a sharrow or bike lane.

Maps and analysis by Boyd Shearer for GEO 309, NRE 355, and LA 855, October 20, 2013. University of Kentucky. Data acquired from the Kentucky State Police’s Kentucky Collision Analysis for the Public database (http://crashinformationky.org/) and the 2007-2011 American Community Survey 5-Year Estimates for Block Groups (http://www.census.gov/geo/maps-data/data/tiger-data.html).


Distressed Kentucky Areas

Ky Distressed Areas

A GIS analysis

Socioeconomic and Environmental Distress by Block Group in Kentucky

A preliminary fact: Landsat Annual Timelapse 1984-2012 (from Google’s Earth Engine project) shows a glimpse of the vast impact of surface mining in the eastern Kentucky coal fields.

Kentucky’s population is nearly balanced between urban and rural. 52% of Kentucky’s population lives in rural census block groups¹. Economic and social distress² is more likely to occur in rural areas. 61% of Kentucky’s distressed population lives in rural areas.

Surface coal mining³ mostly occurs in rural areas and the highest rate of mine permits to population occurs in distressed rural areas. 99.3% of mine permits exist in rural areas.

The rate of mine permits to persons is 12.8 permits per thousand residents in all distressed areas, 4.24 permits per thousand residents in transitional areas, and .221 permits per thousand residents in non-distressed areas. In the most severely distressed rural areas, the rate is the highest at 32.0 permits per thousand residents.

61.2% of all distressed rural areas have mine permits.

2013 Veterans Park Mountain Biking Trail Map

4.8-mile loop trail & out and back all on singletrack.

In tribute to Bike Lexington month, we’ve made a new map for beginning mountain bikers. If you’re new to trail riding and want tight, banking turns on fast, easy trail, then visit’s Lexington’s Veteran’s Park.

We created this map as a demonstration of small-area map making. We first walked the trail with a Trimble GPS unit this past winter to accurately locate the trail. We then used Kentucky’s new aerial photography and LiDAR elevation data to make 5-foot contours and heads-up digitized canopy coverage. We also pulled in the impervious and waterbody layers from the new Open Data Portal from LFUCG. This is all GIS data that has been created and/or made available in the past six months.

More nerd alert. The recent availability of small-scale mapping data is awesome. We thought we’d try to see how good this data is and make trail elevation profiles, which is included with this map. While the elevation profile is not perfect at this scale (with perhaps a +/- 8 ft height error for any given point on the profile), it gives a good distance measurement and represents well the relative slope of the trail. Since the vertical scale is not the same as the horizontal scale, the profile exaggerates the pumps & humps a rider faces…which means, the slopes are exaggerated.

Enjoy and tell us what you think.

Panama Adventure Hiking Elevation Profiles

Elevation profiles for adventure hiking.

Elevation profiles for adventure hiking.

Looking for a spring adventure? We designed a website and these elevation profiles for a client that creates custom tour packages for Boca Chica, Panama. Below are descriptions of a few tours one could enjoy before the rainy season.

Amistad Adventure Trek
Hike a truly unique and extreme jungle trail from the cloud forests to the Caribbean lowlands in this united National Park of Panama and Costa Rica. A 42-kilometer trek with 2,500 meters terrain relief that you hike in 3 days.

Comarca Adventure Trek
Explore remote forested regions and Caribbean slopes of the Panama cordillera. A 46-kilometer trek with 1,300 meters terrain relief that you hike in 4 days. The trail is filled with amazing views, steep climbs and descents as you traverse the footpaths of the Ngabe Indian Reservation.

When you need a new adventure, ExploreBocaChica.com

Carter Caves Trail Map

Carter Caves State Resort Park Trail Map. 1:16500 scale with Tygarts State Forest. Click to download PDF.

This topographic map shows official trails in the Carter Caves State Resort Park and neighboring Tygarts State Forest. The map contains detailed trail descriptions and an inset map for the trails around the campground and lodge. A one-color free version of the map is available at the park visitors center. A full-color map is available for purchase or download a digital copy here.

2012 Bike Lexington Map

This map is freely available at local bike shops and as an electronic download.

We are proud to announce the release of the Bike Lexington Map which locates bicycling facilities and preferred routes in Lexington, Kentucky. The purpose of the map is to show existing facilities (such as bike lanes and shared-use paths) and preferred routes (wider roads with low volume and/or low speed)  to encourage cycling and help cyclists plan trips through the city.

This 27″ x 39″ free, full-color map can be found at local bicycling shops and the Bread Box’s Broke Spoke and West 6th Street Brewing. UK students can pick up the map at Wildcat Wheels. Other outlets are sure to be added.

Digital PDF copies are offered in a few versions.

  1. The official map (7 megabytes) is the version printed.
  2. A map with aerial photography (49 megabytes) shows the built environment and surrounding countryside.
  3. A map book (27 megabytes) allows for easier printing and mobile use.
0

Your Cart