Bicycle vs. Car Crash Analysis

Lexington, Kentucky. October 15, 2008 – October 14, 2013.

Lab_3_previewAn analysis of bicycle accidents reported by Kentucky law enforcement agencies over 5 years in Fayette County.

Within Fayette County, 396 bicycle and motor vehicle collisions were reported with 293 injuries and 3 fatalities. The average age of the cyclist was 29 years, 76% were male, and only 25% were wearing a helmet. 21% of the collisions were hit-and-run. The greatest rate, or density, of crashes centers on UK’s campus. The next highest density was downtown, followed by small increases in crashes near Harrodsburg and Waller Ave, Winchester Rd, and on Loudon Ave. Critical street segments in order of greatest number of crashes are: Limestone north of Virginia Ave, Euclid Ave east of Woodland Ave, Rose St between Euclid and Huguelet Dr, and Winchester Road near intersection with East Third St.

Lab_3.Preview_Build

Of all workers (16 years and older) living in the Urban Service Area, only 0.94% say the actively bike commute to work. Within 0.5 miles of a bike lane or sharrow, the share of workers saying they bike commute rises to 1.7%. Also, 89% of bike commuters live within a half mile of a bike lane or sharrow. It is estimated that 25% of all reported accidents have happened on streets with a sharrow or bike lane.

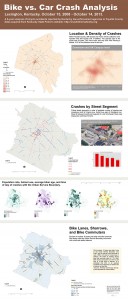
Maps and analysis by Boyd Shearer for GEO 309, NRE 355, and LA 855, October 20, 2013. University of Kentucky. Data acquired from the Kentucky State Police’s Kentucky Collision Analysis for the Public database (http://crashinformationky.org/) and the 2007-2011 American Community Survey 5-Year Estimates for Block Groups (http://www.census.gov/geo/maps-data/data/tiger-data.html).


Leave a Reply

0

Your Cart