Projects using KyFromAbove data

The KyFromAbove initiative from Kentucky's Division of Geographic Information collects and publishes open data for aerial and elevation observations. What can we do with it?

Phase 3 oblique photograph explorer

KyFromAbove released Phase 3 aerial photography, including oblique imagery, in Spring 2025. The images are available to download and are open data. However, finding the right set of images to download might be a task.

This viewer allows you to zoom in and see the available images for each exposure point, which takes 5 images: one nadir and four at cardinal directions. With 885,789 exposures, that’s over 4.4 million images, which range between 40 MB and 100 MB at roughly 10k x 15k pixels per image.

You can interactively search and download them through this website:

boydx.github.io/phase-3-oblique-centroids

You can interactively

  • toggle between oblique image centroids and exposure points (the paper airplane symbol),
  • discover the cardinal direction of each exposure,
  • place approximate frame extents for each selected oblique centroid,
  • interactively download full-resolution images, and
  • download a GeoJSON of these polygons with metadata in its attributes.

The oblique images are hosted as TIFFs on a KyFromAbove AWS S3 bucket and can be previewed on mobile devices using modern browsers.

Below are some screenshots of the viewer and oblique images.

Oblique of Frankfort Oblique of Frankfort

Viewer interface Viewer interface

Viewer interface Viewer interface

Viewer interface Viewer interface

Oblique of Laurel Lake Oblique of Laurel Lake

Search by flight and shot ID Search by flight and shot ID

Attributes of image footprint centroid Attributes of image footprint centroid

Change in surface height explorer

Can we detect changes in surface height over time, at a neighborhood scale? The changes in heights represent the loss and growth of trees, buildings, and other features of the built environment.

KyFromAbove has multiple phases of lidar point clouds for Kentucky as open data. In this interactive map of Lexington, Kentucky (inside New Circle), we demonstrate how to visualize and explore these changes in surface height between 2010 (Phase 1) and 2019 (Phase 2) lidar point clouds.

While most point clouds are colorized by aerial photography to give a realistic view of the surface, this project uses a different approach. Points are colorized by the amount of change in surface height between the two phases. The color scale is from red (decrease in height) to blue (increase in height). Both phases are shown simultaneously with the ability to toggle the visibility of each phase.

View the interactive Potree scene viewer (which is VR-enabled) through this website:

contig.us/hawaii/lex-change

Below are some screenshots of the viewer focused on Kentucky Proud Park at the University of Kentucky campus.

Phase 1 decrease in height Phase 1 decrease in height

Phase 2 increase in height Phase 2 increase in height

Phases combined Phases combined

Phase 2 colorized with aerial photography Phase 2 colorized with aerial photography

Ky Quick GPS Note Taker

Have you ever needed to create a quick GPS track, plot a few points on a map, and generate shareable spatial data on the fly in the field? This browser app utilizes your browser’s local storage to save GeoJSON features as you create them interactively, using your mobile device’s GPS or manually placing points. Your data is kept on your device and is never shared until you decide to export a GeoJSON file. The base maps in this app use KyFromAbove’s latest high-resolution aerial imagery and elevation data.

Start GPS mapping through this website:

boydx.github.io/ky-quick-gps

Viewer interface Viewer interface

Viewer interface Viewer interface

Viewer interface Viewer interface

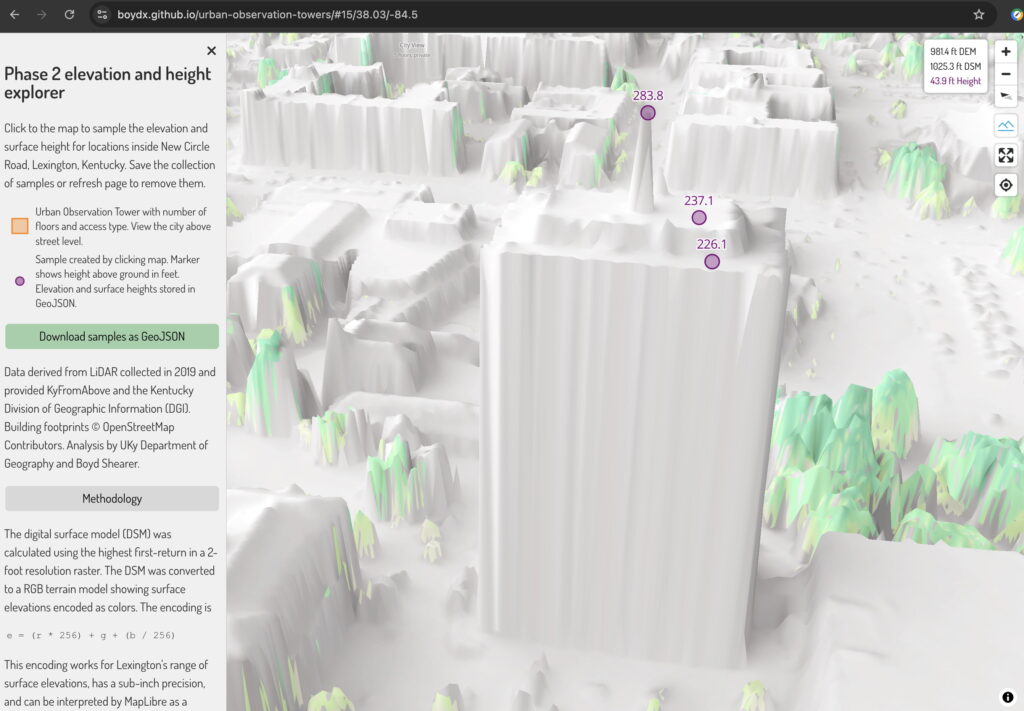
Phase 2 elevation and height explorer

Building on our elevation profile maker, we examined height and elevation measures generated in the browser from Phase 2 elevation data within Lexington’s New Circle Road area.

Given the absence of a statewide digital surface model (DSM) for Phase 2, we created a self-hosted raster tileset. This approach encodes elevations as RGB JPEGs or PNGs, which can be natively read by browsers.

The DSM was calculated from the Phase 2 point cloud using the highest first-return in a 2-foot resolution raster. The DSM was converted to an RGB terrain. The following formula converts the three-band values to elevations:

e = (r * 256) + g + (b / 256)

Pretty simple! This encoding works for Lexington’s range of surface elevations, has a sub-inch precision, and can be interpreted by MapLibre as a ground surface on which to drape features. A shaded relief map of the DSM with tree canopy cover height is the default base map. In terrain mode, the map becomes a 3D surface showing relative heights of features.

Height is calculated by subtracting the digital elevation model (DEM) elevation from the DSM surface elevation. The DEM is a 2-foot resolution raster that models bare-earth ground elevation and is hosted on kyraster.ky.gov.

Explore the web page here: https://boydx.github.io/urban-observation-towers

Click the map to sample heights and elevations. Export the samples as a GeoJSON for use in another application.

Screenshot from the web page
Enlarge screenshot from the web page

Screenshot from the web page
Enlarge screenshot from the web page

Screenshot from the web page
Enlarge screenshot from the web page

Elevation explorer looking at the height of Patterson Office Tower
The three heights of Patterson Office Tower

Data derived from LiDAR collected in 2019 and provided KyFromAbove and the Kentucky Division of Geographic Information (DGI). Building footprints © OpenStreetMap Contributors. Analysis by UKy Department of Geography and Boyd Shearer.

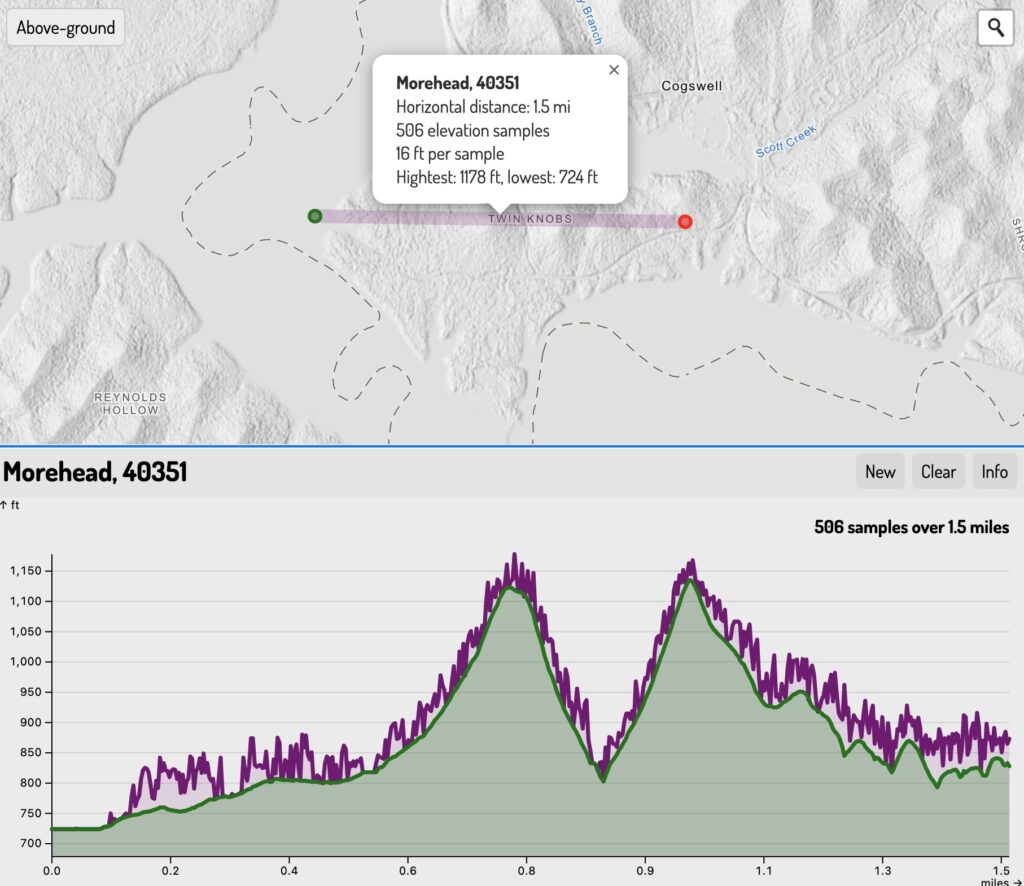
Kentucky elevation profile maker

Kentucky has multiple statewide elevation layers derived from lidar point clouds. KyFromAbove Phase 1 lidar has both a 5-foot resolution ground (bare-earth) and above-ground (trees and buildings) elevation models hosted as open raster data.

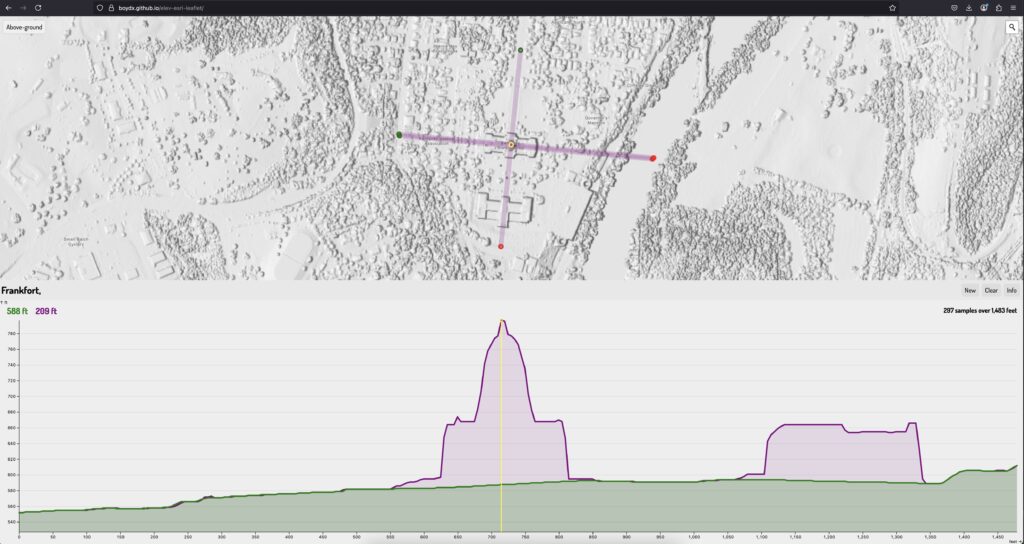
We can query these layers to find ground and surface feature elevations at specific locations, such as along a line. These elevation profiles are useful in urban planning, environmental studies, and infrastructure development.

Create elevation profiles and save the data as JSON.

boydx.github.io/ky-profiles.

Below are a screenshots from the web page.

Twin Knobs show ground and trees
Kentucky Capitol is 209 feet tall

Kentucky elevation profile maker
Creating multiple profiles at Laurel Lake

Downloading them as JSON for use in other applications

KyFromAbove Data Explorer

KyFromAbove has three phases of collecting high-resolution aerial imagery and elevation data. Over the last few weeks, we have made a four browser apps with MapLibre GL JS, Leaflet, and Esri JavaScript APIs that allow users to visualize and interact with the data from each phase. This page provides links to the apps:

boydx.github.io/kyfromabove

KyFromAbove Data Explorer KyFromAbove Data Explorer
Shaded relief and 3D visualization in the browser

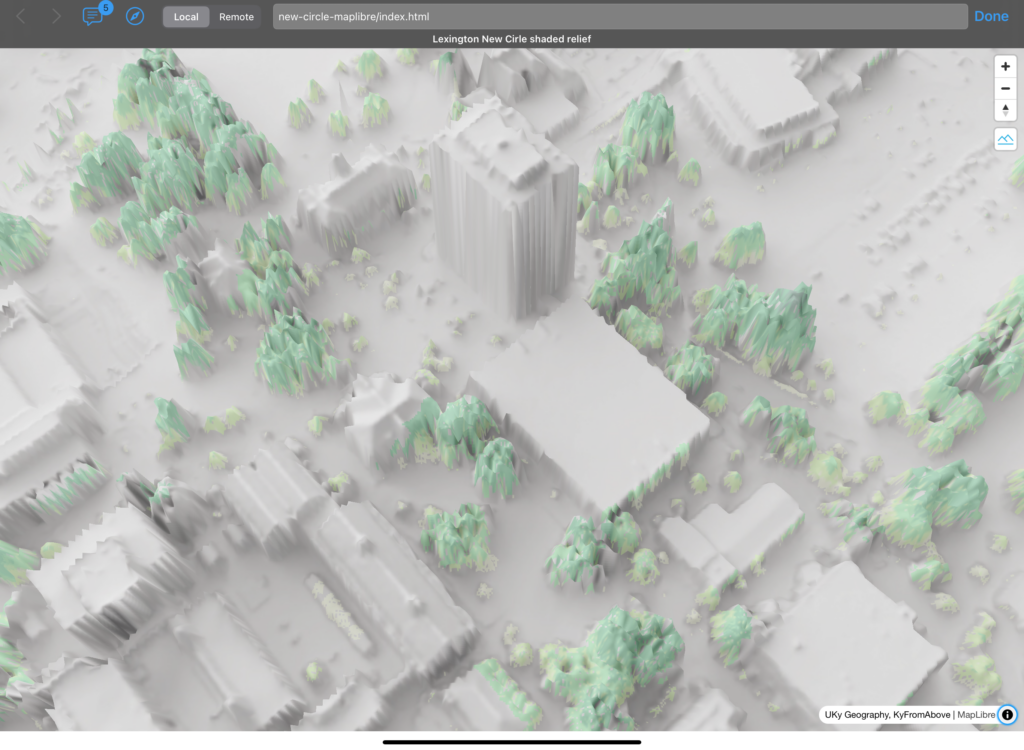
KyFromAbove has long produced elevation datasets for the public. Using their Phase II lidar point clouds, we created a new shaded relief and DEM raster tile sets for web mapping. While most mapping applications focus on ground elevations, we use the above-ground elevations to make a digital surface model (DSM). These elevations show buildings, trees, and even cars.

These above-ground elevations, however, have unique challenges. The latest project attempts to minimize errors and create visually impactful shaded relief and RGB terrain layers from DEMs for elevations.

Check out the preview here: outrageGIS.com/maps/new-circle

Screenshot map web page

Lexington’s UKy campus

Terrain Explorer

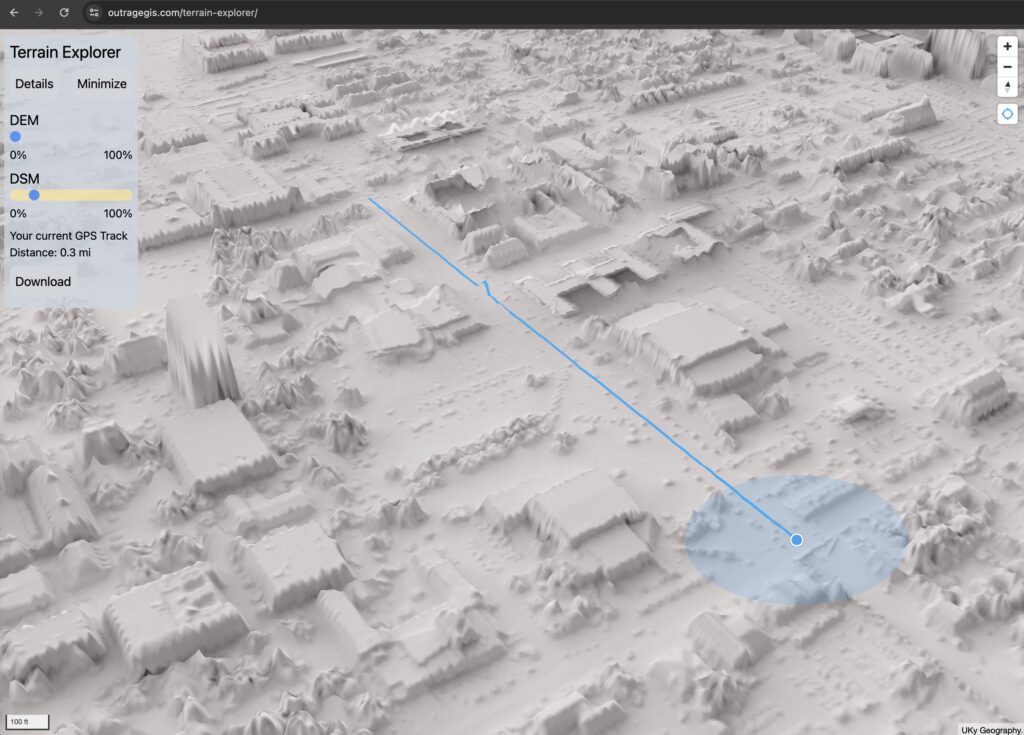
In this web map, we explore how to use different elevation models in 3D maps. The KyFromAbove project collects and maintains high-resolution elevation data and aerial imagery for Kentucky. The bare-earth Digital Elevation Model (DEM) was created from a lidar point cloud. This is the typical elevation model that we use. The same point cloud was then filtered to create a Digital Surface Model (DSM) showing above-ground elevations, like buildings and trees. Both of these elevation models were converted to terrain tiles to use in web mapping applications. MapLibre GL JS 3D features terrain rendering with RGB-encoded elevation raster tiles.

Terrain Explorer
Explore different terrain models at outragegis.com/terrain-explorer/

The sliders allow the viewer to change the vertical exaggeration of the DEM and DSM. If geolocation is enabled, a track will record the viewer’s location. That track can be downloaded as a GeoJSON (works in Chrome).

Visit the page: outragegis.com/terrain-explorer/

This was a project in the UKy Geography MAP 675, a course in the department’s Digital Mapping MS graduate program. The aerial imagery and elevation data are from 2019.

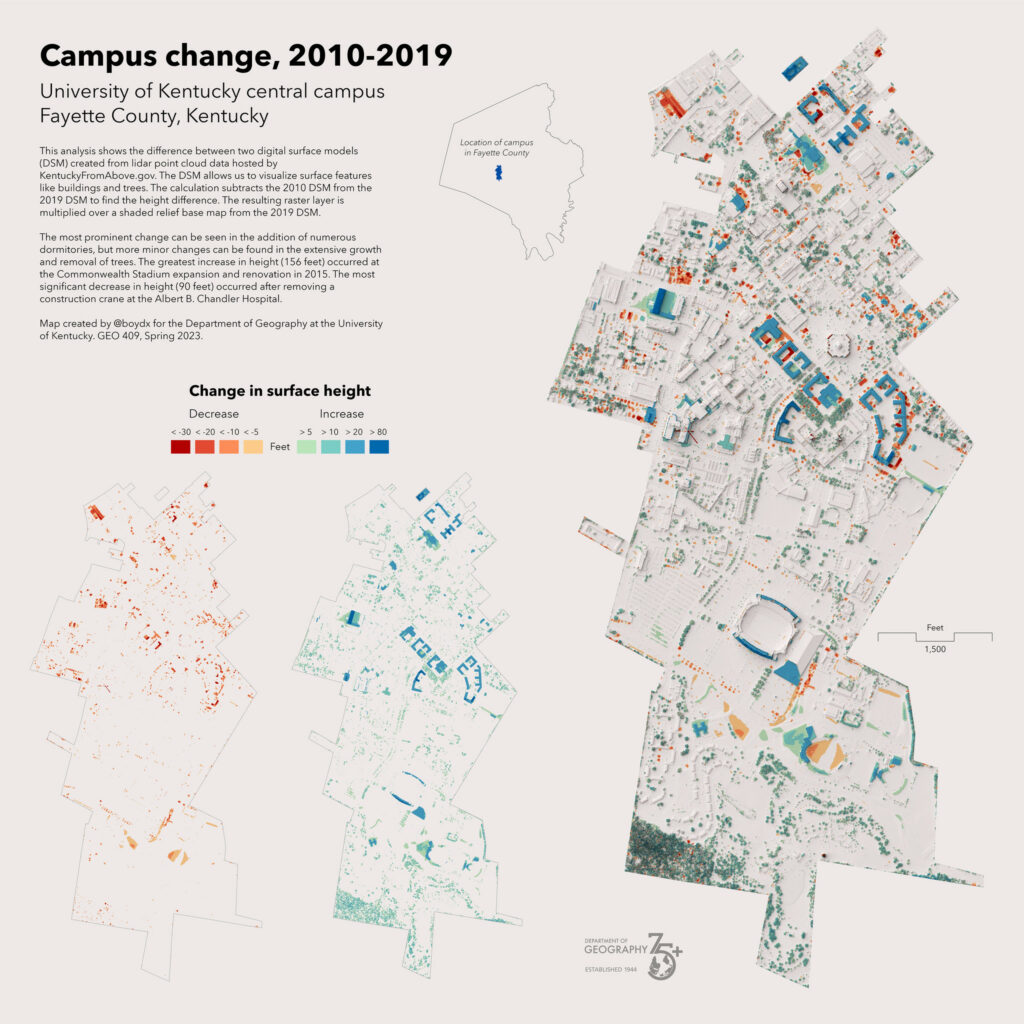
Campus change, 2010-2019

Winner: Best Spatial Analysis at the 2023 Kentucky Association of Mapping Professionals annual conference.

This analysis shows the difference between two digital surface models (DSM) created from lidar point cloud data hosted by KentuckyFromAbove.gov. DSMs allow us to visualize surface features like buildings and trees. The calculation subtracts the 2010 DSM from the 2019 DSM to find the height difference. The resulting raster layer is multiplied over a shaded relief base map from the 2019 DSM.

Campus change, 2010-2019

The most prominent change is the addition of numerous dormitories, but the more minor changes are the extensive growth and removal of trees. The greatest increase in height (156 feet) occurred at the Commonwealth Stadium expansion and renovation in 2015. The most significant decrease in height (90 feet) occurred after removing a construction crane at the Albert B. Chandler Hospital.

View map and other visualizations of change: https://boydx.github.io/uky-campus/

@boydx Department of Geography at the University of Kentucky. GEO 409 Spring 2023.

GEO 509: Report Fall 2022

An analysis of flood-prone infrastructure and conditions in selected Eastern Kentucky watersheds.

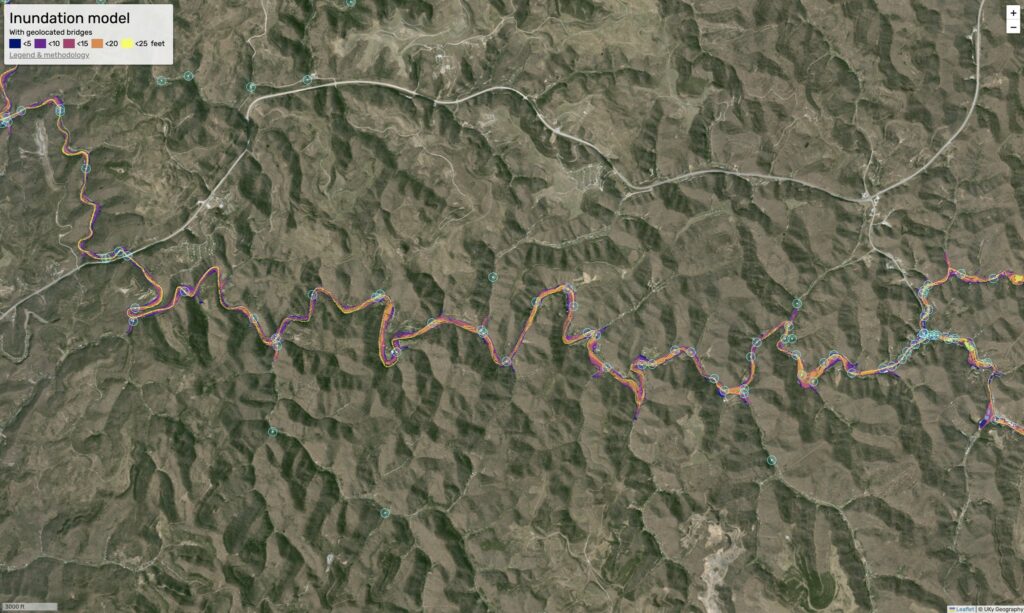
In July 2022, eastern Kentucky experienced historic and devastating flash flooding caused by 14–16 inches of rainfall in a 5-day period. The National Weather Service gave a 1 in 1000 chance of this much rain falling during this period.

View maps and report: https://uky-gis.github.io/geo509/report-2022

Department of Geography, University of Kentucky, College of Arts and Sciences
December, 2022

Custom shaded relief maps

After a few weeks fiddling with the Blender 3D application to make smooth shaded reliefs, I decided to create raster tilesets that could be used with web mapping applications for a unique look. While the shading is not as accurate as multidirectional shading techniques used in GDAL and ArcGIS Pro, it makes a more artistic rendering.

To view a web page with samples, check out boydx.github.io/hugo-maps and also learn about the New Maps Plus program at the University of Kentucky).

Examples

Open ground features (click for high-resolution 13k version)
Kentucky bare-earth hillshade (click for hi-res 23k image)
0

Your Cart