National Land Cover Database on SheltoweeTrace.com

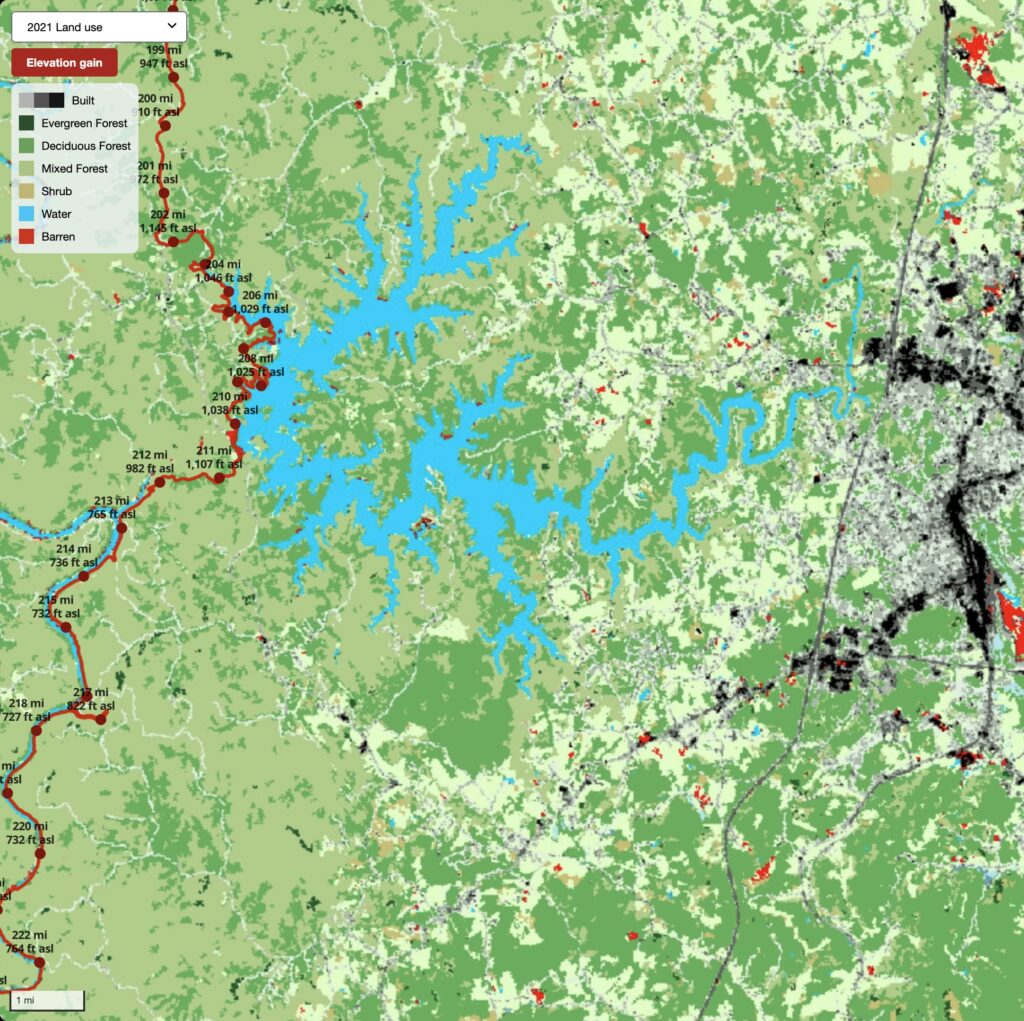
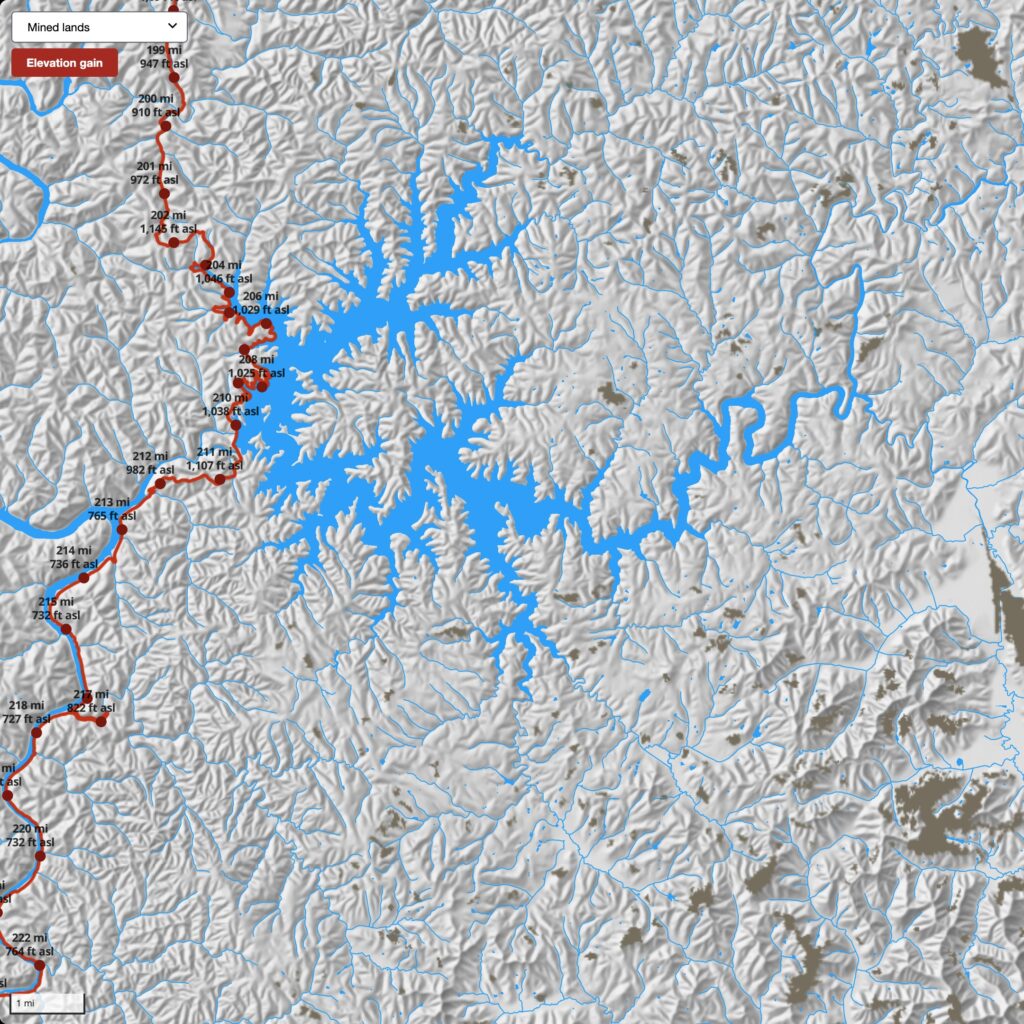
Two new layers have been added to the web map for the Daniel Boone NF and Big South Fork NRRA: the National Land Cover Database (NLCD) for 2021 (mrlc.gov) and mined lands, 1985–2020 (skytruth.org). The NLCD is a 30-meter resolution (each cell is 30×30 meters) land cover dataset showing each cell’s dominant land use.

Screenshot of land cover map at SheltoweeTrace.com
Screenshot of the land cover map at SheltoweeTrace.com

The cells are symbolized to show features significant for the area, such as multiple types of vegetation cover, the density of the built environment, and barren land. Inside the NF and NPS boundaries, barren land is likely to be exposures of bedrock, boulders, and earthen materials. For example, it shows Cumberland Falls. Outside of these boundaries, barren land is likely mines or construction sites.

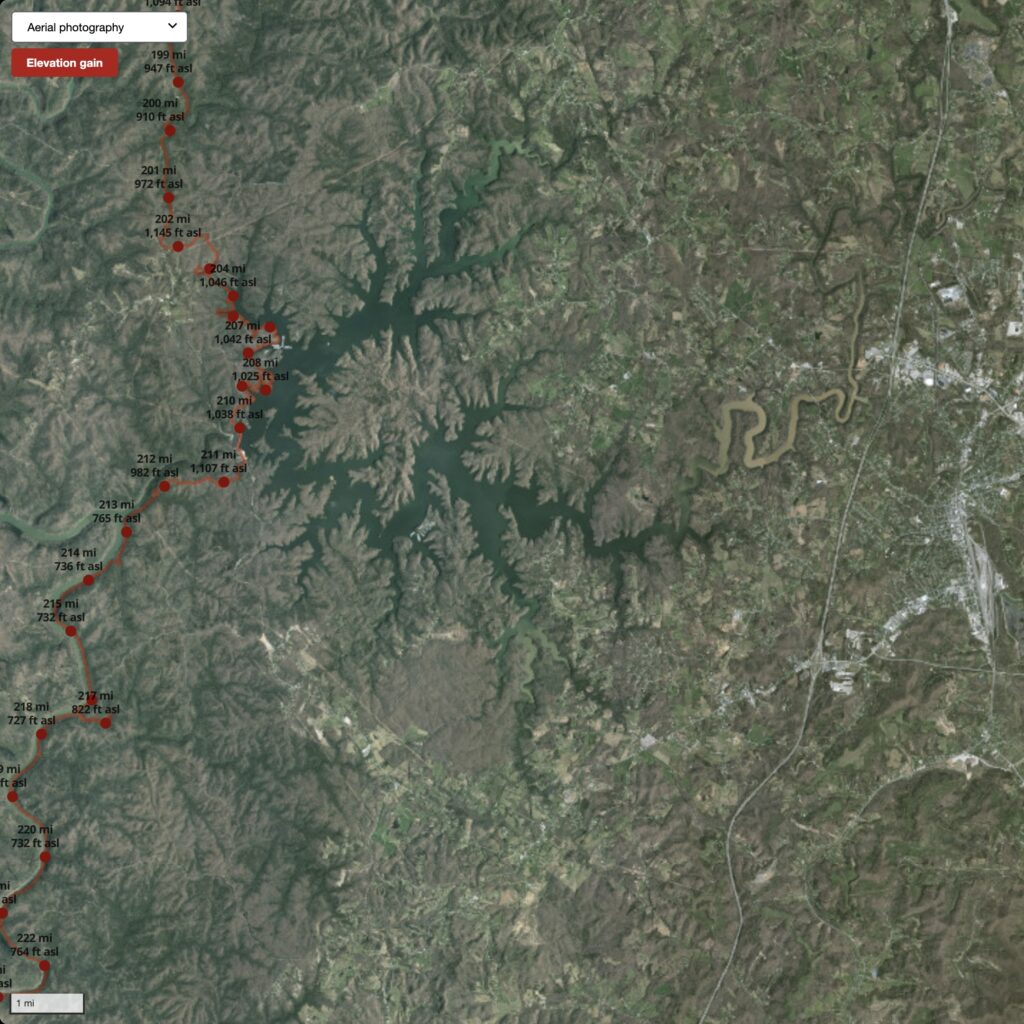
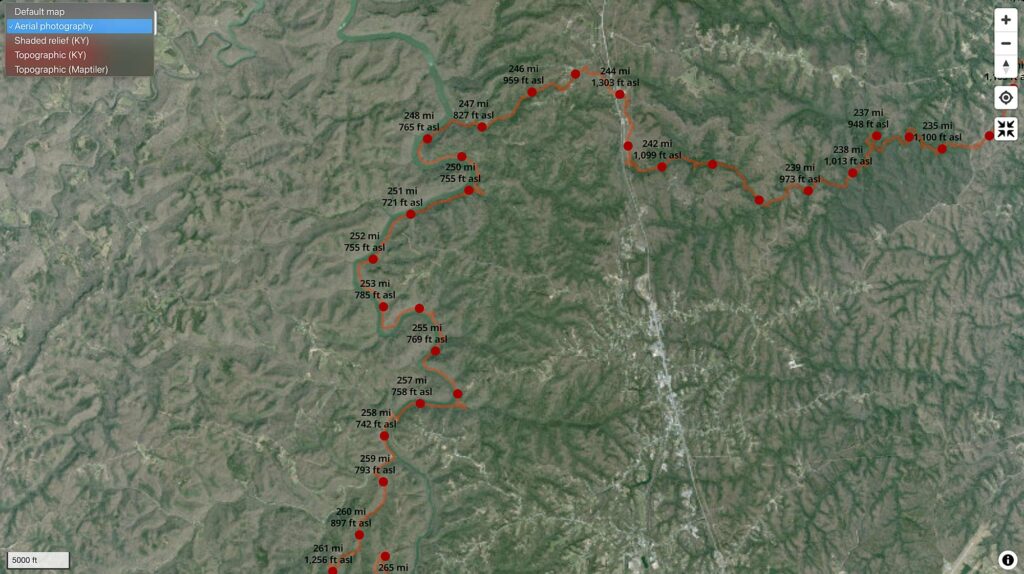
While the layer is low-resolution compared to the aerial photography layer, the NLCD helps us quickly understand landscape conditions that would be tedious to interpret from aerial photography alone.

Screenshot of aerial photography map at SheltoweeTrace.com

One can identify the distribution of basic forest types and habitat patterns. The NLCD can be useful for understanding the extent of the wildland-urban interface — a vital consideration for Trail Towns, maintaining wildlife corridors, and managing tourism development in the region.

The NLCD layer, in conjunction with other layers on the web map, provides a comprehensive view of the public lands in the region. Before your next trip to the Daniel Boone NF or Big South Fork NRRA, take a look at all layers to get a sense of the landscape you will be visiting.

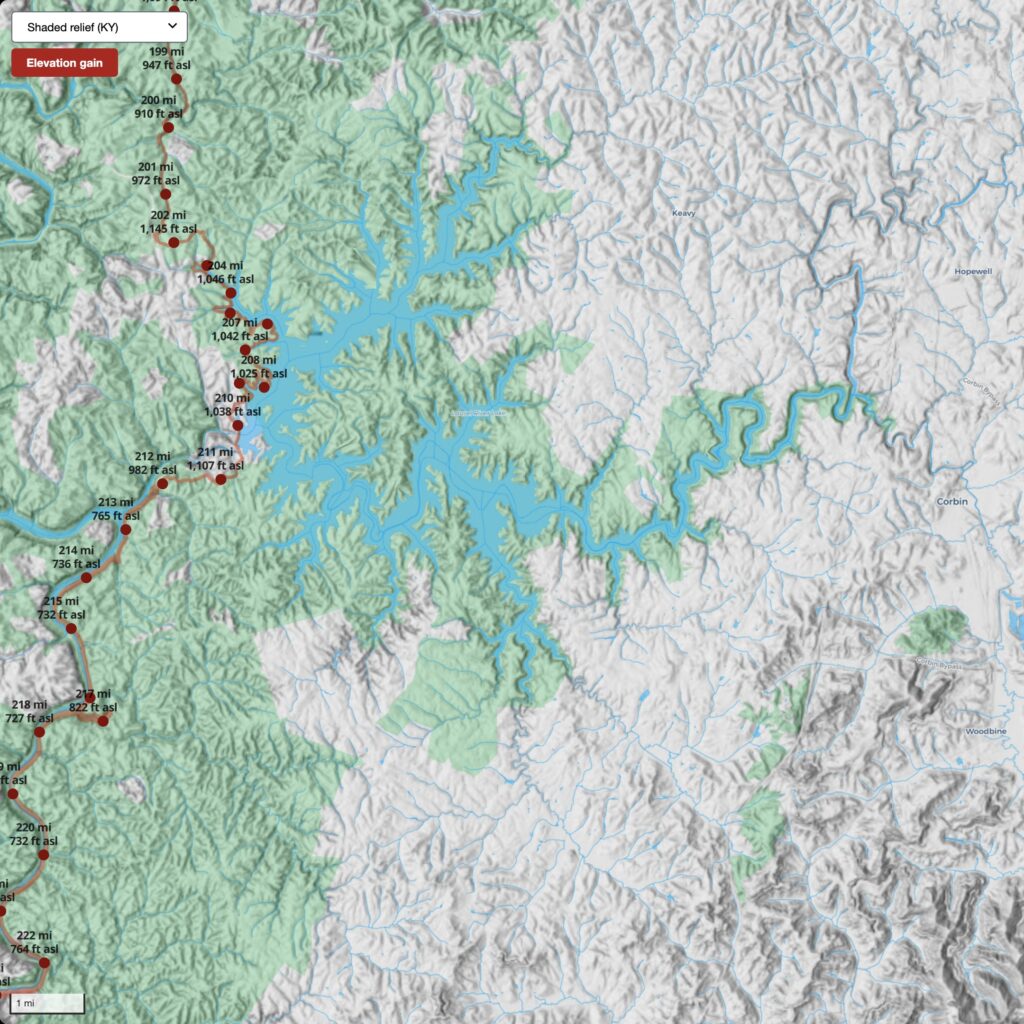
Screenshot of lidar-derived shaded relief map at SheltoweeTrace.com
Screenshot of mined lands map at SheltoweeTrace.com
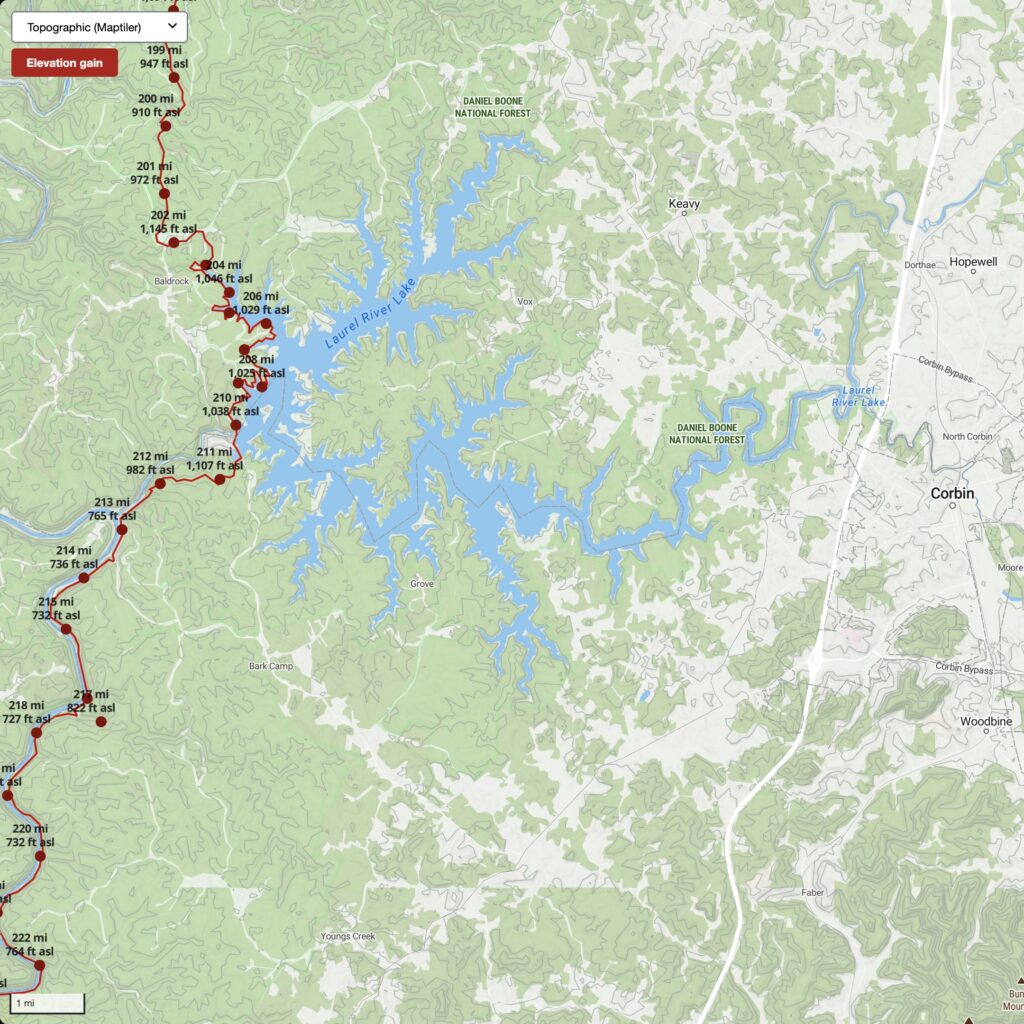
Screenshot of general topographic map at SheltoweeTrace.com
Screenshot of the general topographic map at SheltoweeTrace.com

The interactive map is available at: https://sheltoweetrace.com

Yahoo Falls

Yahoo Falls Picnic Area is located in the Big South Fork National River and Recreation Area in Kentucky. The scenic area contains short hikes and overlooks of the Cumberland River and Yahoo Falls, an impressively tall waterfall. The area is surrounded by the Daniel Boone National Forest with a variety of trails and camping options. You can create a 9-mile loop hike by combining the Yahoo Falls Trail, Sheltowee Trace, and USFS 602 & 612 trails.

Yahoo falls

Backpacking tips. While no camping is allowed in the Picnic Area, Alum Ford primitive campground is about 2 miles south on the Sheltowee Trace. Big South Fork manages the campground and it is $15/night. There is no water or electricity at the campground and cellular service is weak along the Cumberland River. Hit me up for additional tips. Get lost and have a blast.

Rowan County Explorer

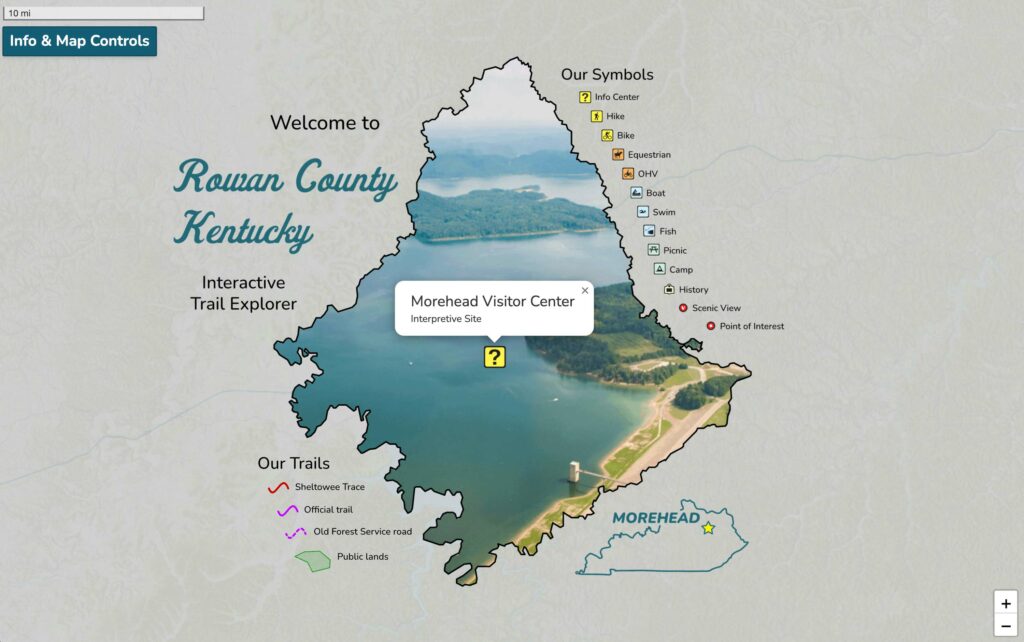
Over the years teaching GIS & mapping, Boyd has tried to connect his students with real-world mapping opportunities. One such opportunity emerged when Rowan County, Kentucky, wanted an interactive map showing trails and tourism destinations in the area. Workshopping with students in GEO 305 (Elements of Cartography) and later MAP 672 (Programming for Web Mapping) in UKy’s Department of Geography, he drafted a web map.

Rowan County, Kentucky, trail and tourism explorer
Trail and tourism explorer for Rowan County, Kentucky: https://outrageGIS.com/rowan

The criteria for this map were that it needed to be completely open source (without relying on any for-fee platforms) and self-contained—the project lives in a folder that could be dropped into any web server and would just work. This project uses LeafletJS and public base maps from Kentucky DGI.

The page departs from the traditional web map; marginalia, typically on a print map, was added to this map. A viewer can zoom into the legend! While the creative choices made on this project offered a fulfilling experience, students have their own trajectories and soon pivot interests after a course is finished.

The project is a draft, but it is active. Tell us what you think: https://outrageGIS.com/rowan

New base maps for Sheltowee Trace

Find high-resolution aerial imagery and shaded relief maps for Kentucky (and some for Tennessee) on SheltoweeTrace.com.

Base maps for sheltoweetrace.com

We’re adding new base maps for our Sheltowee Trace map. The current maps are:

  • Default map shows a generalized shaded relief, hydrologic features, and public land.
  • Aerial photography shows 2-ft pixel resolution, leaf-off 2019 imagery.
  • Shaded relief (KY) uses KyFromAbove point clouds from 2010s to create a shaded relief detailed enough to show trail and road beds.
  • Topographic (KY) shows the Topographic map series created by the Kentucky Division of Geographic Information.
  • Topographic (Maptiler) displays a modifed Maptiler Outdoors base map. It is a global base map pulled a variety of open-source data. Trail and other information portrayed on this base map is not maintained by outrageGIS mapping. Also, elevation contours can show errors around 100 feet.

Cumulative elevation gain calculator

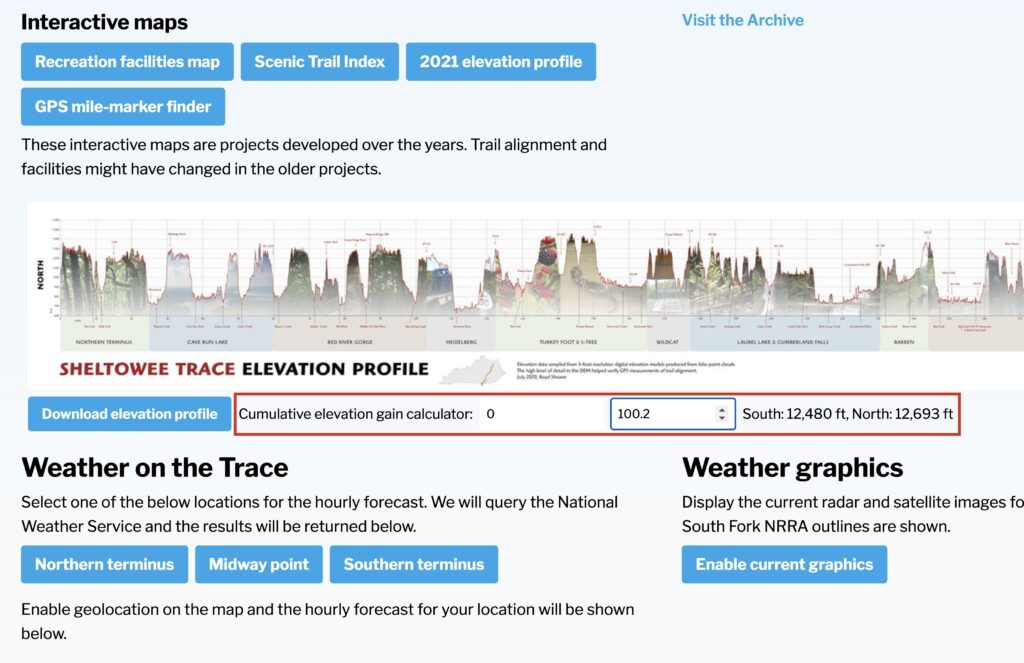
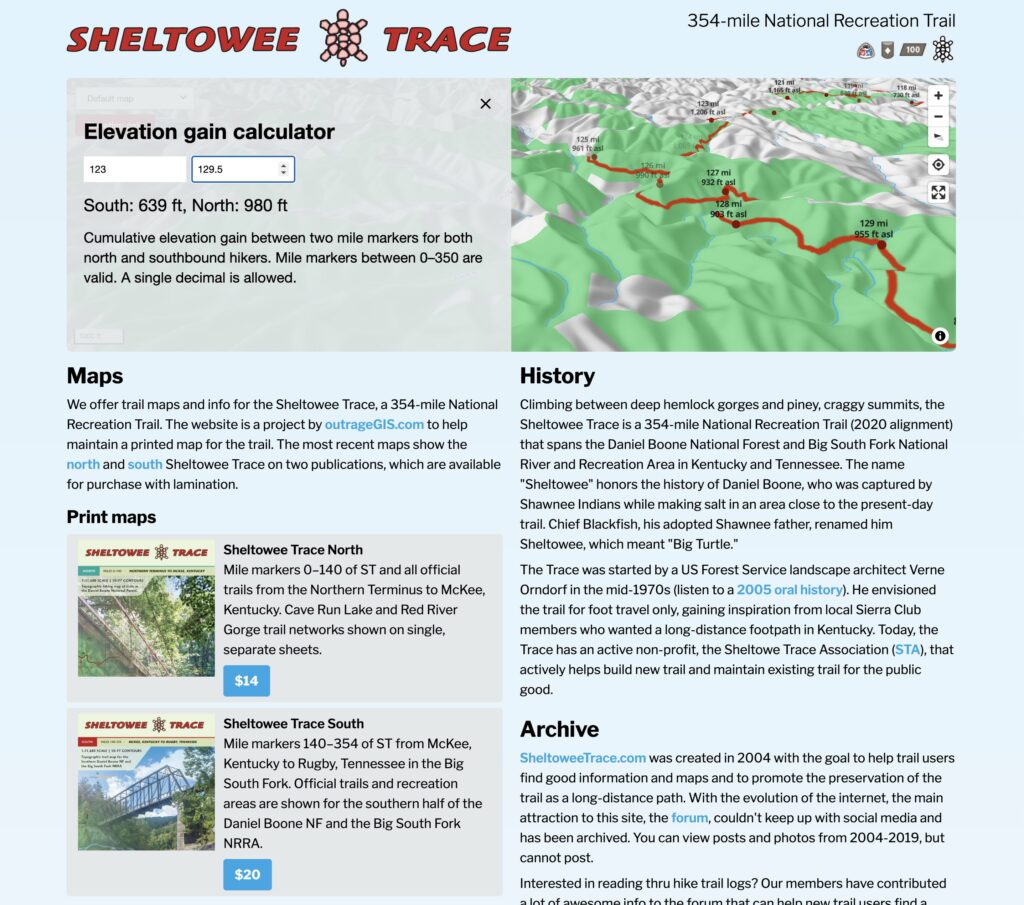
How much elevation gain did you have on your last Sheltowee Trace hike? We built a calculator and elevation profile on SheltoweeTrace.com.

Cumulative elevation gain calculator on sheltoweetrace.com

The data used in the calculator is pulled from lidar point cloud elevations created in the mid-2010s. Digital elevation models (DEM) derived from these point clouds have a 5-ft spatial resolution and are detailed enough to show wider trails in shaded relief rendering of the DEM. The point elevations for the Sheltowee Trace are sampled every 1/10th of a mile and allow for calculating gains between mile markers with a single decimal place. The result shows both southbound and northbound gains.

Welcome to summer

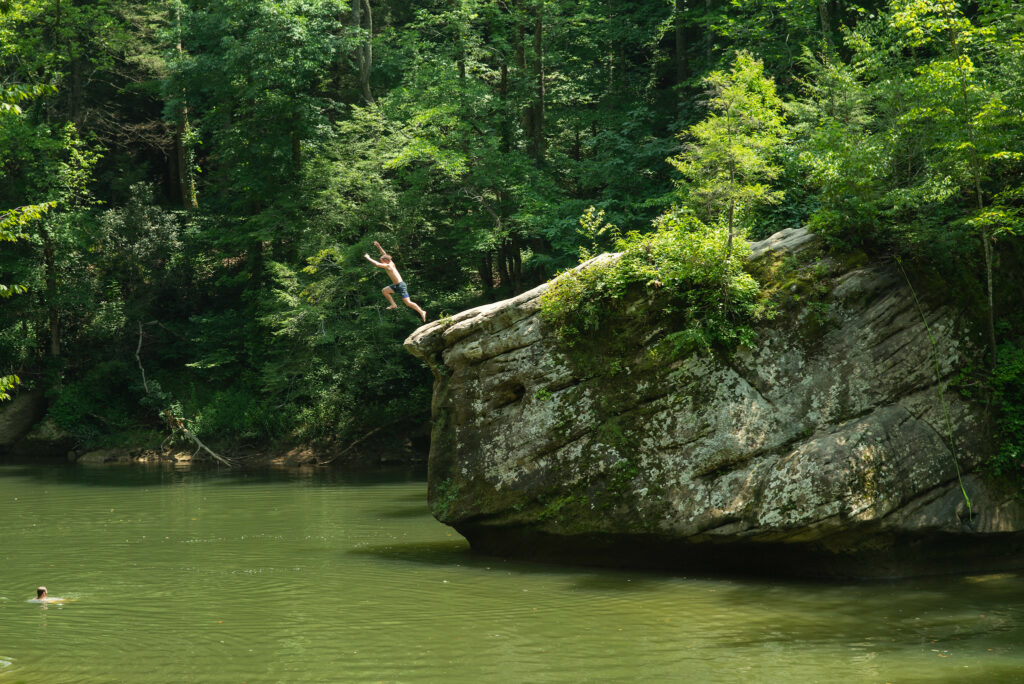
Can you guess where this popular site is located? Find this location on our Red River Gorge Backpacking Map & Sheltowee Trace North Trail Map hiking maps.

Jump Rock, ST mile marker 78.5
Jump Rock, Sheltowee Trace mile marker 78.5

Updated SheltoweeTrace.com

We love hiking the Sheltowee Trace. Often, we want to know how much vertical elevation gain we have accumulated over a longer hike. To this end, we’ve added a cumulative elevation gain calculator to sheltoweetrace.com. Give it a try and tell us what you think.

Sheltowee Trace web page and map

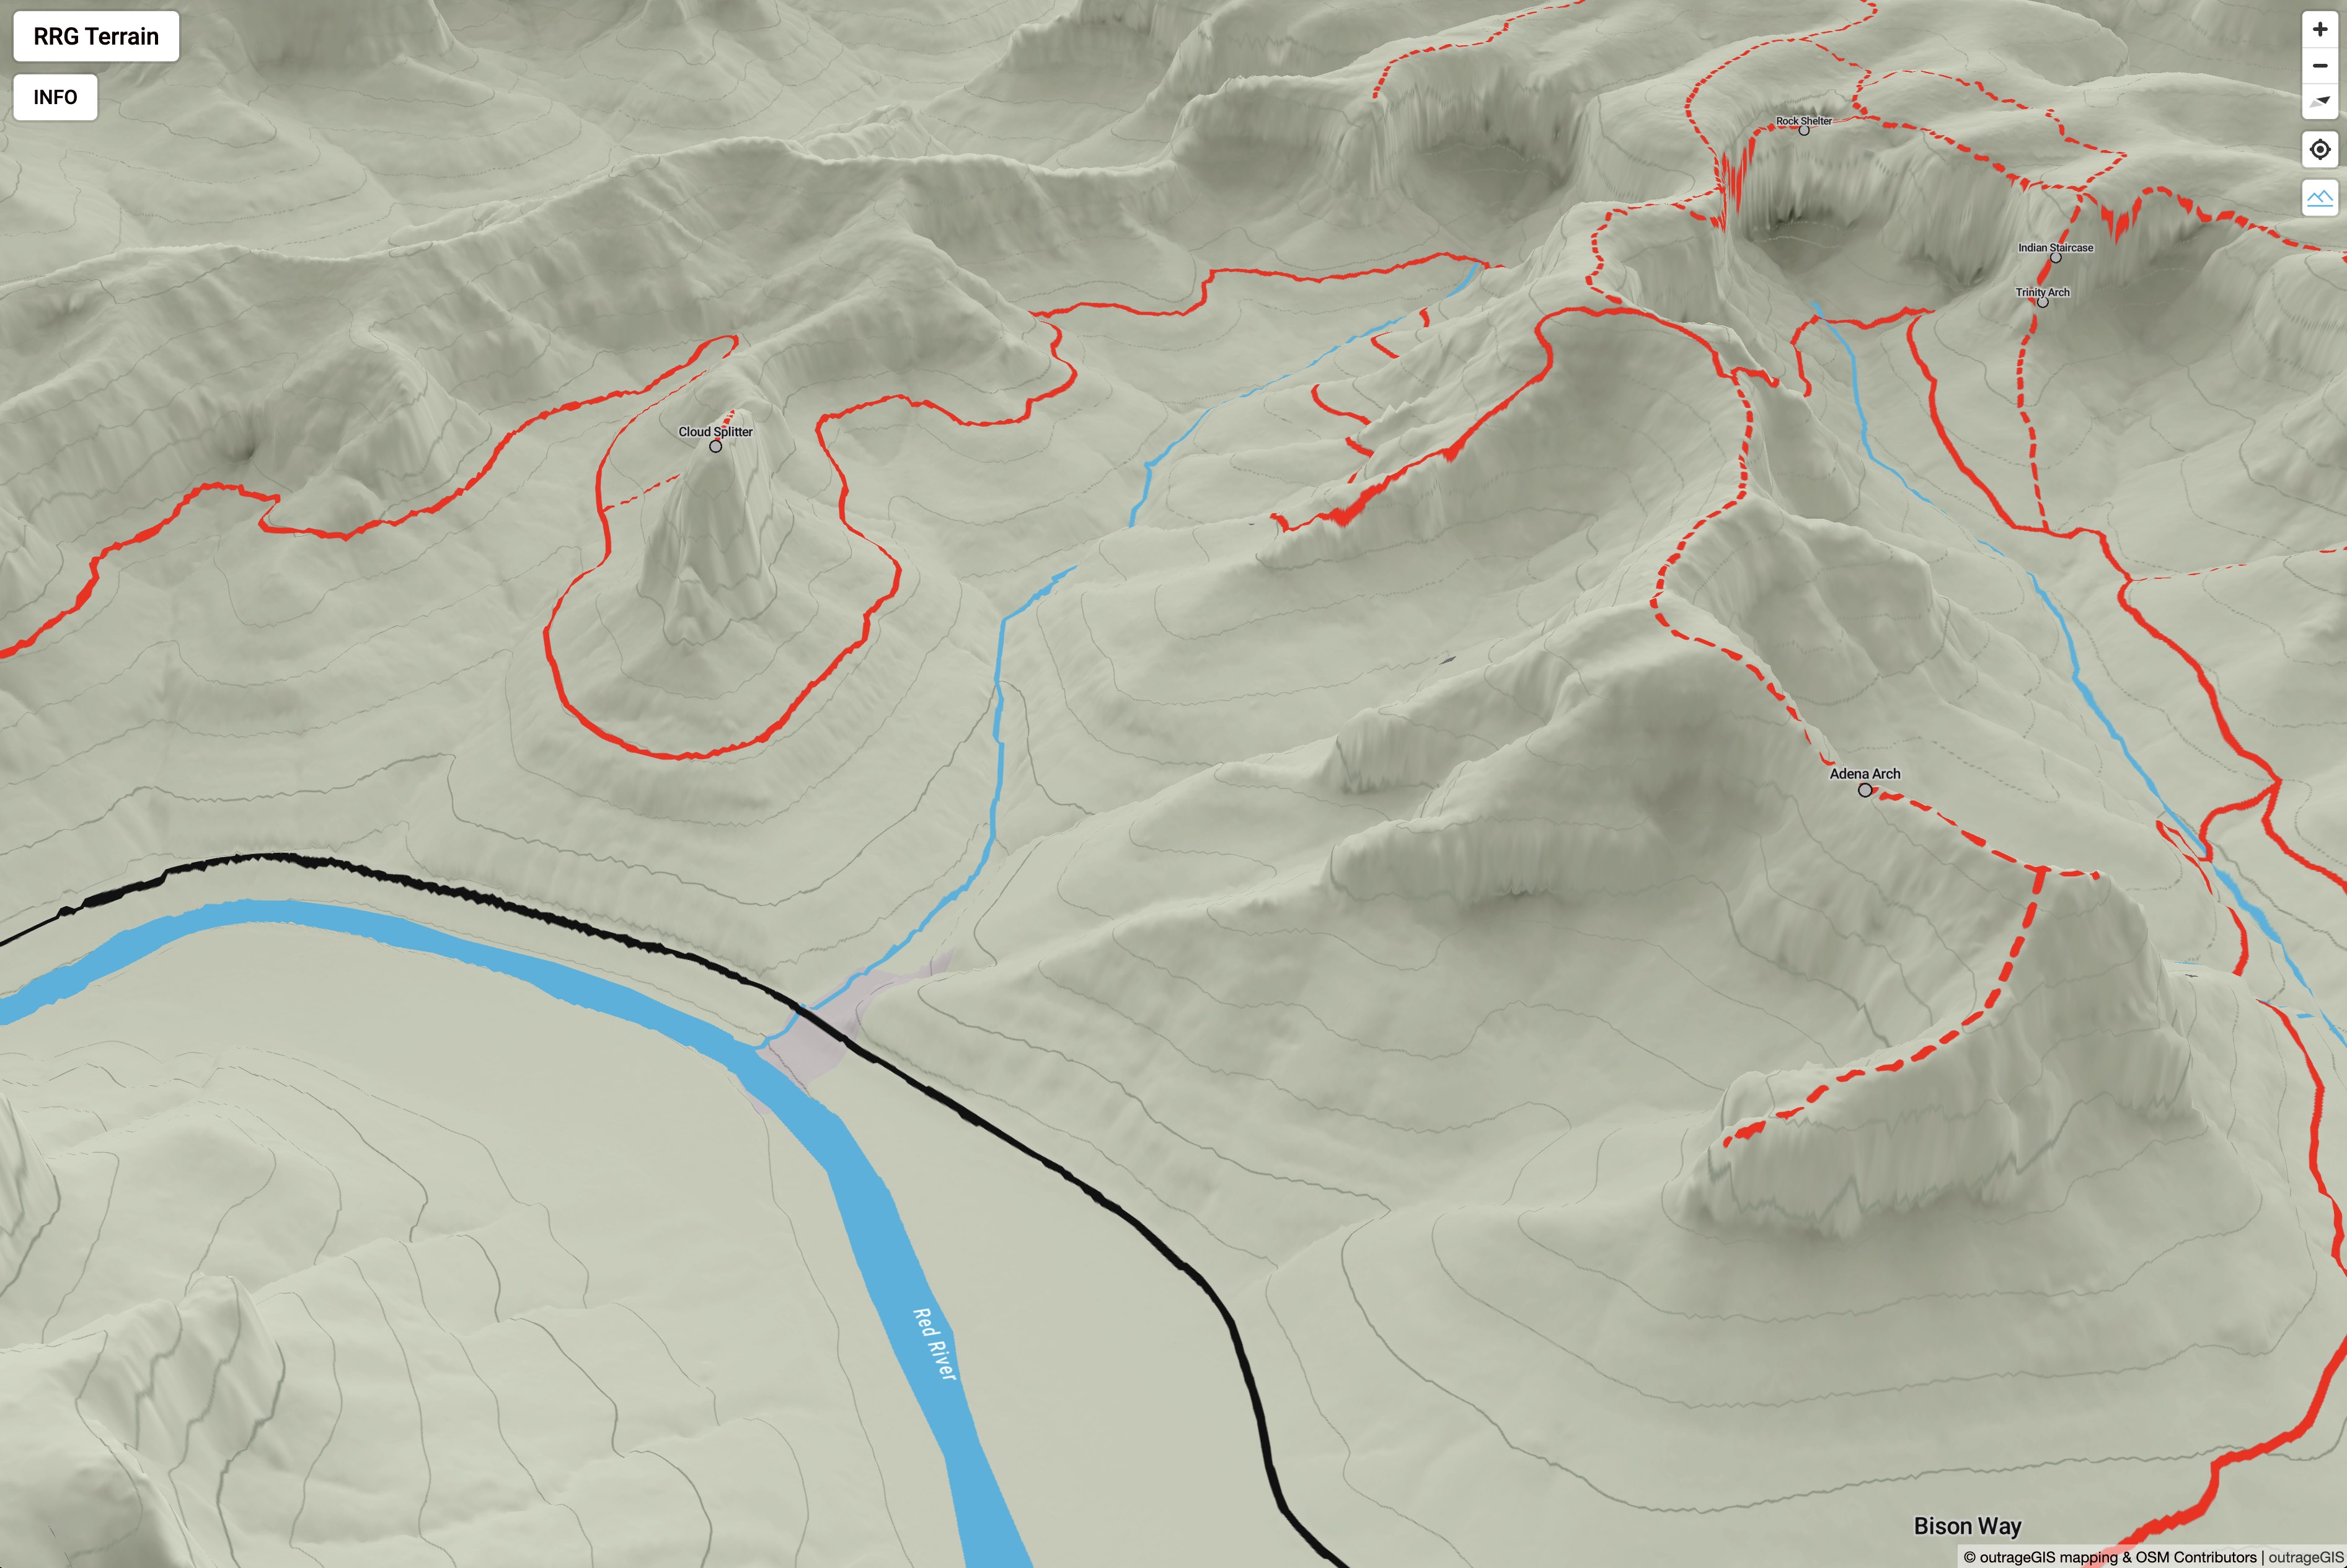
RRG 3D terrain map

Interactive web maps have come a long way over the years. First we had slippy maps using raster tilesets – they’ve been around for about twenty years and are incredibly durable. However, once the tileset is rendered, it’s not easy to change the look of the raster image. You will need to render a new tileset and replace the old. Because a tileset can contain millions of images, it’s not a quick replacement.

Gaming technology evolved in the browser and brought us WebGL and vector tilesets. These tileset features have attributes and are rendered programatically in the browser. It’s rather easy to change the appearance of a feature and Mapbox built a browser application, Studio, to create endless styles of maps using vector features. What’s not easy is serving a vector tileset to a client until recently. Libraries like PMTiles bundle a vector tileset into a single file that expose the necessary to the client browser.

More recently, elevation (terrain) tilesets have made 3D maps more exciting to create and explore. Once an elevation is loaded, all other layers, tilesets, etc. are draped over elevation surface. Depending on the resolution of the elevation data, this surface can dramatically change the appearance of the map.

Using an open source mapping library like MapLibre GL JS, a browser can simultaneous consume raster, vector, and terrain tilesets to make a 3D map for any place you have data. Kentucky has excellent data availabilty including lidar data to make high-resolution elevation surfaces. This map uses that lidar data to create the terrain tileset and a shaded relief raster tileset. The vector tilesets for trails, roads, etc. are derived exclusively from OpenStreetMap. The water layers are from the USGS National Hydrological Dataset.

Below is a screen capture of the web page and a link. You might notice that it doesn’t have all of the trails that our printed maps show. We may add those trails in the future, because it would helpful for planning your trip. And, we’re not planning to move to an exclusive mobile app. With all of the advances in mobile technology, we think paper maps are still essential for learning basic navigation and map reading.

Screen Capture of map

The map can be loaded here: outrageGIS.com/gorge/map

Happy adventures!

A simple GPS tool for the phone

If you visit this site often, you likely have a favorite map app on your phone. I certainly do and I have installed dozens of apps over the years. Most focus on placing your location as a dot on the map.

The dot

Any map app that shows your location as a dot on the map fosters a dependence on your exact location. We end up saying, "I am here" instead of asking "Where am I?"

To build strong spatial awareness, we should look at the dot after studying the plain map and doing an exercise in terrain association. Can we orient the map (best done with a paper map, folks) so that map north aligns with observed north? Can we then identify features on the map and estimate their distance from us?

These are questions in topograhic map reading. If you carefully observe your environment and compare its representation on the map, you will not need the dot.

When there was no dot

Let’s say the early 1990s. Before that time, we used paper maps. Soon after, handheld GPS units became popular and only showed coordinates for your position and maybe some other location statistics like speed, elevation, distance & bearing to next waypoint. They were often used with a paper map that had a grid (with linear units on a flat space) or a graticule (angular units on a curved space) that helped a user measure their location.

Using coordinates, we looked at the paper map’s margin for marks that pointed you to a general location. To find the exact location, we looked up and asked, "Where am I?" and compared the map with what we saw. We built a mental map of our surroundings. There was no dot.

An app without a dot?

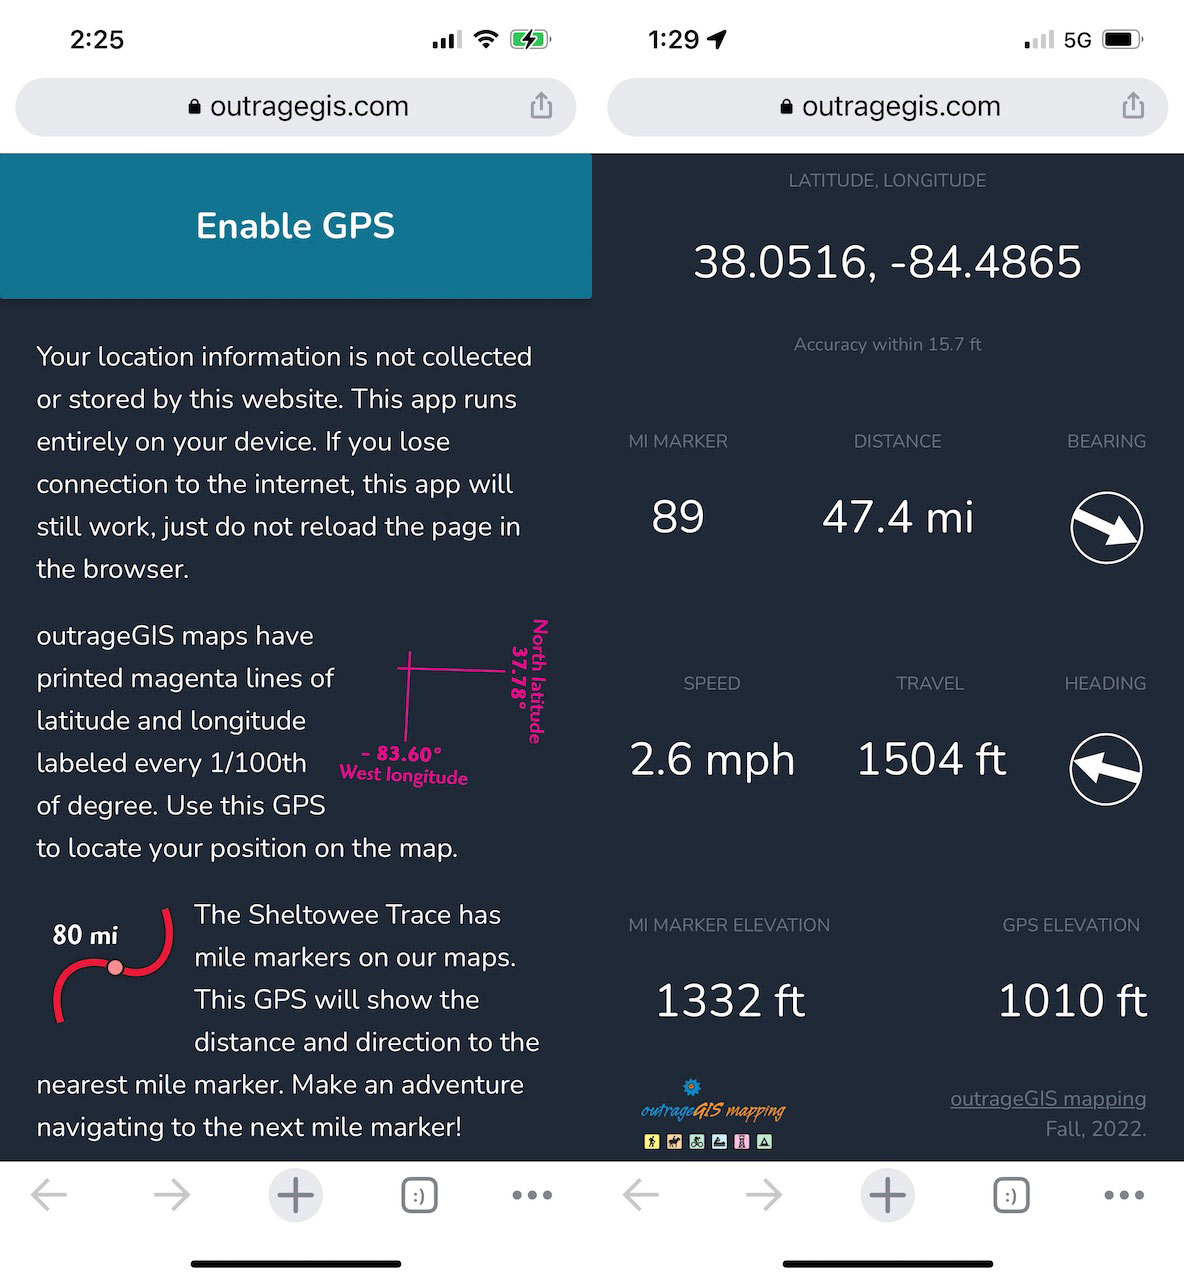
So, we thought we would kick it back to the 90s and make a browser app that mimics these early devices. Because our maps have detailed graticules and mile markers for the Sheltowee Trace, this app should compliment your journey into topography and map reading. This app is designed for mobile devices and below is a screen capture of a use on an iPhone.

Screen Capture of control panel

GPS app can be loaded here: https://outrageGIS.com/gps

This app is free, open source, doesn’t need to be installed, and won’t collect any information from you.

Happy adventures!

Sheltowee Trace elevation profile

Working on the 2020 update of the Sheltowee Trace maps using high-resolution DEMs derived from lidar point clouds. An elevation profile was created by sampling elevation every 264 feet along the 343-mile trail. This profile shows the proposed extension from Burnt Mill bridge to Rugby.

Enlarge

The resolution is high enough to see the indentation of wider trail beds, which helps verify GPS data.

Trail bed observed new Gray’s Arch recreation area

The updated trail maps should be at the printer by mid-July.

Woodland Art Fair time!

Come down to the Kentucky Art Market and Woodland Art Fair this Saturday and Sunday,  August 17 and 18, 2019. We have new t-shirts of the Red River Gorge.

The fair runs from 10 a.m. to 5 p.m., or thereabouts.

Our booth location and coordinates are shown on the below map. We’ll be between Troublesome and Difficulty Creeks, at least spirit! Find us on the Woodland Christian Church side of the fair at the shady bottom of the hill.

Toward a scenic trail index

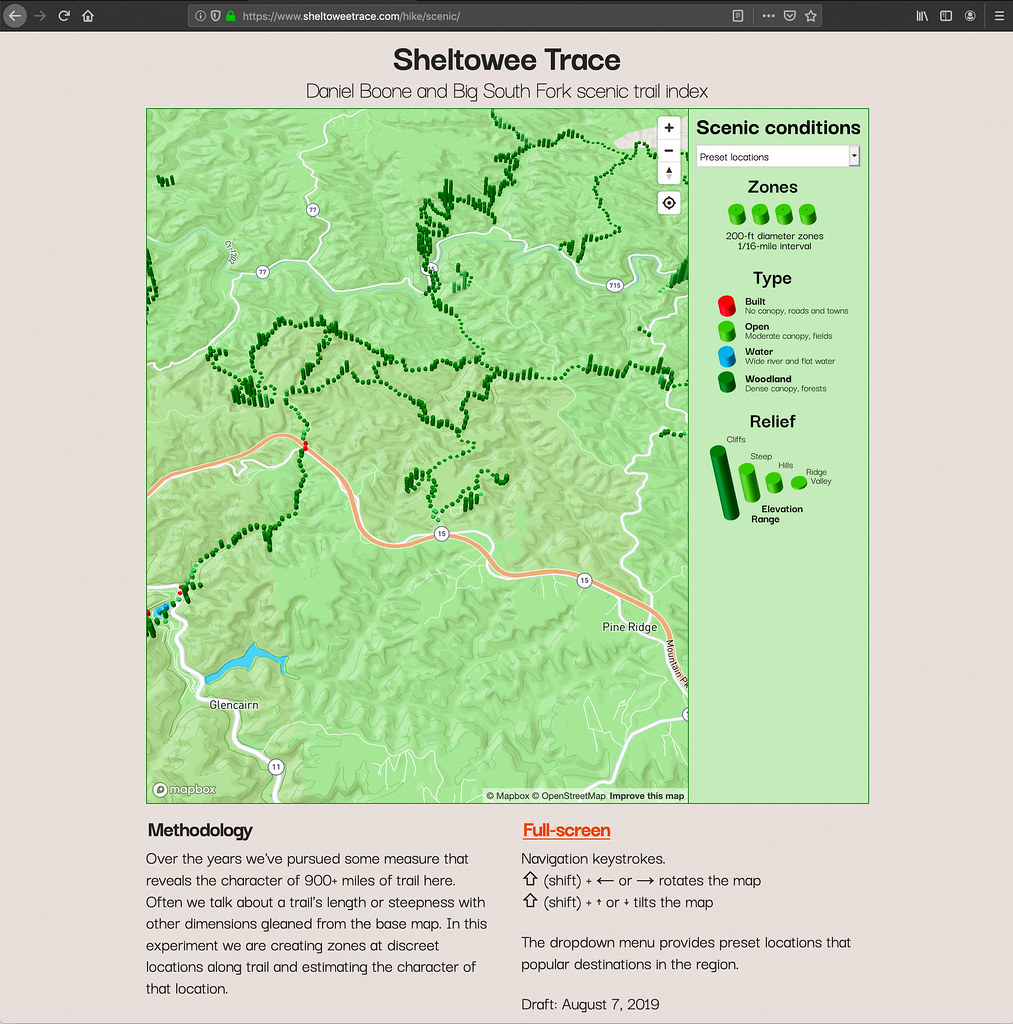
Sheltowee Trace, Daniel Boone National Forest, and Big South Fork scenic trail index
Visit the web page

Over the years we’ve pursued some measure that reveals the character of 900+ miles of trail here. Often we talk about a trail’s length or steepness with other dimensions gleaned from the base map. In this experiment, we are creating zones at discreet locations along trails and estimating the character of that location.

Over 14,000 polygons are shown on this 3D Mapbox map. The color indicates the type of scenery and height shows how much relief is the area. Future additions to this map include adding a searching tool and summary statistics for each trail.

Red River Gorge t-shirt

T-shirt front

Looking for a new fashion statement?

We’ve printed a map of the Red River Gorge on a 100%-cotton, heavy-weight t-shirt.

This double-sided t-shirt will be first available at the Kentucky Art Market, which is adjacent to the Woodland Arts Fair. This August 2019.

T-shirt back

Courthouse Rock animation

Journey to Courthouse Rock in lidar point cloud

Bird’s-eye view of Cumberland Falls

Rendered in a lidar point cloud
0

Your Cart