Have you ever needed to create a quick GPS track, plot a few points on a map, and generate shareable spatial data on the fly in the field? This browser app utilizes your browser’s local storage to save GeoJSON features as you create them interactively, using your mobile device’s GPS or manually placing points. Your data is kept on your device and is never shared until you decide to export a GeoJSON file. The base maps in this app use KyFromAbove’s latest high-resolution aerial imagery and elevation data.
Start GPS mapping through this website:
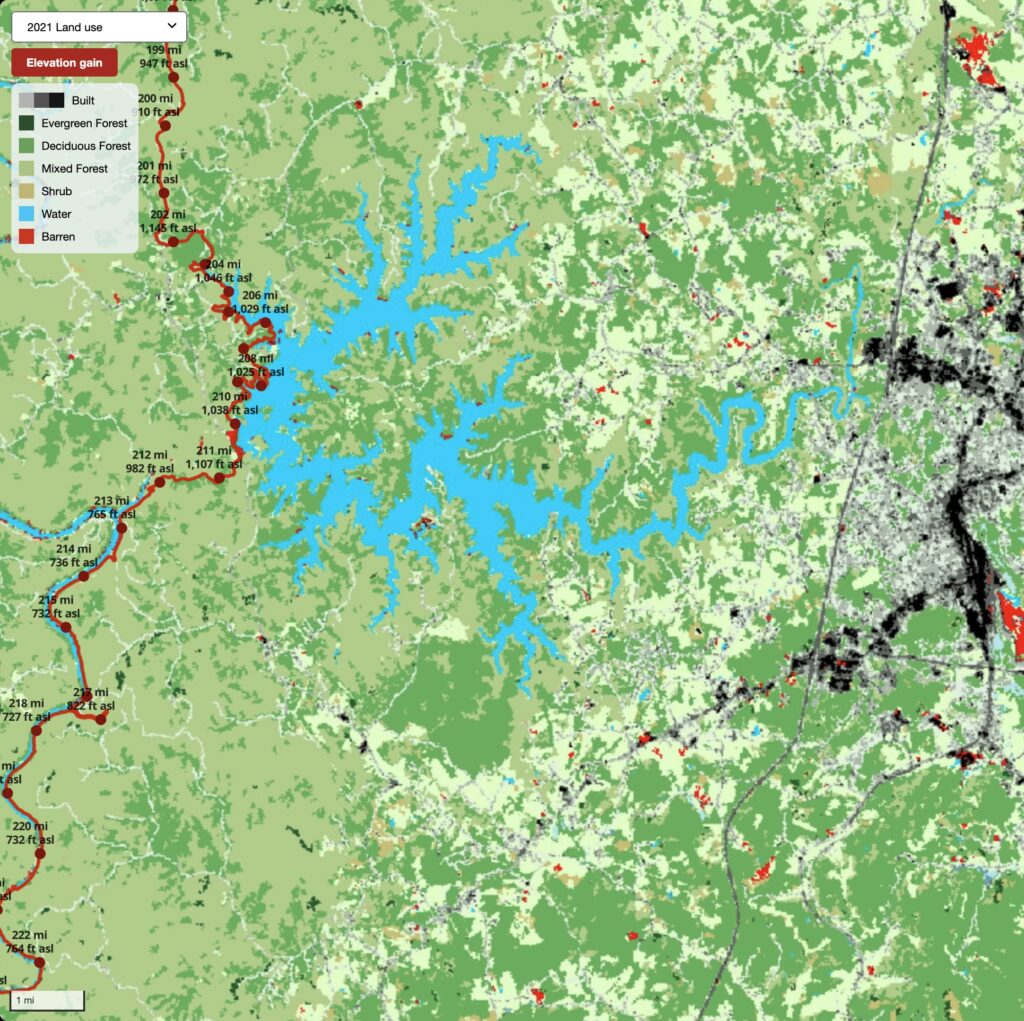
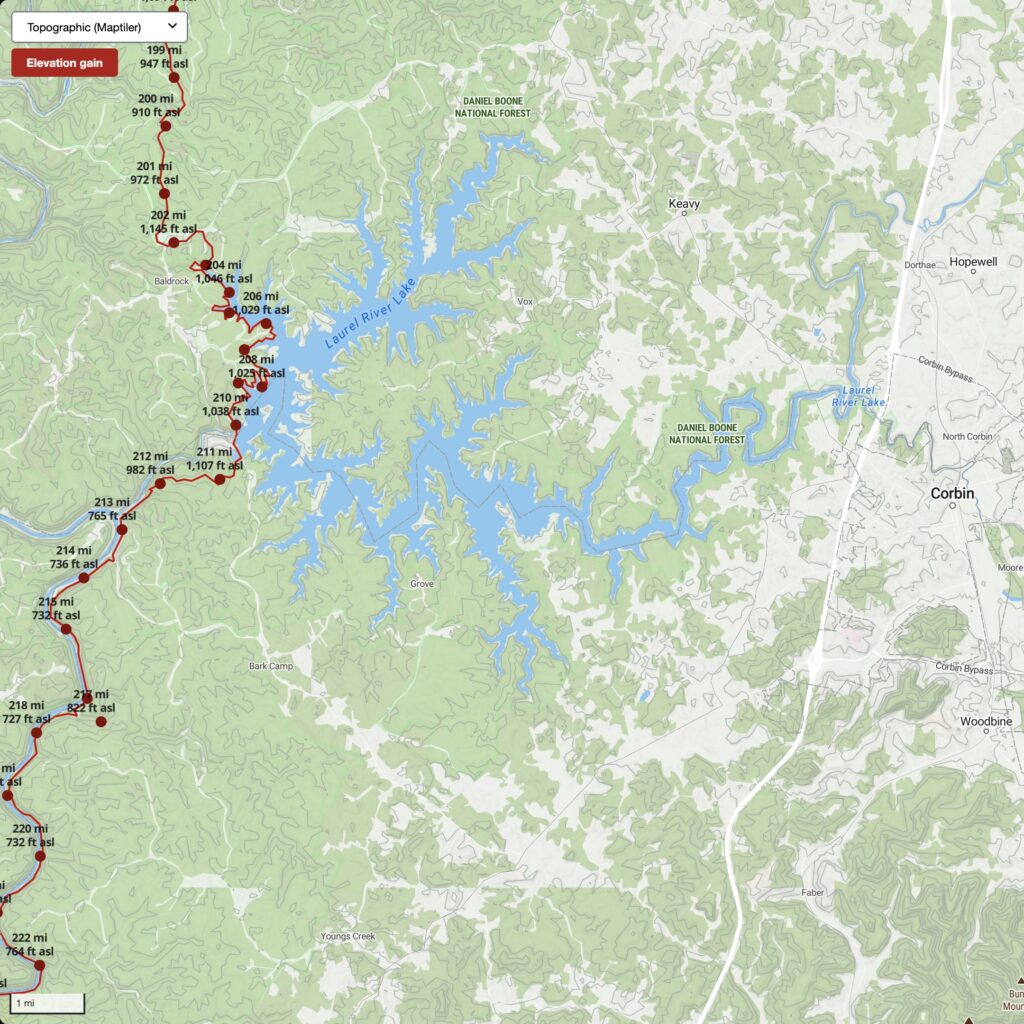
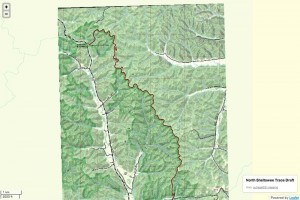
 Viewer interface
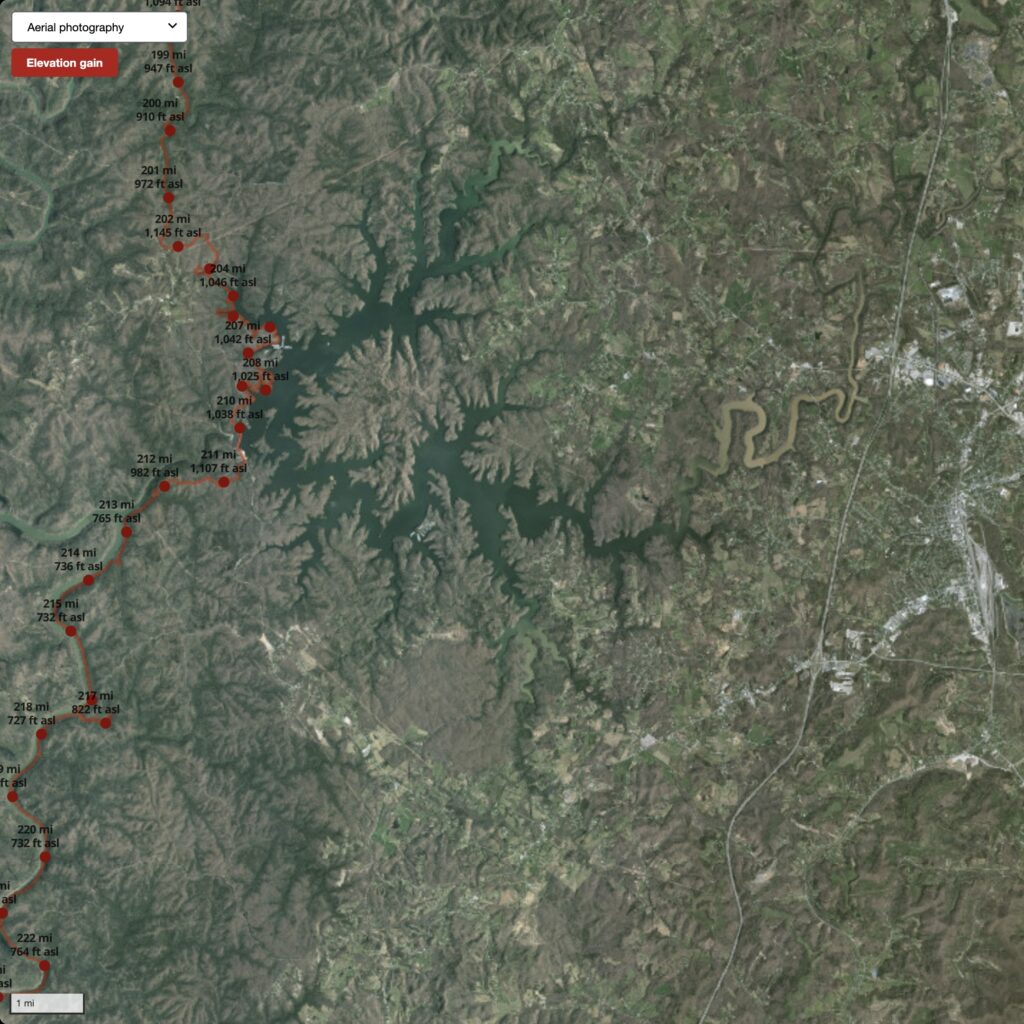
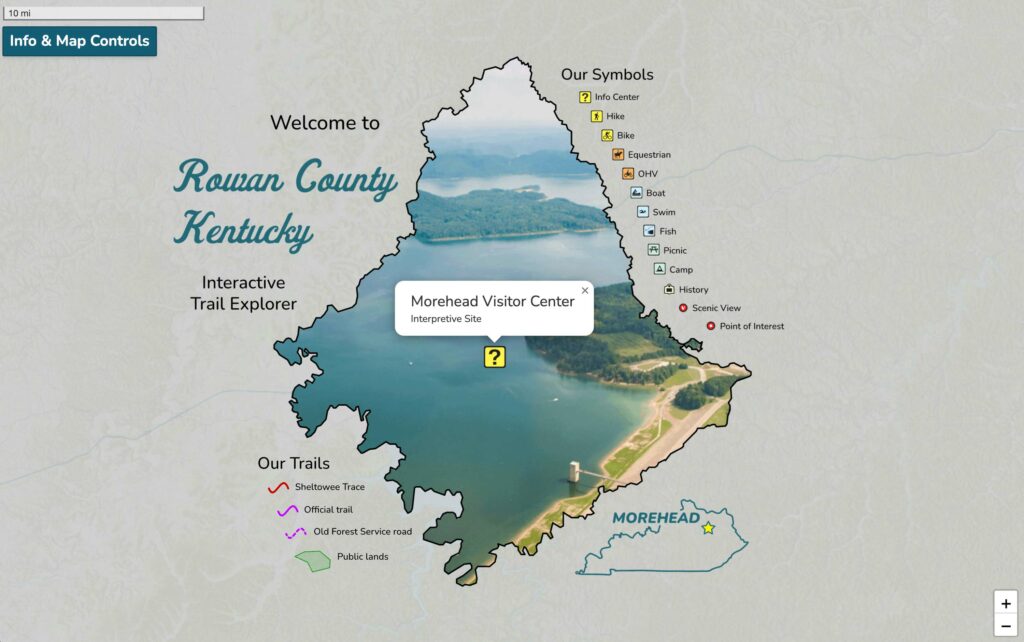
 Viewer interface
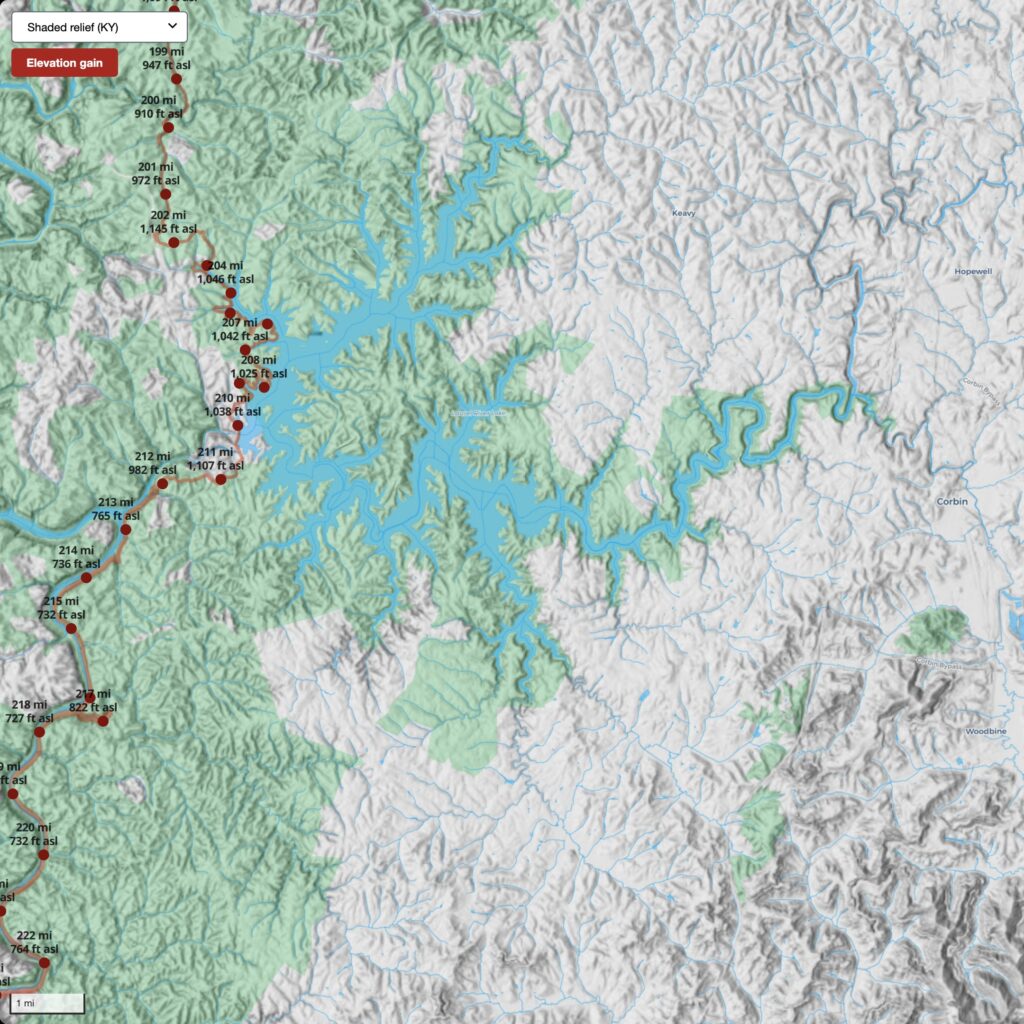
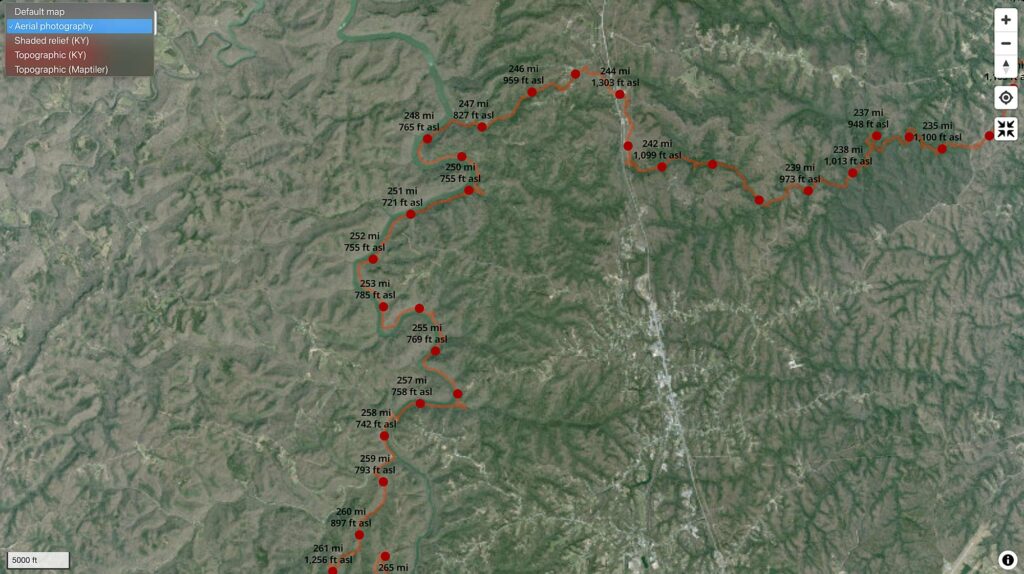
 Viewer interface
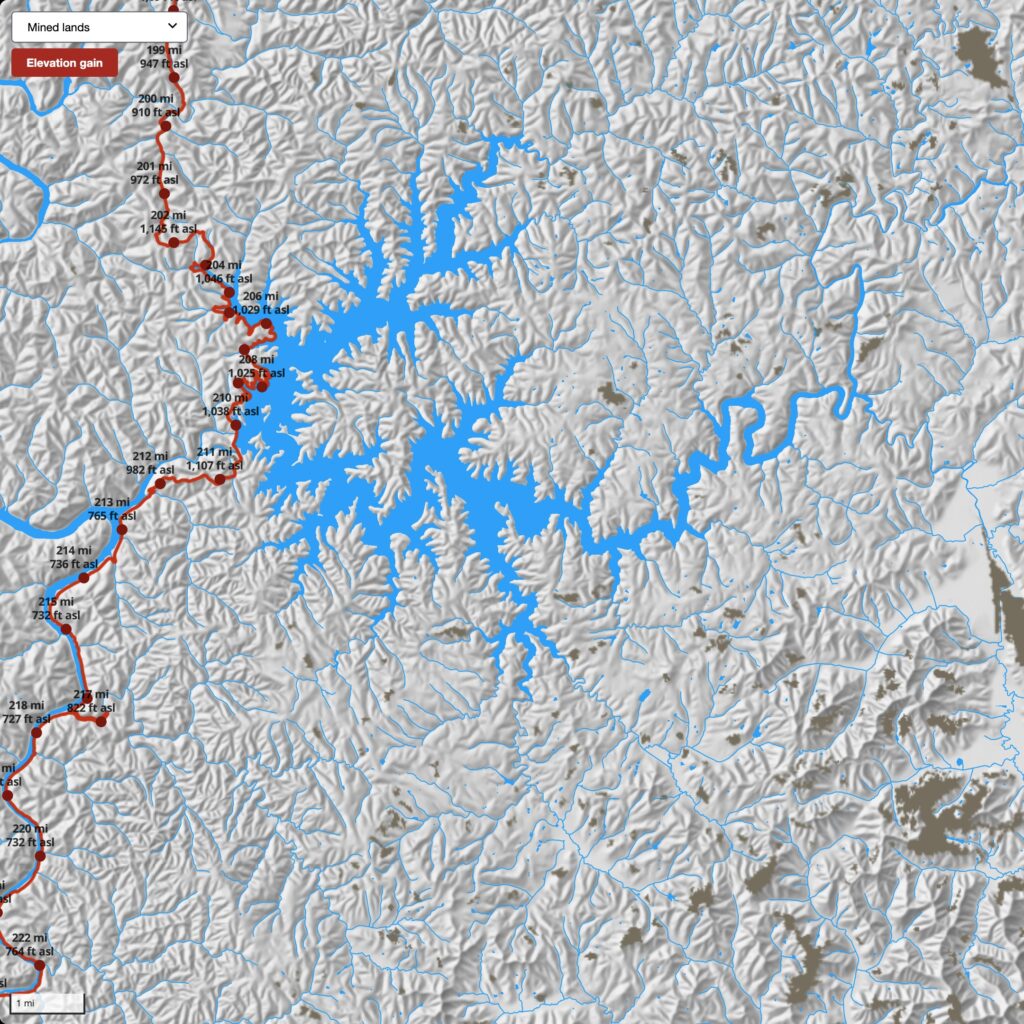
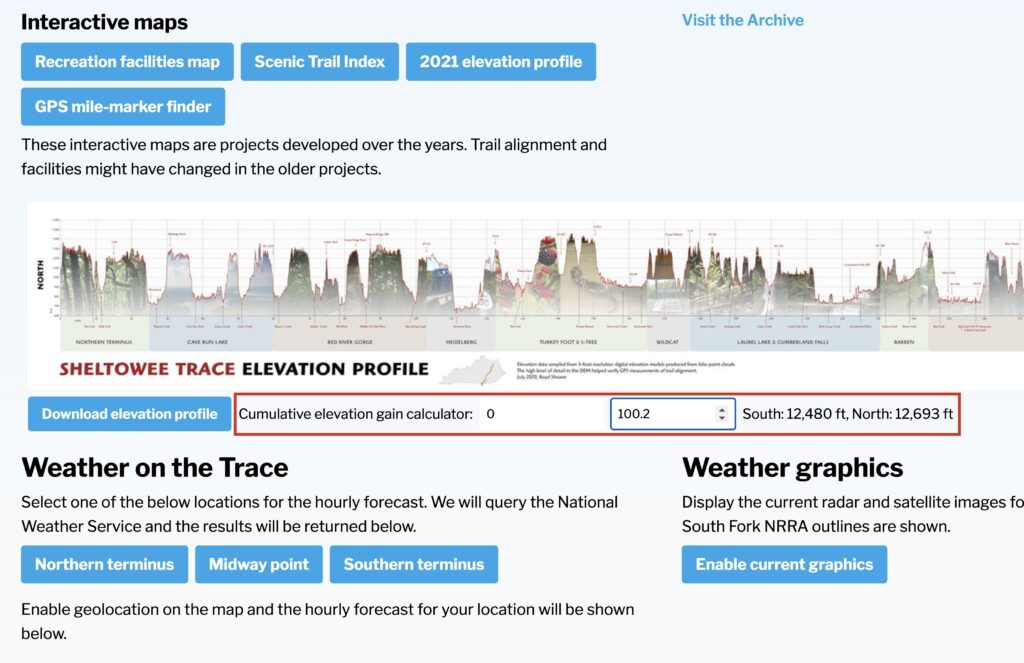


You must be logged in to post a comment.