

London Ferrell Community Garden
Locations of Lexington’s community gardens. Gardens maintained by Seedleaf: Nourishing communities by growing, cooking, sharing, and recycling food.
London Ferrell Community Garden
Locations of Lexington’s community gardens. Gardens maintained by Seedleaf: Nourishing communities by growing, cooking, sharing, and recycling food.
As a lover of the atmosphere and sun, I want to see how light and sky change over the course of the day. I also want to see how large-area weather events, such as the passage of a front, impact different places in the Great Smoky mountains. The inspiration behind this page was a desire to record weather changes at different elevations on a mountain and to help the photographer in me better understand a secretive and dynamic landscape.
Enter Yesterday: a site of prior-day animations of federal web cams and satellite imagery located here at http://www.outragegis.com/weather/img/animation/yesterday. Note this page always shows conditions for the prior day since they are full-day timelines.
The Great Smokies have about one mile of vertical relief and weather conditions can be dramatically different depending on your elevation. Whatever it’s a line of thunderstorms or fog in the valleys on a calm morning, this is a visual record of evolving conditions…only of course it happens during daylight. For the weather nut who likes to take it a step further, the page gives data from park’s 5 weather stations for the same day….and it’s all archived.
How was it done? After tinkering with ImageMagick and FFmpeg, I made a script that creates full-day animations of the webcams in the Great Smokies and visible satellite images from NOAA. What will it become? Consider it a visual archive of the atmosphere and movements of the Sun in the Great Smokies. Any suggestions are welcome.
Some notes for updates: I haven’t fully utilized the flash embedded video (see the two samples below, top is animated gif and below is embedded flash video). The problem is setting animations in sync together, e.g., sun rises at the same time in all movies. With an animated .gif, I think you simply need to refresh your browser after all of the images are loaded to get a partial sync. A better solution is out there. I can also increase the sampling rate for smoother play; now it’s two samples an hour.

Weather map and webcam animation for the Great Smokies
[flv:http://www.outragegis.com/weather/img/animation/090603/PurchaseKnob.flv 400 290]
These are also archived, so if you go to the smokies for a backcountry trip, you’ll be able to find your days here.

 So the month of May is nearly done and with it, ends the month-long celebration of the bike and human-powered travel. As a hiker, I often worry about my environmental impact during a drive to a favorite trailhead.
How can I minimize fuel consumption and make better? I reason that if I bike as my primary form of transportation, I will only need to drive during my trips to the woods. This works great if I have a network of safe and continuous bike lanes and trails in the city. Enter Bike Lexington.
I’m proud to say that I contributed a small share to bike community here. I took the artwork designed by Cricket Press (shown by the poster design left) and made the Bike Lexington interactive calendar (shown here), which hopefully encourages people to bike more. Building the site definitely exposed me to vibrant groups and events that helped me stay committed to biking in Lexington.
After this month is over though, biking doesn’t stop. Check out the website for new events throughout the year or join the newsletter subscription to stay updated.

Spring is typically a wet month. However over the past week, Eastern Kentucky has experienced unusual rainfall amounts. The record for the month is 10.78 inches in 2004; and no other year has been above 10 inches for May. The only year that saw over 9 inches of rainfall for May was in 1995. May during 1983 and 1984 were the only times over 7 inches of rainfall.
From the National Weather Service in Jackson, Kentucky:
"2 TO 5 INCHES OF RAIN HAS FALLEN ACROSS EASTERN KENTUCKY DURING THE
MONTH OF MAY. THIS IS OF INTEREST...SINCE WE ARE ONLY ABOUT ONE
QUARTER OF THE WAY THROUGH THE MONTH. HEAVY RAINFALL IS VERY
POSSIBLE AS WE HEAD INTO MOTHERS DAY WEEKEND AND COULD PUSH RAINFALL
AMOUNTS UP ANOTHER INCH OR TWO.

THE AVERAGE PRECIPITATION FOR THE MONTH OF MAY AT THE JACKSON
WEATHER OFFICE IS 4.92 INCHES. WE HAVE ALL READY RECORDED 4.12
INCHES OF RAINFALL AS OF THIS MORNING AT 7AM. IT IS TOO EARLY TO TELL
...BUT WE ARE CERTAINLY ON TRACK TO HAVE ONE OF THE RAINIEST MAYS
EVER. THE RAINIEST MAY OCCURRED IN 2004 WHEN THE JACKSON WEATHER
OFFICE RECORDED 10.78 INCHES FOR THE MONTH. THIS WAS THE ONLY MONTH
OF MAY THAT OVER TEN INCHES OF RAIN FELL. MAY OF 1995 HAD 9.91
INCHES AND WAS THE ONLY MONTH WITH OVER 9 INCHES RECORDED. THE NEXT
HIGHEST TOTALS WERE OVER 7 INCHES AND THAT OCCURRED IN ONLY TWO
YEARS...1983 AND 1984.

HERE ARE RAINFALL TOTALS FROM EASTERN KENTUCKY COOPERATIVE WEATHER
STATIONS AND AUTOMATED SURFACE OBSERVING SYSTEMS AS OF 7 AM
EDT...FOR THE MONTH OF MAY 2009.
LOCATIONÂ Â Â Â Â Â Â Â /Â Â COUNTYÂ Â Â Â /Â Â Â Â PRECIPITATION
BARBOURVILLEÂ Â Â Â Â Â Â Â KNOXÂ Â Â Â Â Â Â Â Â Â Â Â Â 4.38Â INCHES BAXTERÂ Â Â Â Â Â Â Â Â Â Â Â Â Â HARLANÂ Â Â Â Â Â Â Â Â Â Â 3.85Â INCHES BEATTYVILLE 4NÂ Â Â Â Â Â LEEÂ Â Â Â Â Â Â Â Â Â Â Â Â Â 3.68Â INCHES BIG SHELBYÂ Â Â Â Â Â Â Â Â Â PIKEÂ Â Â Â Â Â Â Â Â Â Â Â Â 3.01Â INCHES BOONEVILLE 1SEÂ Â Â Â Â Â OWSLEYÂ Â Â Â Â Â Â Â Â Â Â 4.49Â INCHES BUCKHORN LAKEÂ Â Â Â Â Â Â PERRYÂ Â Â Â Â Â Â Â Â Â Â Â 2.80Â INCHES CARR CREEK LAKEÂ Â Â Â Â KNOTTÂ Â Â Â Â Â Â Â Â Â Â Â 2.73Â INCHES CAVE RUN LAKEÂ Â Â Â Â Â Â ROWANÂ Â Â Â Â Â Â Â Â Â Â Â 2.28Â INCHES CLAY CITY 1WNWÂ Â Â Â Â Â POWELLÂ Â Â Â Â Â Â Â Â Â Â 2.77Â INCHES CLOSPLINT 4ESEÂ Â Â Â Â Â HARLANÂ Â Â Â Â Â Â Â Â Â Â 4.55Â INCHES COLOÂ Â Â Â Â Â Â Â Â Â Â Â Â Â Â Â PULASKIÂ Â Â Â Â Â Â Â Â Â 3.98Â INCHES CRESSYÂ Â Â Â Â Â Â Â Â Â Â Â Â Â ESTILLÂ Â Â Â Â Â Â Â Â Â Â 2.59Â INCHES DRAFFINÂ Â Â Â Â Â Â Â Â Â Â Â Â PIKEÂ Â Â Â Â Â Â Â Â Â Â Â Â 3.54Â INCHES EZELÂ Â Â Â Â Â Â Â Â Â Â Â Â Â Â Â MORGANÂ Â Â Â Â Â Â Â Â Â Â 3.31Â INCHES GIMLETÂ Â Â Â Â Â Â Â Â Â Â Â Â Â ELLIOTTÂ Â Â Â Â Â Â Â Â Â 2.60Â INCHES HARLAN 1SÂ Â Â Â Â Â Â Â Â Â Â HARLANÂ Â Â Â Â Â Â Â Â Â Â 3.80Â INCHES HARLAN STATE POLICEÂ HARLANÂ Â Â Â Â Â Â Â Â Â Â 2.95Â INCHES HAZARD WATERÂ Â Â Â Â Â Â Â PERRYÂ Â Â Â Â Â Â Â Â Â Â Â 3.71Â INCHES HAZARDÂ Â Â Â Â Â Â Â Â Â Â Â Â Â PERRYÂ Â Â Â Â Â Â Â Â Â Â Â 3.70Â INCHES HAZARD STATE POLICEÂ PERRYÂ Â Â Â Â Â Â Â Â Â Â Â 2.95Â INCHES HEIDELBERG 2NÂ Â Â Â Â Â Â LEEÂ Â Â Â Â Â Â Â Â Â Â Â Â Â 4.05Â INCHES BAXTERÂ Â Â Â Â Â Â Â Â Â Â Â Â Â HARLANÂ Â Â Â Â Â Â Â Â Â Â 3.85Â INCHES INEZ 2EÂ Â Â Â Â Â Â Â Â Â Â Â Â MARTINÂ Â Â Â Â Â Â Â Â Â Â 3.78Â INCHES ISLAND CITYÂ Â Â Â Â Â Â Â Â OWSLEYÂ Â Â Â Â Â Â Â Â Â Â 5.16Â INCHES IVELÂ Â Â Â Â Â Â Â Â Â Â Â Â Â Â Â FLOYDÂ Â Â Â Â Â Â Â Â Â Â Â 2.27Â INCHES NWS JACKSONÂ Â Â Â Â Â Â Â Â BREATHITTÂ Â Â Â Â Â Â Â 4.12Â INCHES JEREMIAH 1SÂ Â Â Â Â Â Â Â Â LETCHERÂ Â Â Â Â Â Â Â Â Â 3.11Â INCHES KINGDOM COME ST PARK HARLANÂ Â Â Â Â Â Â Â Â Â Â 3.12Â INCHES LONDON CORBIN APTÂ Â Â LAURELÂ Â Â Â Â Â Â Â Â Â Â 4.46Â INCHES MONTICELLO 3NEÂ Â Â Â Â Â WAYNEÂ Â Â Â Â Â Â Â Â Â Â Â 4.00Â INCHES MOUNT STERLING 5NÂ Â Â MONTGOMERYÂ Â Â Â Â Â Â 2.41Â INCHES MOUNT VERNONÂ Â Â Â Â Â Â Â ROCKCASTLEÂ Â Â Â Â Â Â 2.77Â INCHES ONEIDAÂ Â Â Â Â Â Â Â Â Â Â Â Â Â CLAYÂ Â Â Â Â Â Â Â Â Â Â Â Â 4.54Â INCHES PAINTSVILLE 1EÂ Â Â Â Â Â JOHNSONÂ Â Â Â Â Â Â Â Â Â 3.55Â INCHES PIKEVILLE ST POLICEÂ PIKEÂ Â Â Â Â Â Â Â Â Â Â Â Â 2.05Â INCHES PRESTONSBURG 3NWÂ Â Â Â FLOYDÂ Â Â Â Â Â Â Â Â Â Â Â 4.09Â INCHES QUICKSANDÂ Â Â Â Â Â Â Â Â Â Â BREATHITTÂ Â Â Â Â Â Â Â 3.52Â INCHES RELIEFÂ Â Â Â Â Â Â Â Â Â Â Â Â Â MORGANÂ Â Â Â Â Â Â Â Â Â Â 3.18Â INCHES ROGERSÂ Â Â Â Â Â Â Â Â Â Â Â Â Â WOLFEÂ Â Â Â Â Â Â Â Â Â Â Â 2.82Â INCHES SALYERSVILLEÂ Â Â Â Â Â Â Â MAGOFFINÂ Â Â Â Â Â Â Â Â 4.28Â INCHES SANDY HOOKÂ Â Â Â Â Â Â Â Â Â ELLIOTTÂ Â Â Â Â Â Â Â Â Â 2.67Â INCHES SKYLINEÂ Â Â Â Â Â Â Â Â Â Â Â Â LETCHERÂ Â Â Â Â Â Â Â Â Â 3.20Â INCHES SLADE 5NEÂ Â Â Â Â Â Â Â Â Â Â POWELLÂ Â Â Â Â Â Â Â Â Â Â 2.86Â INCHES SOMERSET 2NÂ Â Â Â Â Â Â Â Â PULASKIÂ Â Â Â Â Â Â Â Â Â 3.74Â INCHES STANTON 2WÂ Â Â Â Â Â Â Â Â Â POWELLÂ Â Â Â Â Â Â Â Â Â Â 2.88Â INCHES STEARNS 2SÂ Â Â Â Â Â Â Â Â Â MCCREARYÂ Â Â Â Â Â Â Â Â 5.09Â INCHES VICTORY 5NWÂ Â Â Â Â Â Â Â Â LAURELÂ Â Â Â Â Â Â Â Â Â Â 4.13Â INCHES WEST LIBERTY 3NWÂ Â Â Â MORGANÂ Â Â Â Â Â Â Â Â Â Â 2.67Â INCHES WEST LIBERTY 11NWÂ Â Â MORGANÂ Â Â Â Â Â Â Â Â Â Â 2.57Â INCHES WHITESBURGÂ Â Â Â Â Â Â Â Â Â LETCHERÂ Â Â Â Â Â Â Â Â Â 2.50Â INCHES WHITESBURG 2SEÂ Â Â Â Â Â LETCHERÂ Â Â Â Â Â Â Â Â Â 3.21Â INCHES WILLIAMSBURG 1NWÂ Â Â Â WHITLEYÂ Â Â Â Â Â Â Â Â Â 5.14Â INCHES
THE NATIONAL WEATHER SERVICE AT JACKSON WOULD LIKE TO THANK ALL THE
DEDICATED COOPERATIVE WEATHER OBSERVERS FOR THEIR TIMELY REPORTS."
The past day’s weather has included periods intense light and shadow from very low, broken stratus & cumulus clouds. Rays of love from god shine from heaven through parted clouds; and there was plenty of love in the mountains. Even in these low quality webcam images, you can see golden rays of light and clearly defined ridges. Now what if you were there with a serious camera.
Though the weather overall has been chilly and uncomfortable, it does give some memorable vistas. The more diffuse stratus clouds in the western mountains were lower in altitude and created softer light.

View from Purchase Knob
As we gear up for the Sheltowee Trace topographic map, I thought it would be interesting to see if a complete 3d map of the ST could be printed. Unfortunately, it would have to be a huge sheet of paper to get the detail necessary for a good map. But as an online viewer, I see potential. This sample is a raw render output and you can see well the basic physiography. Now we just need to add trails, transportation, labels, etc….nothing too much, just about 6,000 sq. mi. for the Daniel Boone NF.

Explore this map through a zoomable flash map
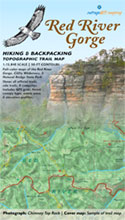 5th Edition Red River Gorge Backpacking Map
It’s almost ready for release!
A complete remake of our popular backpacking guide with the green maps. This new set keeps all of the great features of the old maps, but in full-color and updated trails and data.
Visit our Gorge webpage to learn more: http://www.outrageGIS.com/gorge
In January we looked at the previous editions, all 2-color with an travel elevation profile booklet, and thought how we could improve it. We had used aerial photography to show landcover type, which did a good job indicating density of canopy, open areas, sunlight, and offered a rustic green background for our GPS trails.
However, most people are confused when they look at aerial photographs…they think hills are valleys and vice versa. This terrain inversion is a significant cartographic problem, but we were confident then when most people *used them in the field* they made sense.
While unique advantages exist using photographs, for the new edition we used a custom created, full-color hillshade that shows forest canopy cover type and open areas. We artificially lit the landscape from the west and eliminated terrain inversion. We added a distinct stream symbol to clearly mark drainage. With 50-foot contours and spot elevations, this new edition offers a handsome way to stay located.
Since most GPS applications are now by default in the latitude/longitude (decimal degrees) coordinate system, we added this graticule to the map. A UTM grid is also labeled. With scales on the corners of maps that can be seen while folded, a hiker can quickly determine distance and locate themselves with a GPS in either dd.dddd or UTM coordinate systems.
We still have all of the trail profiles, side trails, backcountry campsites that were in the previous edition. The new edition actually covers more area and trails.
| Red River Gorge Backpacking Map: $14 |
 |
 April 15, 2009. We see two very different Smokies today and the highest peaks in the southern Appalachians provide an atmospheric boundary.
On the west side of the mountains we see low dense stratus clouds, but on the east side we have clear skies. As the atmosphere is uplifted over the the highest ridge of mountains there’s cooling and abundant cloud formation. That’s half the story.
The winds are form the northwest and the Smokies (along the Tennessee/North Carolina stateline) provide the highest barrier the winds must cross over. On the leeward side, as the winds cross over the mountains, they descend, warm, and prevent cloud formation especially just east of the summits.
Link to more: http://pixel.outragegis.com/v/weather_maps/090415_TwoSmokies/
These images and animation show a textbook situation of topographic control of weather, but over a very large area.
Many customers ask us why we use aerial photography. Often it’s hard for some readers to understand because of terrain inversion. Let’s take a Q&A with a real customer:
Customer, “Hi guys. I just wonder if anyone has ever discussed with you the fact that the shading on your maps appears to be reversed. That is, the high points appear like low points and vice versa, if one is looking at the map oriented to north. If one turns the map around, so it is oriented to south, then everything looks correct. So, my guess is simply that the shading is on the wrong side of the ridges. ”
Our response, “Thanks for asking a question that has popped up a few times. In the mapping biz, it’s called terrain inversion and it is a problem sustained by tradition. Before aerial photography, most terrains were shaded as if the sun was in the upper-left corner. This was established as cartographic tradition because we read from upper-left to lower-right.
This worked fine until aerial photography became used as base maps. In the northern hemisphere, and especially at our latitude, the sun is never shines from the north. All of our shadows fall from south to north, completely opposite to how they’re depicted on most conventional maps. Cartographers in the southern hemisphere think we’re crazy up here moving the sun around to accommodate tradition at expense of reality. But they have the advantage of sun always being in the upper quadrants, thus giving the type of illumination you’re probably used to.
But we use aerial photography in most of our maps, because it is reality and at the right scale is far superior to an artificial hillshade in our opinion for couple reasons. You can see areas that are really in shadow, which indicate different plant communities. You can see canopy type, density, and other indicators for type of forest. If you’re a photographer, these images show depth and lines of shadow, helping you predict the kind of light you want for a photo. Finally, if you have take an aerial photo up high to orient, you can do so by shadows.

Detail from our Big South Fork map with aerial photography. Note the north facing cliffs are in shadow, just as in found in the wild.
So in my defense, I say it’s all about sunlight. I understand your problems and trust me, it has stirred the anger of my peers at cartography conferences. We’ve been flamed on blogs for this apparent flaw, but in our humble opinion, an aerial photo is not the problem, it’s tradition.
It’s sounds like you have a lot of experience with maps, and I respect your opinion. However, I think if you get used to aerial photography, you’ll find distinct advantages. Also in defense of tradition, I did illuminate our recent map, Trail Atlas of the Great Smokies from the NW. That map does not use aerial photography so it was an easy decision.”
Tonight at 10:28 P.M. we will have our March full moon, the last full moon of winter. Full moons throughout the year have names given by early settlers and Native Americans to indicate important seasonal activities…such as a Harvest Moon and Hunter’s Moon.
The March full moon is know as a Worm Moon in the Farmer’s Almanac, for the warming of the soil and emergence of earthworms that herald the return of robins and spring. Also known as a Sap Moon for rising maple tree sap, a Lenten Moon for catholic settlers, and a Crow Moon for the cawing of crows that indicate the end of winter.
Below are photos of the moonrise above the Great Smoky Mountains. The far mountain peak the moon rises over is Mt. Le Conte.
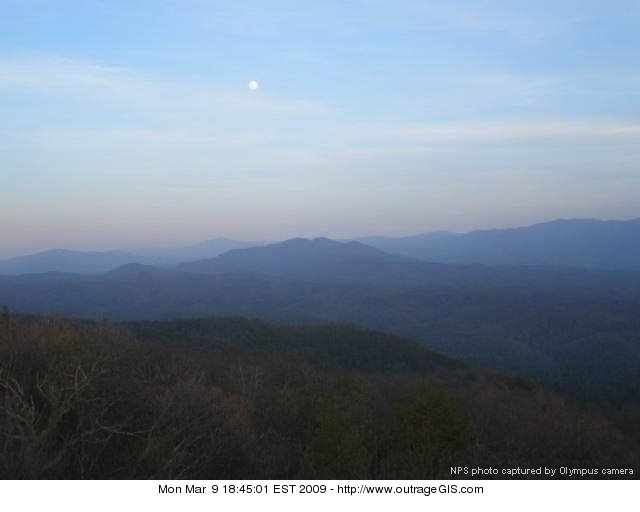
I have added a new look to the homepage that incorporates real-time weather from the National Weather Service and a web cam overlooking the Great Smokies. The page also changes during the day to reflect the amount sunlight. The goal here is to inspire the city-bound hiker to get on the trail this spring.

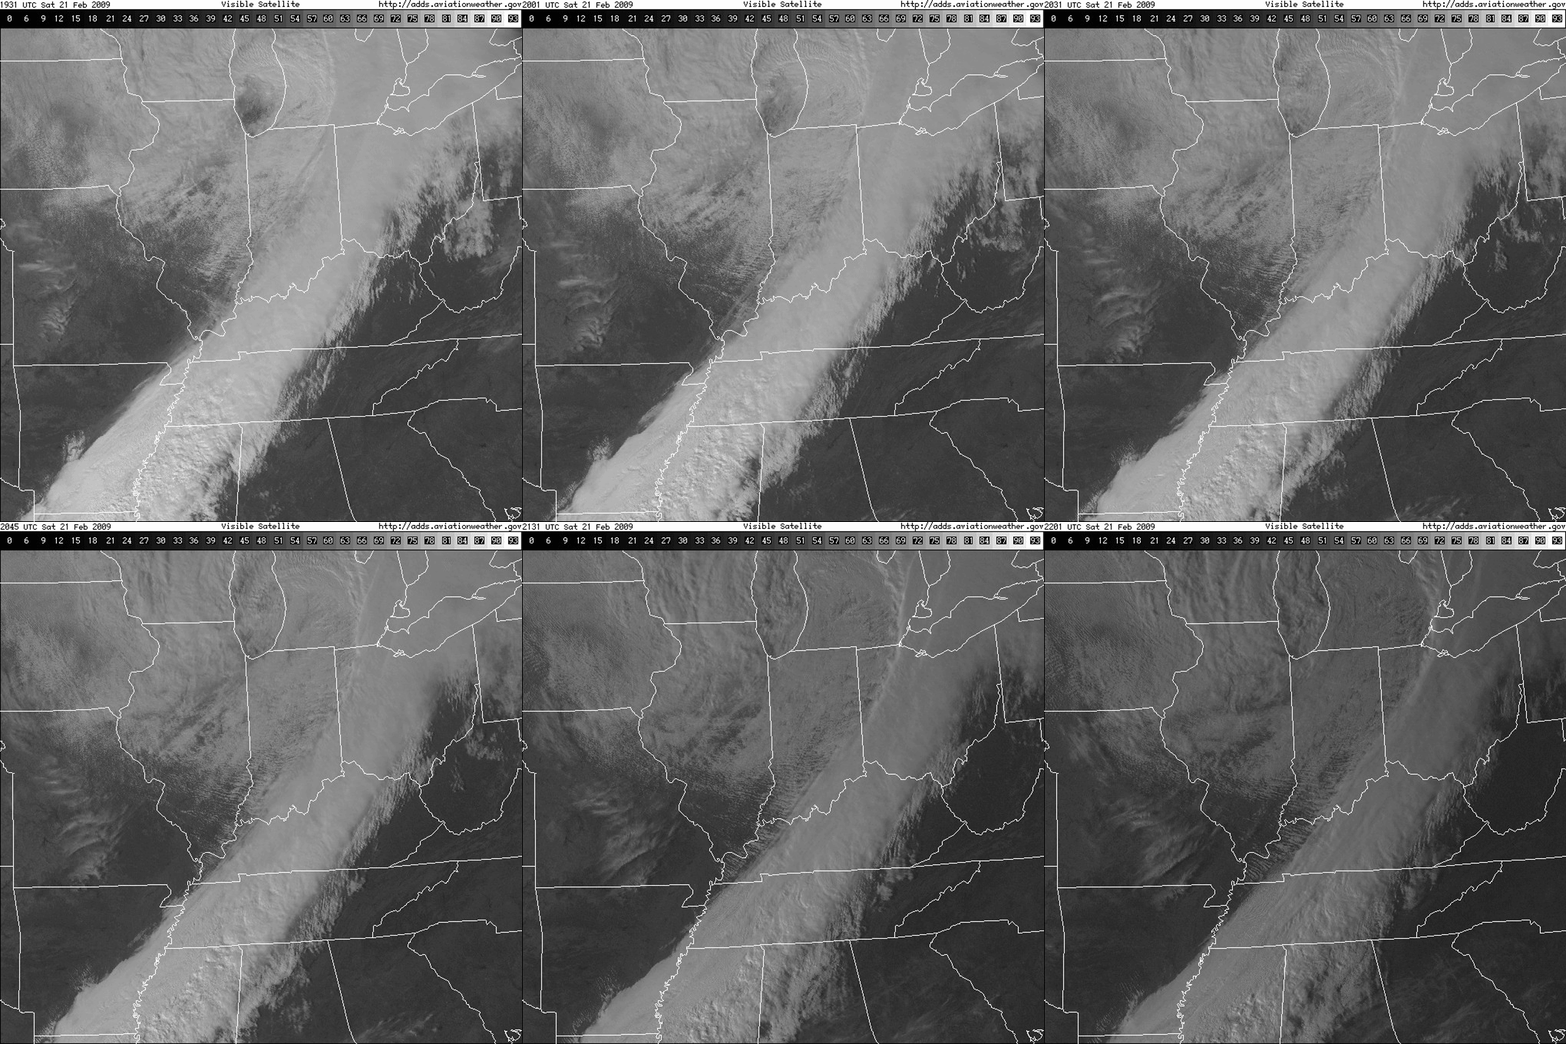 Warm weather is approaching and I thought it would be great to have more web cams and animations to watch the unfurling of Spring and severe weather.
The animation to the left is the visible light spectrum from the GOES satellite and shows a cold front passing over Kentucky this past Saturday. I have assembled a few scripts to output a daily animation from dawn until dusk at four frames per hour.
Each frame is 640 pixels square, so each daily animation is about 8-16 megabytes, depending on the length of daylight. I’m working on automating the output to a .flv movie which would be easier on bandwidth. View a large-version snippet of this of this animation here. As I get the file sizes smaller, these animations will be incorporated into the weather page.
What I find most exciting about these animations is that they are photographs. We know weather and clouds from ground level of course, but to see a corollary from space I think helps a photographer understand the movement of clouds and how they filter sunlight. Though it’d be hard to use these animations to predict future light conditions beyond a few hours, they are helpful in understanding how the atmosphere moves and, in retrospect, what cloud cover is associated with which weather conditions.
How about a full day of photographs?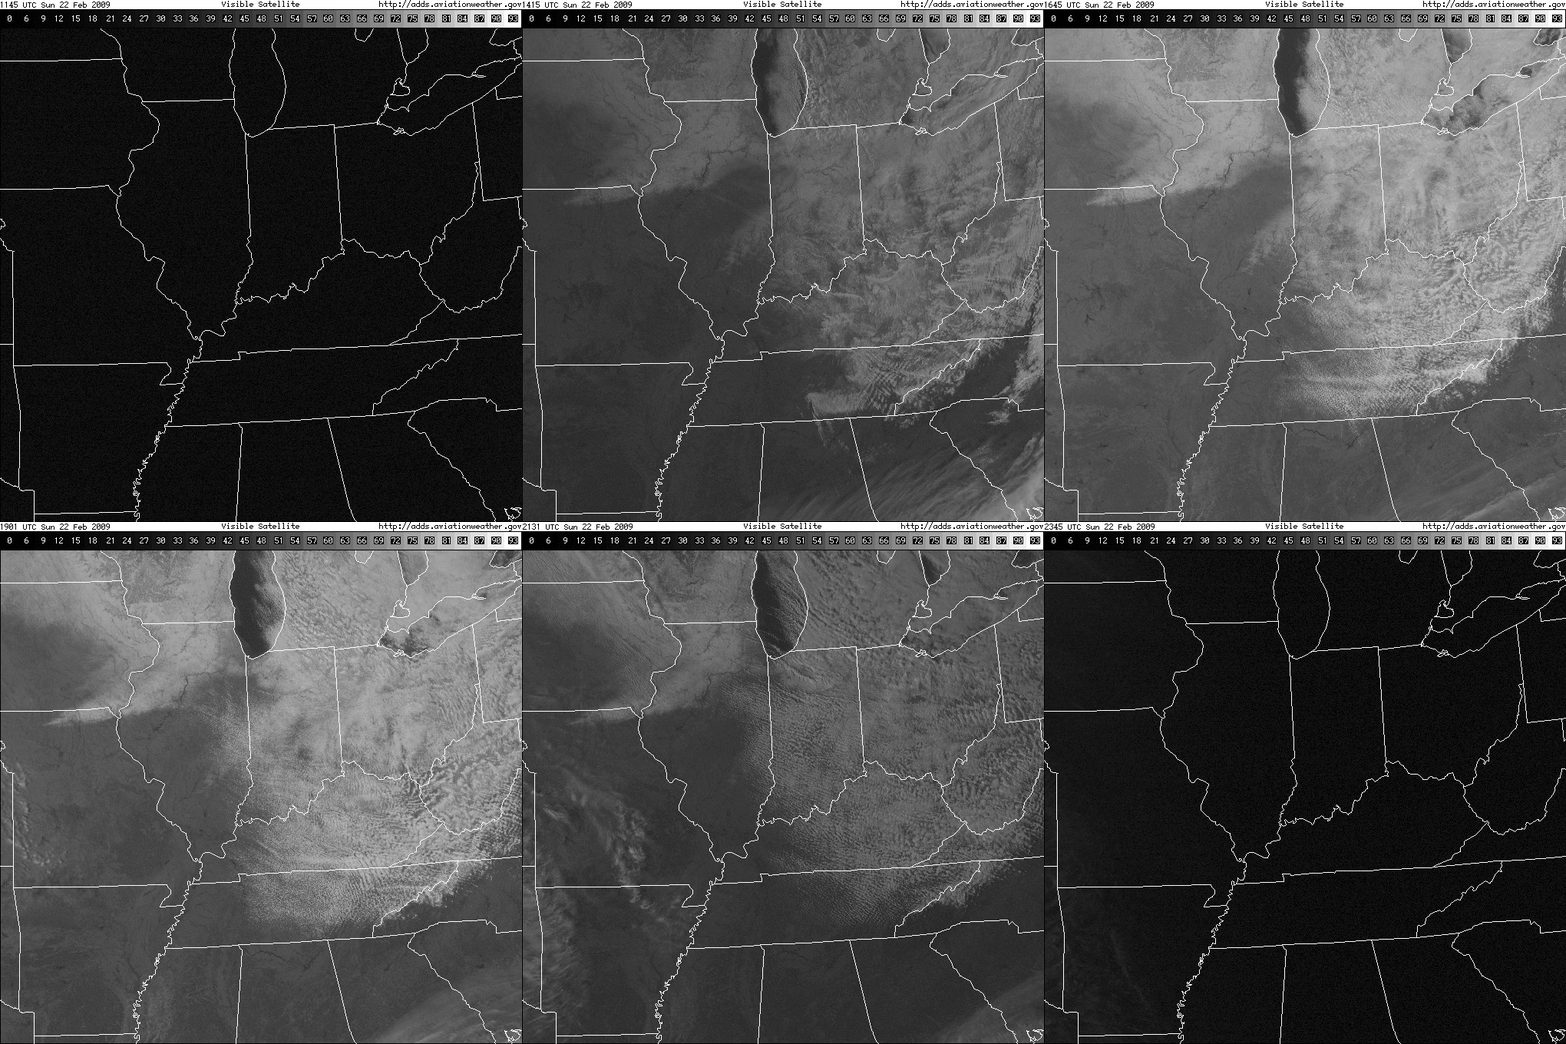
The animation to the right is a full-day digest from Sunday. It shows the snow cover and lake effect snow machine impacting the Appalachians. The full animation is 9 megabytes and can be view here. Note the clearly defined line of cloud cover and snow over the mountains that straddle the TN-NC state line. To the east you can see Mt. Mitchell and its orographic uplift.
Two New Web Cams
Our current NPS web cams Look Rock and Purchase Knob both look east. I incorporated two forest service web cams, Joyce Kilmer and Cold Mountain, which both look west. Though they are not in the park, they are useful in getting a panoramic real-time view of the Great Smokies. All of these web cams can be found on our Great Smokies weather page: http://www.outrageGIS.com/weather/grsm.
 Winter storm warning, Dec 15-16, 2008.
“The National Weather Service will issue a winter storm warning when a dangerous combination of heavy snow, with sleet and/or freezing rain, will occur or has a high probability of occurring within the next 12 hours.”
Severe winter weather events are notorious to forecast. Our TV weathercasters had a range of predictions from a half-inch of ice accumulation to 5 inches of snow. The National Weather Service (NWS) had a similar forecast. After the event, we had a lot of variability across the region, so in part, all of the predictions were somewhere correct. I think the NWS made a good prediction on where the bad weather would happen, but the severity was hard to calculate.
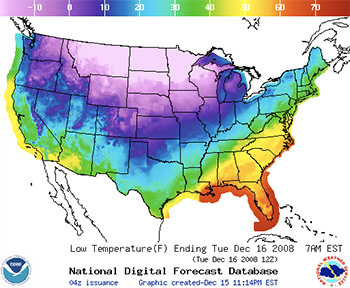
The above map (shown in greater detail below) shows low temperatures across the U.S. and highlights the problem with forecasting such a large storm. The huge temperature change from -20° F in the northern states to 60° F in the southeast indicates two vastly different air masses in close proximity. The greater the difference, the more difficult the predictions. When the air masses begin to interact and do their dance, that’s the problem.
It’s easy to forecast calm conditions, but when the weather becomes bad, the severity is determined by how different the air masses are and how much they interact. Two similar air masses doing a “big dance” will have little impact. Two vastly dissimilar air masses just interacting slightly will produce enormous weather. Though we can measure the characteristics of air masses, the problem is that we can’t predict how they’ll interact.
The basic setup we had here was that cold polar plunged southward, and displaced the warmer, more moist tropical air. As the warmer, less dense air rode over the advancing colder, denser air, precipitation fell as rain. As it traveled through the colder, ground layer of air, it froze on surface contact. That’s freezing rain. However when upper layer of air approaches the freezing point, precipitation could fall as snow or sleet. As this boundary zone between air masses changes, the vertical temperature profile changes and so does the type precipitation that hits the ground.
Can you feel it for the weathercaster trying to predict this stuff?
Watches and Warnings Map, Dec 16
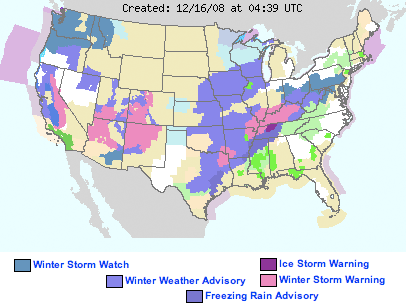
Above map is the Watches and Warnings for the U.S., December 16, 2008. Compare this map to the below map, which forecasts low temperatures for this morning. Note the axis of warnings from Texas to Pennsylvania which overlays a sharp temperature contrast between the polar air to the northwest and tropical air to the southeast. This steep temperature gradient is almost 90° F and is zone of interaction.
Low Temperature Map, Dec 16
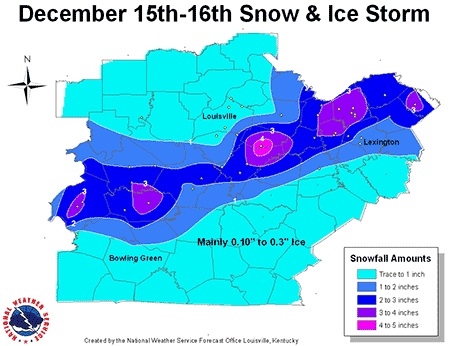
The below map shows snow and ice totals for the Bluegrass region.
 Wind advisory, Sunday Dec 14, 2008
The National Weather Service will issue a wind advisory for sustained winds 31 to 39 mph for at least 1 hour or any gusts 46 to 57 mph. However, winds of this magnitude occurring over an area that frequently experiences such winds would not require the issuance a wind advisory.
Lexington recorded sustained winds of 39 mph with gusts around 45 mph. This created difficult walking conditions at times around downtown. Wind speeds can be faster in isolated parts of the built environment because of turbulence. Though cities typically decrease average wind speeds near ground level, during periods of high wind speed tall buildings interrupt flow causing them to ‘pile up’ on windward sides and then rush off with increased velocity in channels between buildings. Wind eddies on the leeward side of buildings will also have strong gusts.
A comparison to a simple stream might be helpful. Water flows fastest in the stream’s center. An obstruction blocking the stream will divert the flow into two channels, each with increased velocity. Unlike water though, air can be highly compressed. When air piles up on the windward or upstream side, it will move in a more dynamic manner around the obstruction. Turbulence.
The mechanics of how all this plays out is beyond my understanding, but it is sufficient to say that when a wind advisory is issued for Lexington, we can experience strong and erratic winds downtown. I noticed many flocks of pigeons remaining on their protective perch, and no soaring hawks or vultures, so that’s probably a good gauge of strong turbulence.
The last time the area was under a wind advisory was during the passing of the remnants of Hurricane Ike. I think winds gusted to near-hurricane strength. Winds this weekend are associated with a strong low that passed to our north. This low pressure system created blizzard conditions and wind chill warnings across the northern states. The system also brought the cold punch of air that created our first major winter storm a day later.
The chart below is from the Beaufort Scale of wind speed. So next time you’re wondering, “What’s that wind speed?” here’s your chart.
| Description | Speed | Visual Clues and Damage Effects |
|---|---|---|
| Calm | Calm | Calm wind. Smoke rises vertically with little if any drift. |
| Light Air | 1 to 3 mph | Direction of wind shown by smoke drift, not by wind vanes. Little if any movement with flags. Wind barely moves tree leaves. |
| Light Breeze | 4 to 7 mph | Wind felt on face. Leaves rustle and small twigs move. Ordinary wind vanes move. |
| Gentle Breeze | 8 to 12 mph | Leaves and small twigs in constant motion. Wind blows up dry leaves from the ground. Flags are extended out. |
| Moderate Breeze | 13 to 18 mph | Wind moves small branches. Wind raises dust and loose paper from the ground and drives them along. |
| Fresh Breeze | 19 to 24 mph | Large branches and small trees in leaf begin to sway. Crested wavelets form on inland lakes and large rivers. |
| Strong Breeze | 25 to 31 mph | Large branches in continuous motion. Whistling sounds heard in overhead or nearby power and telephone lines. Umbrellas used with difficulty. |
| Near Gale | 32 to 38 mph | Whole trees in motion. Inconvenience felt when walking against the wind. |
| Gale | 39 to 46 mph | Wind breaks twigs and small branches. Wind generally impedes walking. |
| Strong Gale | 47 to 54 mph | Structural damage occurs, such as chimney covers, roofing tiles blown off, and television antennas damaged. Ground is littered with many small twigs and broken branches. |
| Whole Gale | 55 to 63 mph | Considerable structural damage occurs, especially on roofs. Small trees may be blown over and uprooted. |
| Storm Force | 64 to 75 mph | Widespread damage occurs. Larger trees blown over and uprooted. |
| Hurricane Force | over 75 mph | Severe and extensive damage. Roofs can be peeled off. Windows broken. Trees uprooted. RVs and small mobile homes overturned. Moving automobiles can be pushed off the roadways. |
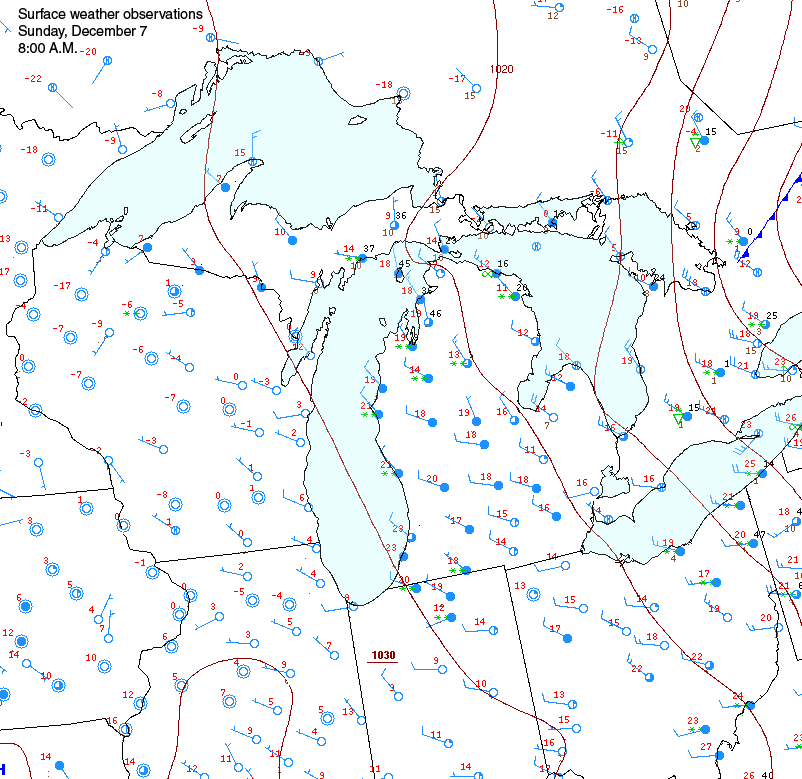
One of the most obvious and striking winter weather conditions is the atmospheric influence of the Great Lakes. When high pressure builds to the west of the Great Lakes and there’s a prominent northwest-to-southeast surface wind flow, weather is significantly different downwind of the lake compared to upwind. This often produces lake effect snow that can truly bury southeastern shore cities. However, the same influence can reach far south into Kentucky and the Appalachians.
The difference in weather can be outstanding, as people who live near the lakes know very well. Observe weather on both sides of Lake Michigan. The red number indicates the temperature in °F and the circle indicates cloud cover. A solid circle is completely cloudy, and an empty circle represents clear skies. The barb indicates wind speed and direction (see below for legend).
Compare Lake Michigan’s west shore with its east shore. The west shore of Lake Michigan is cold, below zero, and cloudless. Weather on the east shore of Lake Michigan is 20°F warmer, it is cloudier, and snow is falling, as represented by the green asterisks.
The cause of these conditions is simply the great reservoir of heat that the lakes contain and transfer to the atmosphere through evaporation. Though the lakes are slowly cooling through winter, they are significantly above freezing across a large area. When a colder, dry air mass blows over the lakes, evaporation will transfer heat and moisture into the air mass. As the rising, warmer air cools, if often condenses resulting in cloudiness and heavy snow; the lake effect snow machine. Also note the how far south the warmer air has penetrated compared to other locations at the same latitude.
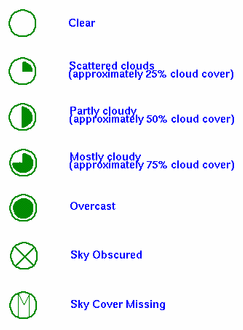
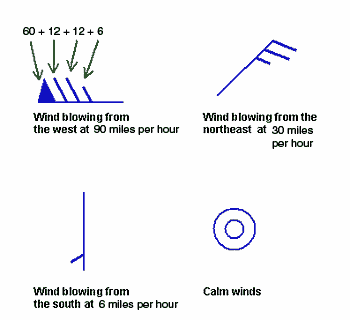
For example this station here:  is reporting that the current temperature is 55 degrees F, the sky is clear, and the winds are blowing from the north at 18 miles per hour.
And this station  is reporting completely overcast conditons, winds from the north at 24 miles per hour and the temperature is 58 degrees F.