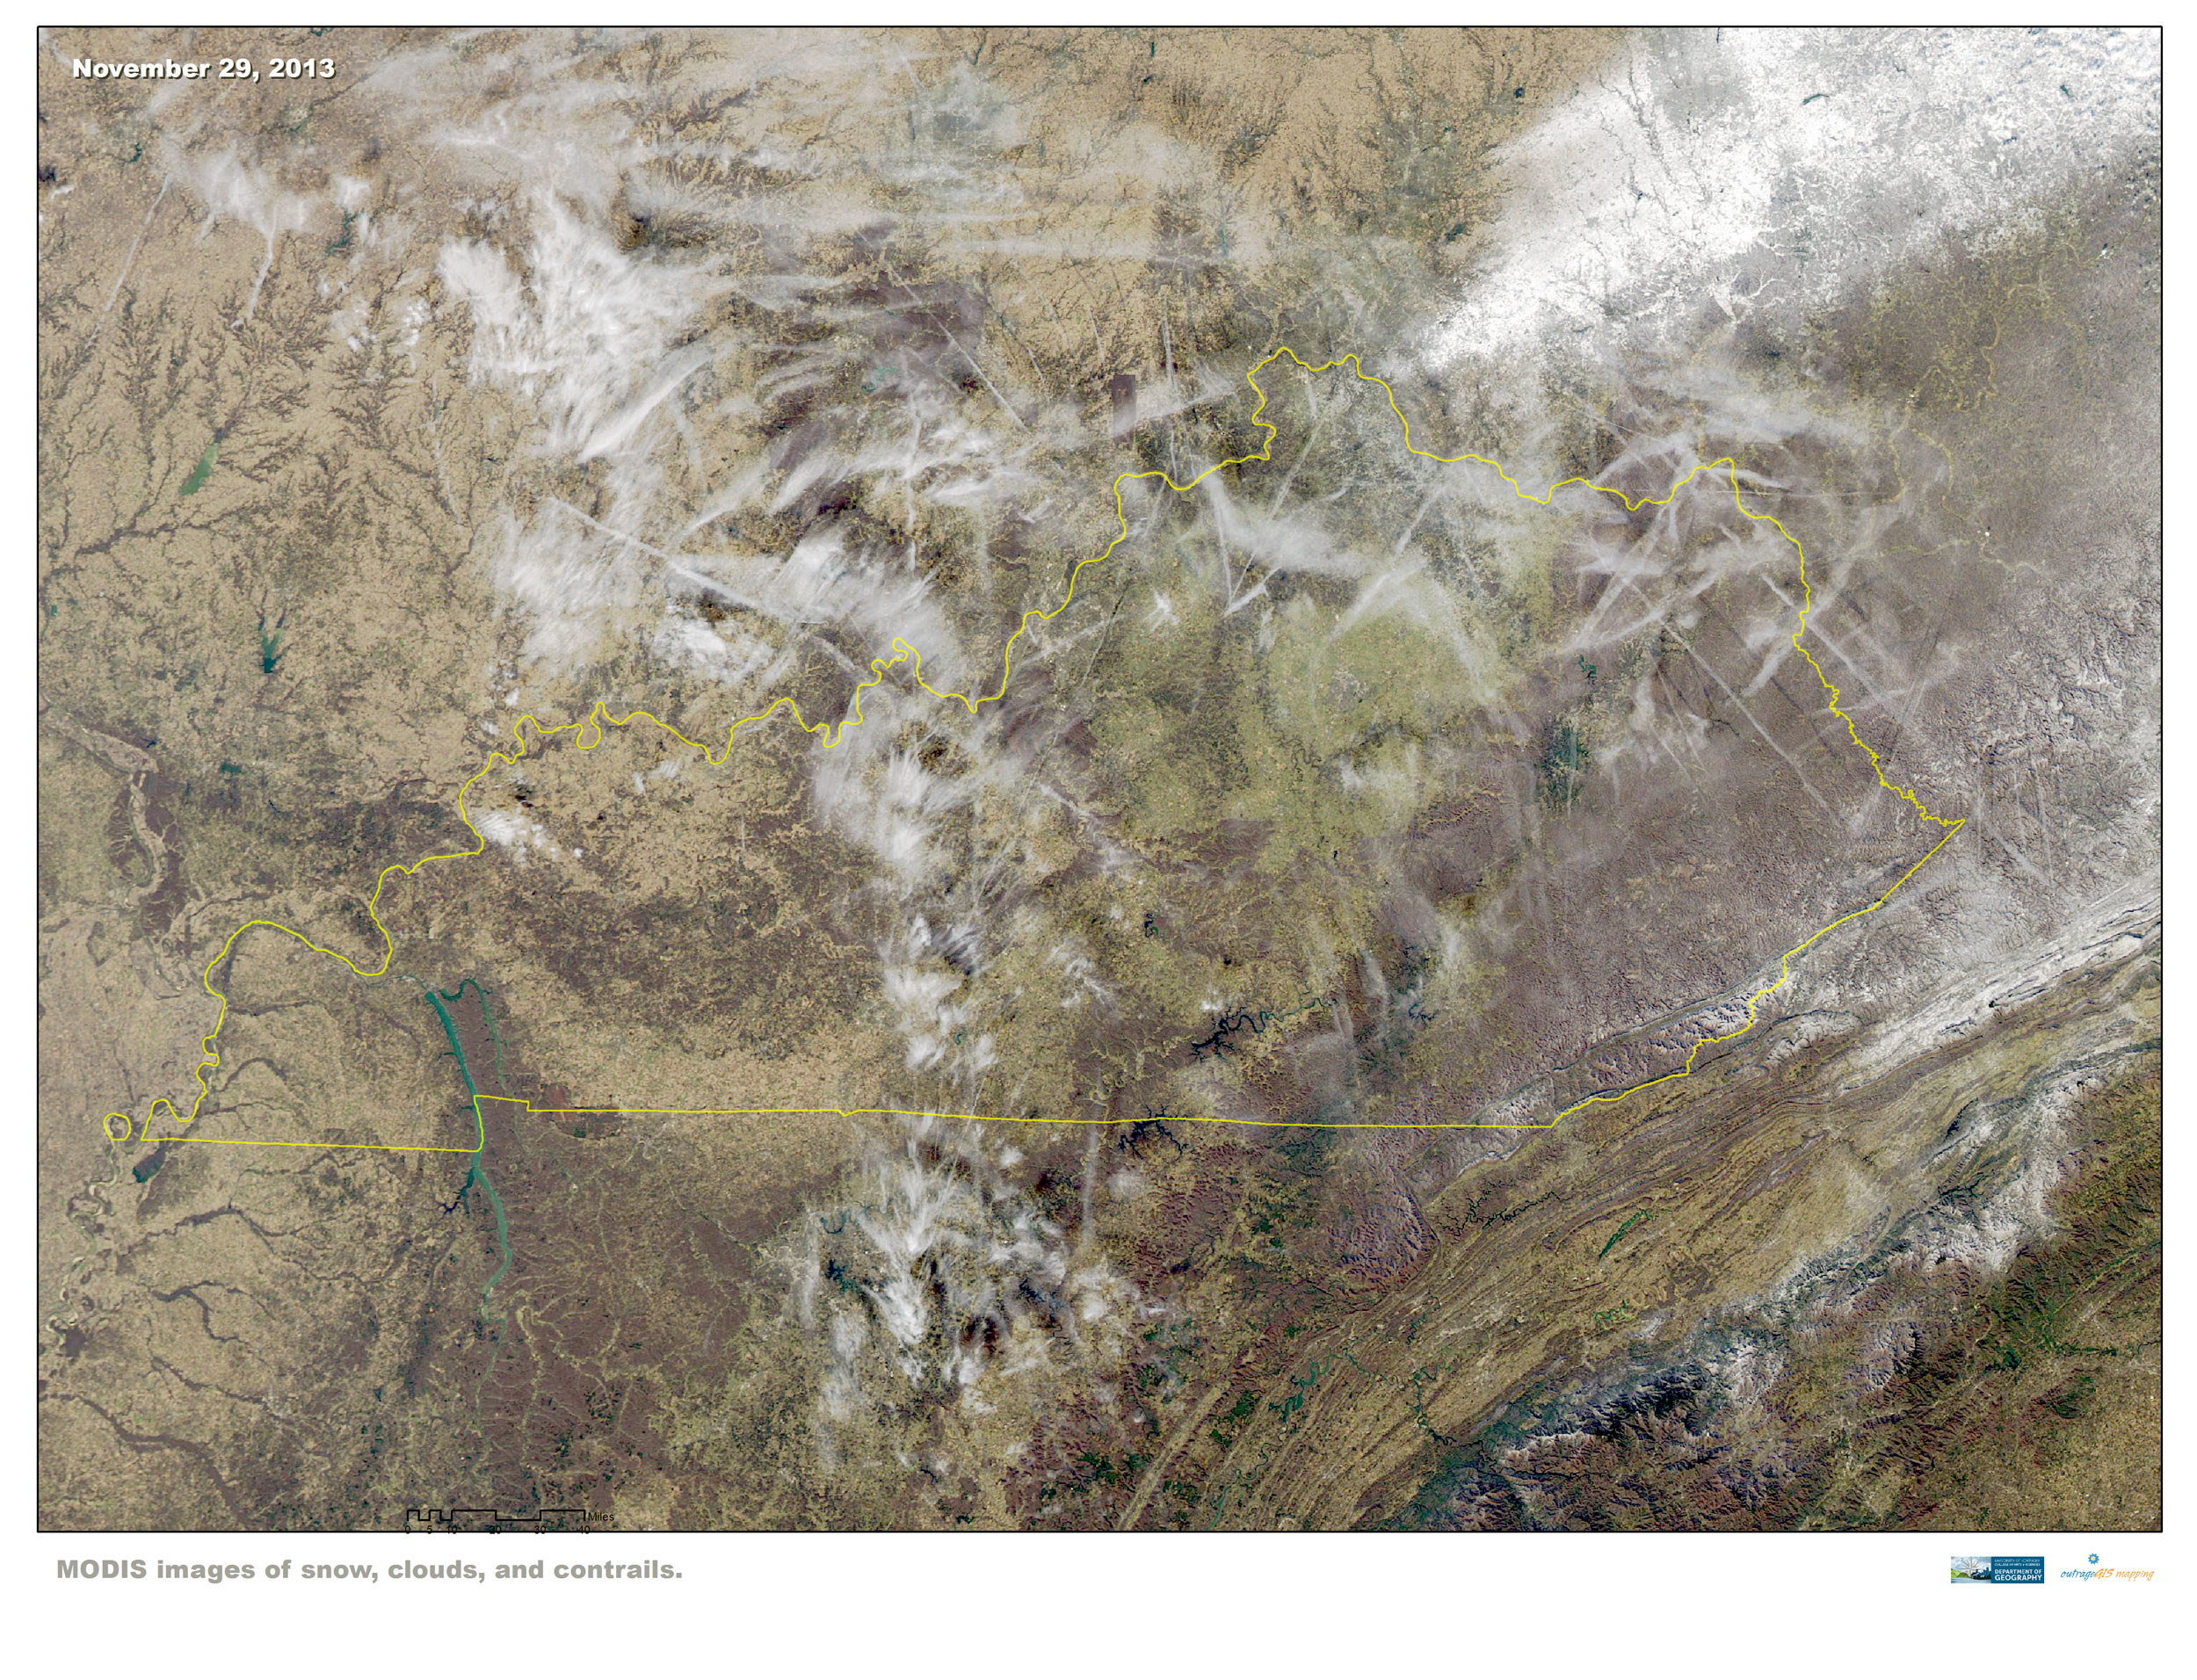
 On the day after Thanksgiving, the eye in the sky from MODIS shows heavy snowfall in southeast Ohio and in the highest Kentucky and West Virginia mountain locations. Contrails fill most of Kentucky’s northern skies.
Snow, Clouds, and Contrails
November 30, 2013 by Leave a Comment
Kentucky transitions into fall
November 17, 2013 by Leave a Comment
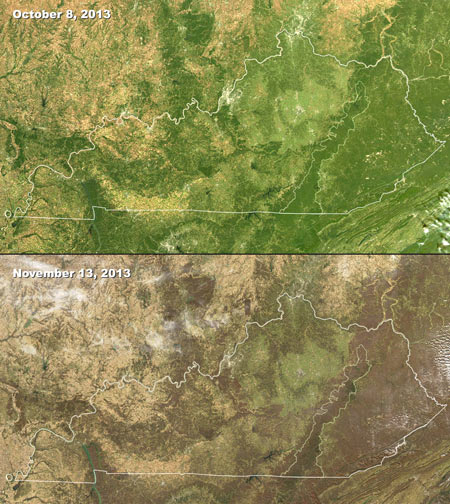
MODIS images of changing seasons in Kentucky, 2013
These satellite images are from the Moderate Resolution Imaging Spectroradiometer (MODIS) instruments on two satellites, Aqua and Terra. MODIS captures 36 electromagnetic wavelength bands to measure atmospheric water vapor, ozone, aerosols, land fire, surface temperature, and many other important variables of global climate. These images are visible light and clearly show the change in deciduous canopy cover within roughly a month of time. Spatial resolutions are between 250 m to 1 km.
Signature of a Supercell
November 17, 2013 by Leave a Comment

November Supercells
These satellite images show the unusual tornado outbreak that occurred on November 17, 2013. The top image captured, in false color, the height of clouds at the time when supercell thunderstorms were generating tornados in Illinois. Note the pancaking or mushrooming of the tallest clouds with feathering to the northeast and a distinct northern shadow; those are the classic anvil clouds and a signature of a supercell thunderstorm.
In the black and white image below, we see storms a few hours later. A supercell is located in western Kentucky. The setting sun highlights many tall thunderstorm clouds.
Late May in the Mountains
May 24, 2013 by Leave a Comment

May 24 weather animation for Cold Mountain
Cold Mountain clears into view after the morning fog burns off and reveals the marvelous green from this spring’s abundant moisture. One can see that spring is just reaching the summit and a beautiful sunset occurred on this spring day.
Spring Day
April 19, 2013 by Leave a Comment

April 15 weather animation
A nice cloud swept sunrise this past Monday and a fantastic afternoon to follow. Special days ahead.
Climate prediction for next weekend
April 5, 2013 by Leave a Comment
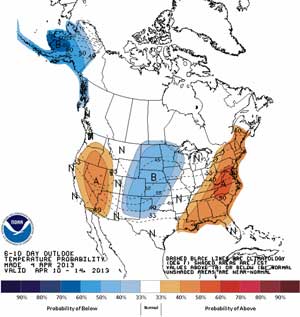
6-10 day temperature prediction
We know this weekend is setting up to be the best hiking weather we’ve had in this year. So go out if you can! But if you can’t and would like to plan a trip next weekend, it’s also looking good. This climate model predicts we’ll have higher than normal temperatures and precipitation during next weekend and into the first of week following. Temperatures could average around 55° F with rain about 0.4″ above normal rates for April 10-14. That’s a good spring forecast and we welcome the coming of the growing season.
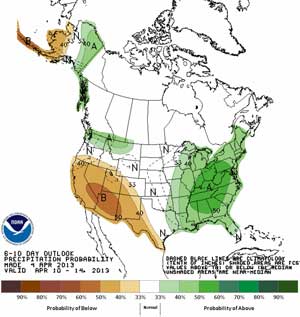
6-10 day precipitation forecast
Tale of Two Years
April 1, 2013 by Leave a Comment
We have a late spring this year and you can see it with the Look Rock webcam. The first image is from April 1, 2013 and doesn’t show much greening of the trees. The second image is an animation from April 1, 2012 and you can quickly notice much more tender green.
Early Spring Snow in the Great Smokies
March 27, 2013 by Leave a Comment

Snow on Mt. LeConte
In winters past, the highlands of the Great Smokies could expect an average of 8-10 feet of snow. This winter we’ve had much less, though the average temperatures have about normal. On March 26, however, we saw a dramatic snowfall with Mt. LeConte getting about 20″ in one storm with little snowfall at lower elevations. These images clearly show the snow line and give a unique feeling to the mountain scenery.
National Weather Service Update
August 7, 2012 by Leave a Comment
Within the past few months, the National Weather Service updated many of their websites, which impacted our weather services on outrageGIS.com. We are happy to announce that we have completed updates on our end so we can continue to serve up weather information for the Daniel Boone and Great Smokies.
The biggest change was to their home page and to the point locations’ weather and forecast pages. This caused our 7-day forecast to break, but we have fixed the problem. Also, the rss feeds for watches and warnings were dropped for point locations, so we had figure out a work around to pull in these important messages. While we didn’t replicate the rss feeds, we were able to pull in hazardous weather discussions for our locations. It kinda works and thank goodness for the command line utilities pcregrep and sed.
A day of weather in the Great Smokies
March 6, 2011 by Leave a Comment
A somber late-winter day from Look Rock mountain overlook, March 5, 2011. [Read more…]
El Niño to make the mountains colder and drier this winter
October 18, 2009 by Leave a Comment
Predicting climate in the old days relied upon observing cues in nature. The Farmers’ Almanac finds that people looked at woolly worms in late summer in get a sense of winter. The more black hairs on the worm, the colder and wetter the winter. Of course woolly worms come in all configurations of black and orange colorings so how could a worm’s coat predict winter? It can as an analogy; you look at the forecast to decide which coat you’re going to wear before leaving home. I think you would want to wear a black coat as opposed to a white coat on a very cold and sunny day to maximize the amount of solar energy you could absorb. Woolly worms just plan far ahead.
Today we track global changes in wind patterns and sea surface temperatures to predict weather conditions. NOAA’s Climate Prediction Center has issued a climate forecast for this winter based on the El Niño pattern emerging in the Pacific Ocean.
Below are winter predictions for the U.S. indicating greater or lesser chances for departures in average winter temperatures and precipitation.


El Niño is a departure from average sea surface temperatures created by a change in the intensity and direction of equatorial winds. In a normal period, strong easterly trade winds blow across the Pacific and upwell cold, nutrient rich waters on the west coast of South America. These same winds also pile up water in the western Pacific so that the sea surface is about 2 feet higher at Indonesia than at Ecuador.

In an El Niño cycle, the winds are not as intense and warmer sea surface temperatures extend further to east. This change has a global impact on weather with increased precipitation on the west coast of South America and the south & east coasts of North America. Warmer than normal conditions also occur at higher latitudes in North America and over the Pacific ocean.

El Niño Sea Surface Temperatures in °C
Animations of the Atmosphere
June 5, 2009 by Leave a Comment
As a lover of the atmosphere and sun, I want to see how light and sky change over the course of the day. I also want to see how large-area weather events, such as the passage of a front, impact different places in the Great Smoky mountains. The inspiration behind this page was a desire to record weather changes at different elevations on a mountain and to help the photographer in me better understand a secretive and dynamic landscape.
Enter Yesterday: a site of prior-day animations of federal web cams and satellite imagery located here at http://www.outragegis.com/weather/img/animation/yesterday. Note this page always shows conditions for the prior day since they are full-day timelines.
The Great Smokies have about one mile of vertical relief and weather conditions can be dramatically different depending on your elevation. Whatever it’s a line of thunderstorms or fog in the valleys on a calm morning, this is a visual record of evolving conditions…only of course it happens during daylight. For the weather nut who likes to take it a step further, the page gives data from park’s 5 weather stations for the same day….and it’s all archived.
How was it done? After tinkering with ImageMagick and FFmpeg, I made a script that creates full-day animations of the webcams in the Great Smokies and visible satellite images from NOAA. What will it become? Consider it a visual archive of the atmosphere and movements of the Sun in the Great Smokies. Any suggestions are welcome.
Some notes for updates: I haven’t fully utilized the flash embedded video (see the two samples below, top is animated gif and below is embedded flash video). The problem is setting animations in sync together, e.g., sun rises at the same time in all movies. With an animated .gif, I think you simply need to refresh your browser after all of the images are loaded to get a partial sync. A better solution is out there. I can also increase the sampling rate for smoother play; now it’s two samples an hour.

Weather map and webcam animation for the Great Smokies
[flv:http://www.outragegis.com/weather/img/animation/090603/PurchaseKnob.flv 400 290]
These are also archived, so if you go to the smokies for a backcountry trip, you’ll be able to find your days here.
Rainy May: on track to be the wettest May ever
May 8, 2009 by
Spring is typically a wet month. However over the past week, Eastern Kentucky has experienced unusual rainfall amounts. The record for the month is 10.78 inches in 2004; and no other year has been above 10 inches for May. The only year that saw over 9 inches of rainfall for May was in 1995. May during 1983 and 1984 were the only times over 7 inches of rainfall.
From the National Weather Service in Jackson, Kentucky:
"2 TO 5 INCHES OF RAIN HAS FALLEN ACROSS EASTERN KENTUCKY DURING THE
MONTH OF MAY. THIS IS OF INTEREST...SINCE WE ARE ONLY ABOUT ONE
QUARTER OF THE WAY THROUGH THE MONTH. HEAVY RAINFALL IS VERY
POSSIBLE AS WE HEAD INTO MOTHERS DAY WEEKEND AND COULD PUSH RAINFALL
AMOUNTS UP ANOTHER INCH OR TWO.

THE AVERAGE PRECIPITATION FOR THE MONTH OF MAY AT THE JACKSON
WEATHER OFFICE IS 4.92 INCHES. WE HAVE ALL READY RECORDED 4.12
INCHES OF RAINFALL AS OF THIS MORNING AT 7AM. IT IS TOO EARLY TO TELL
...BUT WE ARE CERTAINLY ON TRACK TO HAVE ONE OF THE RAINIEST MAYS
EVER. THE RAINIEST MAY OCCURRED IN 2004 WHEN THE JACKSON WEATHER
OFFICE RECORDED 10.78 INCHES FOR THE MONTH. THIS WAS THE ONLY MONTH
OF MAY THAT OVER TEN INCHES OF RAIN FELL. MAY OF 1995 HAD 9.91
INCHES AND WAS THE ONLY MONTH WITH OVER 9 INCHES RECORDED. THE NEXT
HIGHEST TOTALS WERE OVER 7 INCHES AND THAT OCCURRED IN ONLY TWO
YEARS...1983 AND 1984.

HERE ARE RAINFALL TOTALS FROM EASTERN KENTUCKY COOPERATIVE WEATHER
STATIONS AND AUTOMATED SURFACE OBSERVING SYSTEMS AS OF 7 AM
EDT...FOR THE MONTH OF MAY 2009.
LOCATIONÂ Â Â Â Â Â Â Â /Â Â COUNTYÂ Â Â Â /Â Â Â Â PRECIPITATION
BARBOURVILLEÂ Â Â Â Â Â Â Â KNOXÂ Â Â Â Â Â Â Â Â Â Â Â Â 4.38Â INCHES BAXTERÂ Â Â Â Â Â Â Â Â Â Â Â Â Â HARLANÂ Â Â Â Â Â Â Â Â Â Â 3.85Â INCHES BEATTYVILLE 4NÂ Â Â Â Â Â LEEÂ Â Â Â Â Â Â Â Â Â Â Â Â Â 3.68Â INCHES BIG SHELBYÂ Â Â Â Â Â Â Â Â Â PIKEÂ Â Â Â Â Â Â Â Â Â Â Â Â 3.01Â INCHES BOONEVILLE 1SEÂ Â Â Â Â Â OWSLEYÂ Â Â Â Â Â Â Â Â Â Â 4.49Â INCHES BUCKHORN LAKEÂ Â Â Â Â Â Â PERRYÂ Â Â Â Â Â Â Â Â Â Â Â 2.80Â INCHES CARR CREEK LAKEÂ Â Â Â Â KNOTTÂ Â Â Â Â Â Â Â Â Â Â Â 2.73Â INCHES CAVE RUN LAKEÂ Â Â Â Â Â Â ROWANÂ Â Â Â Â Â Â Â Â Â Â Â 2.28Â INCHES CLAY CITY 1WNWÂ Â Â Â Â Â POWELLÂ Â Â Â Â Â Â Â Â Â Â 2.77Â INCHES CLOSPLINT 4ESEÂ Â Â Â Â Â HARLANÂ Â Â Â Â Â Â Â Â Â Â 4.55Â INCHES COLOÂ Â Â Â Â Â Â Â Â Â Â Â Â Â Â Â PULASKIÂ Â Â Â Â Â Â Â Â Â 3.98Â INCHES CRESSYÂ Â Â Â Â Â Â Â Â Â Â Â Â Â ESTILLÂ Â Â Â Â Â Â Â Â Â Â 2.59Â INCHES DRAFFINÂ Â Â Â Â Â Â Â Â Â Â Â Â PIKEÂ Â Â Â Â Â Â Â Â Â Â Â Â 3.54Â INCHES EZELÂ Â Â Â Â Â Â Â Â Â Â Â Â Â Â Â MORGANÂ Â Â Â Â Â Â Â Â Â Â 3.31Â INCHES GIMLETÂ Â Â Â Â Â Â Â Â Â Â Â Â Â ELLIOTTÂ Â Â Â Â Â Â Â Â Â 2.60Â INCHES HARLAN 1SÂ Â Â Â Â Â Â Â Â Â Â HARLANÂ Â Â Â Â Â Â Â Â Â Â 3.80Â INCHES HARLAN STATE POLICEÂ HARLANÂ Â Â Â Â Â Â Â Â Â Â 2.95Â INCHES HAZARD WATERÂ Â Â Â Â Â Â Â PERRYÂ Â Â Â Â Â Â Â Â Â Â Â 3.71Â INCHES HAZARDÂ Â Â Â Â Â Â Â Â Â Â Â Â Â PERRYÂ Â Â Â Â Â Â Â Â Â Â Â 3.70Â INCHES HAZARD STATE POLICEÂ PERRYÂ Â Â Â Â Â Â Â Â Â Â Â 2.95Â INCHES HEIDELBERG 2NÂ Â Â Â Â Â Â LEEÂ Â Â Â Â Â Â Â Â Â Â Â Â Â 4.05Â INCHES BAXTERÂ Â Â Â Â Â Â Â Â Â Â Â Â Â HARLANÂ Â Â Â Â Â Â Â Â Â Â 3.85Â INCHES INEZ 2EÂ Â Â Â Â Â Â Â Â Â Â Â Â MARTINÂ Â Â Â Â Â Â Â Â Â Â 3.78Â INCHES ISLAND CITYÂ Â Â Â Â Â Â Â Â OWSLEYÂ Â Â Â Â Â Â Â Â Â Â 5.16Â INCHES IVELÂ Â Â Â Â Â Â Â Â Â Â Â Â Â Â Â FLOYDÂ Â Â Â Â Â Â Â Â Â Â Â 2.27Â INCHES NWS JACKSONÂ Â Â Â Â Â Â Â Â BREATHITTÂ Â Â Â Â Â Â Â 4.12Â INCHES JEREMIAH 1SÂ Â Â Â Â Â Â Â Â LETCHERÂ Â Â Â Â Â Â Â Â Â 3.11Â INCHES KINGDOM COME ST PARK HARLANÂ Â Â Â Â Â Â Â Â Â Â 3.12Â INCHES LONDON CORBIN APTÂ Â Â LAURELÂ Â Â Â Â Â Â Â Â Â Â 4.46Â INCHES MONTICELLO 3NEÂ Â Â Â Â Â WAYNEÂ Â Â Â Â Â Â Â Â Â Â Â 4.00Â INCHES MOUNT STERLING 5NÂ Â Â MONTGOMERYÂ Â Â Â Â Â Â 2.41Â INCHES MOUNT VERNONÂ Â Â Â Â Â Â Â ROCKCASTLEÂ Â Â Â Â Â Â 2.77Â INCHES ONEIDAÂ Â Â Â Â Â Â Â Â Â Â Â Â Â CLAYÂ Â Â Â Â Â Â Â Â Â Â Â Â 4.54Â INCHES PAINTSVILLE 1EÂ Â Â Â Â Â JOHNSONÂ Â Â Â Â Â Â Â Â Â 3.55Â INCHES PIKEVILLE ST POLICEÂ PIKEÂ Â Â Â Â Â Â Â Â Â Â Â Â 2.05Â INCHES PRESTONSBURG 3NWÂ Â Â Â FLOYDÂ Â Â Â Â Â Â Â Â Â Â Â 4.09Â INCHES QUICKSANDÂ Â Â Â Â Â Â Â Â Â Â BREATHITTÂ Â Â Â Â Â Â Â 3.52Â INCHES RELIEFÂ Â Â Â Â Â Â Â Â Â Â Â Â Â MORGANÂ Â Â Â Â Â Â Â Â Â Â 3.18Â INCHES ROGERSÂ Â Â Â Â Â Â Â Â Â Â Â Â Â WOLFEÂ Â Â Â Â Â Â Â Â Â Â Â 2.82Â INCHES SALYERSVILLEÂ Â Â Â Â Â Â Â MAGOFFINÂ Â Â Â Â Â Â Â Â 4.28Â INCHES SANDY HOOKÂ Â Â Â Â Â Â Â Â Â ELLIOTTÂ Â Â Â Â Â Â Â Â Â 2.67Â INCHES SKYLINEÂ Â Â Â Â Â Â Â Â Â Â Â Â LETCHERÂ Â Â Â Â Â Â Â Â Â 3.20Â INCHES SLADE 5NEÂ Â Â Â Â Â Â Â Â Â Â POWELLÂ Â Â Â Â Â Â Â Â Â Â 2.86Â INCHES SOMERSET 2NÂ Â Â Â Â Â Â Â Â PULASKIÂ Â Â Â Â Â Â Â Â Â 3.74Â INCHES STANTON 2WÂ Â Â Â Â Â Â Â Â Â POWELLÂ Â Â Â Â Â Â Â Â Â Â 2.88Â INCHES STEARNS 2SÂ Â Â Â Â Â Â Â Â Â MCCREARYÂ Â Â Â Â Â Â Â Â 5.09Â INCHES VICTORY 5NWÂ Â Â Â Â Â Â Â Â LAURELÂ Â Â Â Â Â Â Â Â Â Â 4.13Â INCHES WEST LIBERTY 3NWÂ Â Â Â MORGANÂ Â Â Â Â Â Â Â Â Â Â 2.67Â INCHES WEST LIBERTY 11NWÂ Â Â MORGANÂ Â Â Â Â Â Â Â Â Â Â 2.57Â INCHES WHITESBURGÂ Â Â Â Â Â Â Â Â Â LETCHERÂ Â Â Â Â Â Â Â Â Â 2.50Â INCHES WHITESBURG 2SEÂ Â Â Â Â Â LETCHERÂ Â Â Â Â Â Â Â Â Â 3.21Â INCHES WILLIAMSBURG 1NWÂ Â Â Â WHITLEYÂ Â Â Â Â Â Â Â Â Â 5.14Â INCHES
THE NATIONAL WEATHER SERVICE AT JACKSON WOULD LIKE TO THANK ALL THE
DEDICATED COOPERATIVE WEATHER OBSERVERS FOR THEIR TIMELY REPORTS."
It is all about Light: a photographers dream
April 20, 2009 by Leave a Comment
The past day’s weather has included periods intense light and shadow from very low, broken stratus & cumulus clouds. Rays of love from god shine from heaven through parted clouds; and there was plenty of love in the mountains. Even in these low quality webcam images, you can see golden rays of light and clearly defined ridges. Now what if you were there with a serious camera.
Though the weather overall has been chilly and uncomfortable, it does give some memorable vistas. The more diffuse stratus clouds in the western mountains were lower in altitude and created softer light.

View from Purchase Knob
A Tale of Two Smokies
April 15, 2009 by
 April 15, 2009. We see two very different Smokies today and the highest peaks in the southern Appalachians provide an atmospheric boundary.
On the west side of the mountains we see low dense stratus clouds, but on the east side we have clear skies. As the atmosphere is uplifted over the the highest ridge of mountains there’s cooling and abundant cloud formation. That’s half the story.
The winds are form the northwest and the Smokies (along the Tennessee/North Carolina stateline) provide the highest barrier the winds must cross over. On the leeward side, as the winds cross over the mountains, they descend, warm, and prevent cloud formation especially just east of the summits.
Link to more: http://pixel.outragegis.com/v/weather_maps/090415_TwoSmokies/
These images and animation show a textbook situation of topographic control of weather, but over a very large area.


