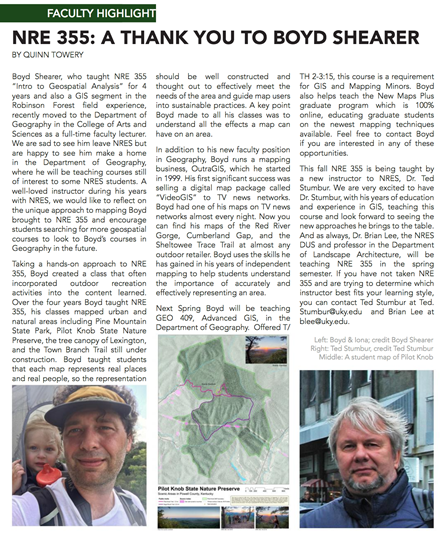
Thanks to students and crew in the University of Kentucky’s Natural Resources and Environmental Science (NRES) for this article in their Fall 2018 Newsletter.
A collection of projects that were developed for class labs or were part of a collaborative assignment.
Thanks to students and crew in the University of Kentucky’s Natural Resources and Environmental Science (NRES) for this article in their Fall 2018 Newsletter.
![]() I am happy and proud to announce that I have accepted a faculty appointment as Lecturer in the University of Kentucky Department of Geography. Since 2008 I have been teaching in the department as an adjunct. With a potential move to the University of Wisconson Madison to teach GIS, I reflected on the possibilities of focusing on Kentucky and decided to stay in the Bluegrass.
I am happy and proud to announce that I have accepted a faculty appointment as Lecturer in the University of Kentucky Department of Geography. Since 2008 I have been teaching in the department as an adjunct. With a potential move to the University of Wisconson Madison to teach GIS, I reflected on the possibilities of focusing on Kentucky and decided to stay in the Bluegrass. ![]() My current teaching assignment spans open source and ArcGIS mapping platforms in both the traditional classroom and through online courses in New Maps Plus. Learn more about the opportunities and successes in mapping at the University of Kentucky and consider getting a Masters in Mapping or a graduate certificate in open source mapping.
My current teaching assignment spans open source and ArcGIS mapping platforms in both the traditional classroom and through online courses in New Maps Plus. Learn more about the opportunities and successes in mapping at the University of Kentucky and consider getting a Masters in Mapping or a graduate certificate in open source mapping.
How will this impact outrageGIS mapping? Not much. The topographic map shop will continue as normal and I will still explore and make unique maps and data for Kentucky and surrounding areas. The main change will be a deprioritizing client work in favor of university projects. For example, this year is the 75th Anniversary of the Department of Geography and is a priority project. outrageGIS mapping will also support the department’s Pauer Center for Cartography, so if you need a custom map we can make through the Center.
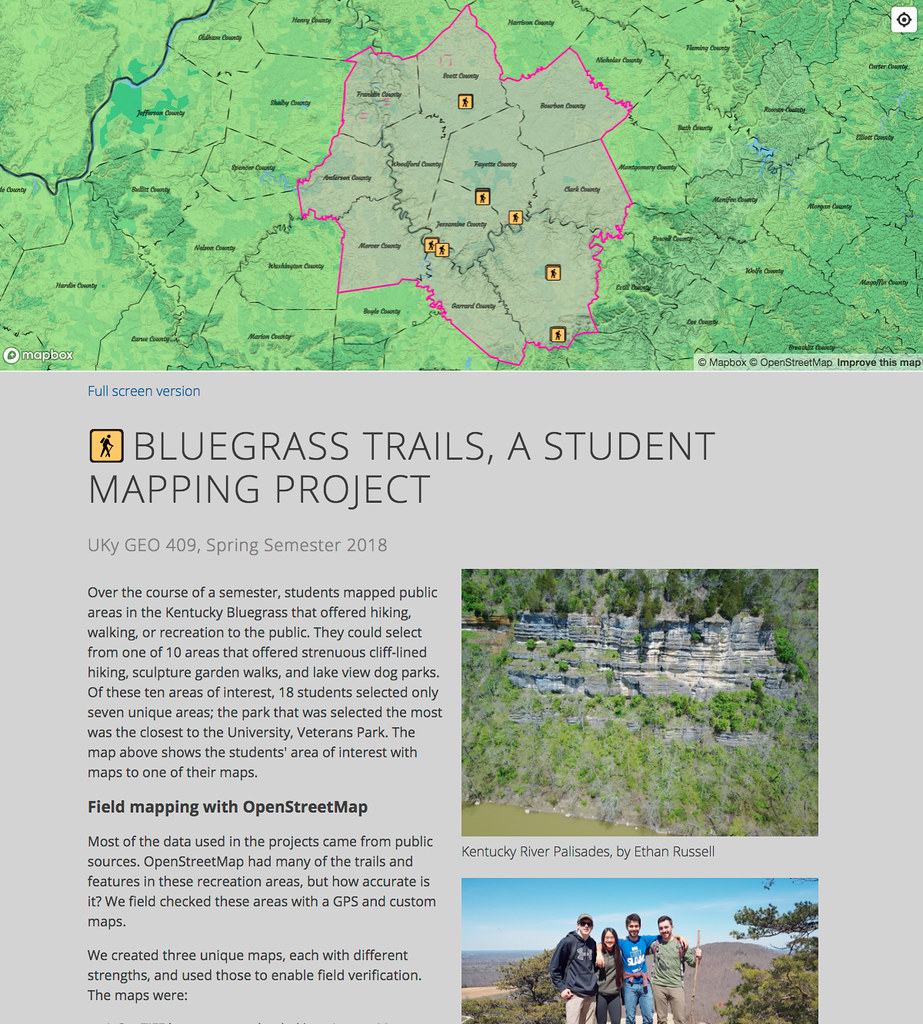
Over the course of the spring 2018 semester, UKy Geography students mapped public areas in the Kentucky Bluegrass that offered hiking, walking, or recreation to the public. They could select from one of 10 areas that offered strenuous cliff-lined hiking, sculpture garden walks, or lake-view dog parks.
Web page for student maps
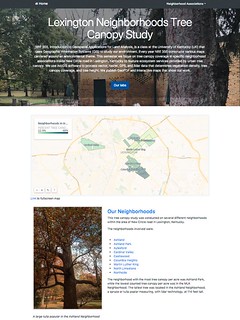
NRE 355, Introduction to Geospatial Applications for Land Analysis, is a class at the University of Kentucky (UK) that uses Geographic Information Systems (GIS) to study our environment. Every year NRE 355 constructs various maps centered around an environmental theme. Past themes have included Pilot Knob State Nature Preserve and Pine Mountain, both in Kentucky.
This semester our class focused on tree canopy coverage in specific neighborhood associations inside New Circle Road in Lexington, Kentucky to feature ecosystem services provided by urban tree canopy. We use ArcGIS software to process vector, raster, GPS, and lidar data that determines vegetation density, tree canopy coverage, and tree height. We publish GeoPDF and interactive maps that show our work.
This tree canopy study was conducted in several different neighborhoods within the area of New Circle Road in Lexington, Kentucky.
The neighborhoods involved were:
The neighborhood with the most tree canopy per acre was Ashland Park, while the lowest counted tree canopy per acre was in the MLK Neighborhood. The tallest tree was located in the Ashland Neighborhood, a spruce or tulip poplar measuring, with lidar technology, at 114 feet tall.
Visit the website: https://rvirto01.github.io/NRE355_Tree_canopy_study/
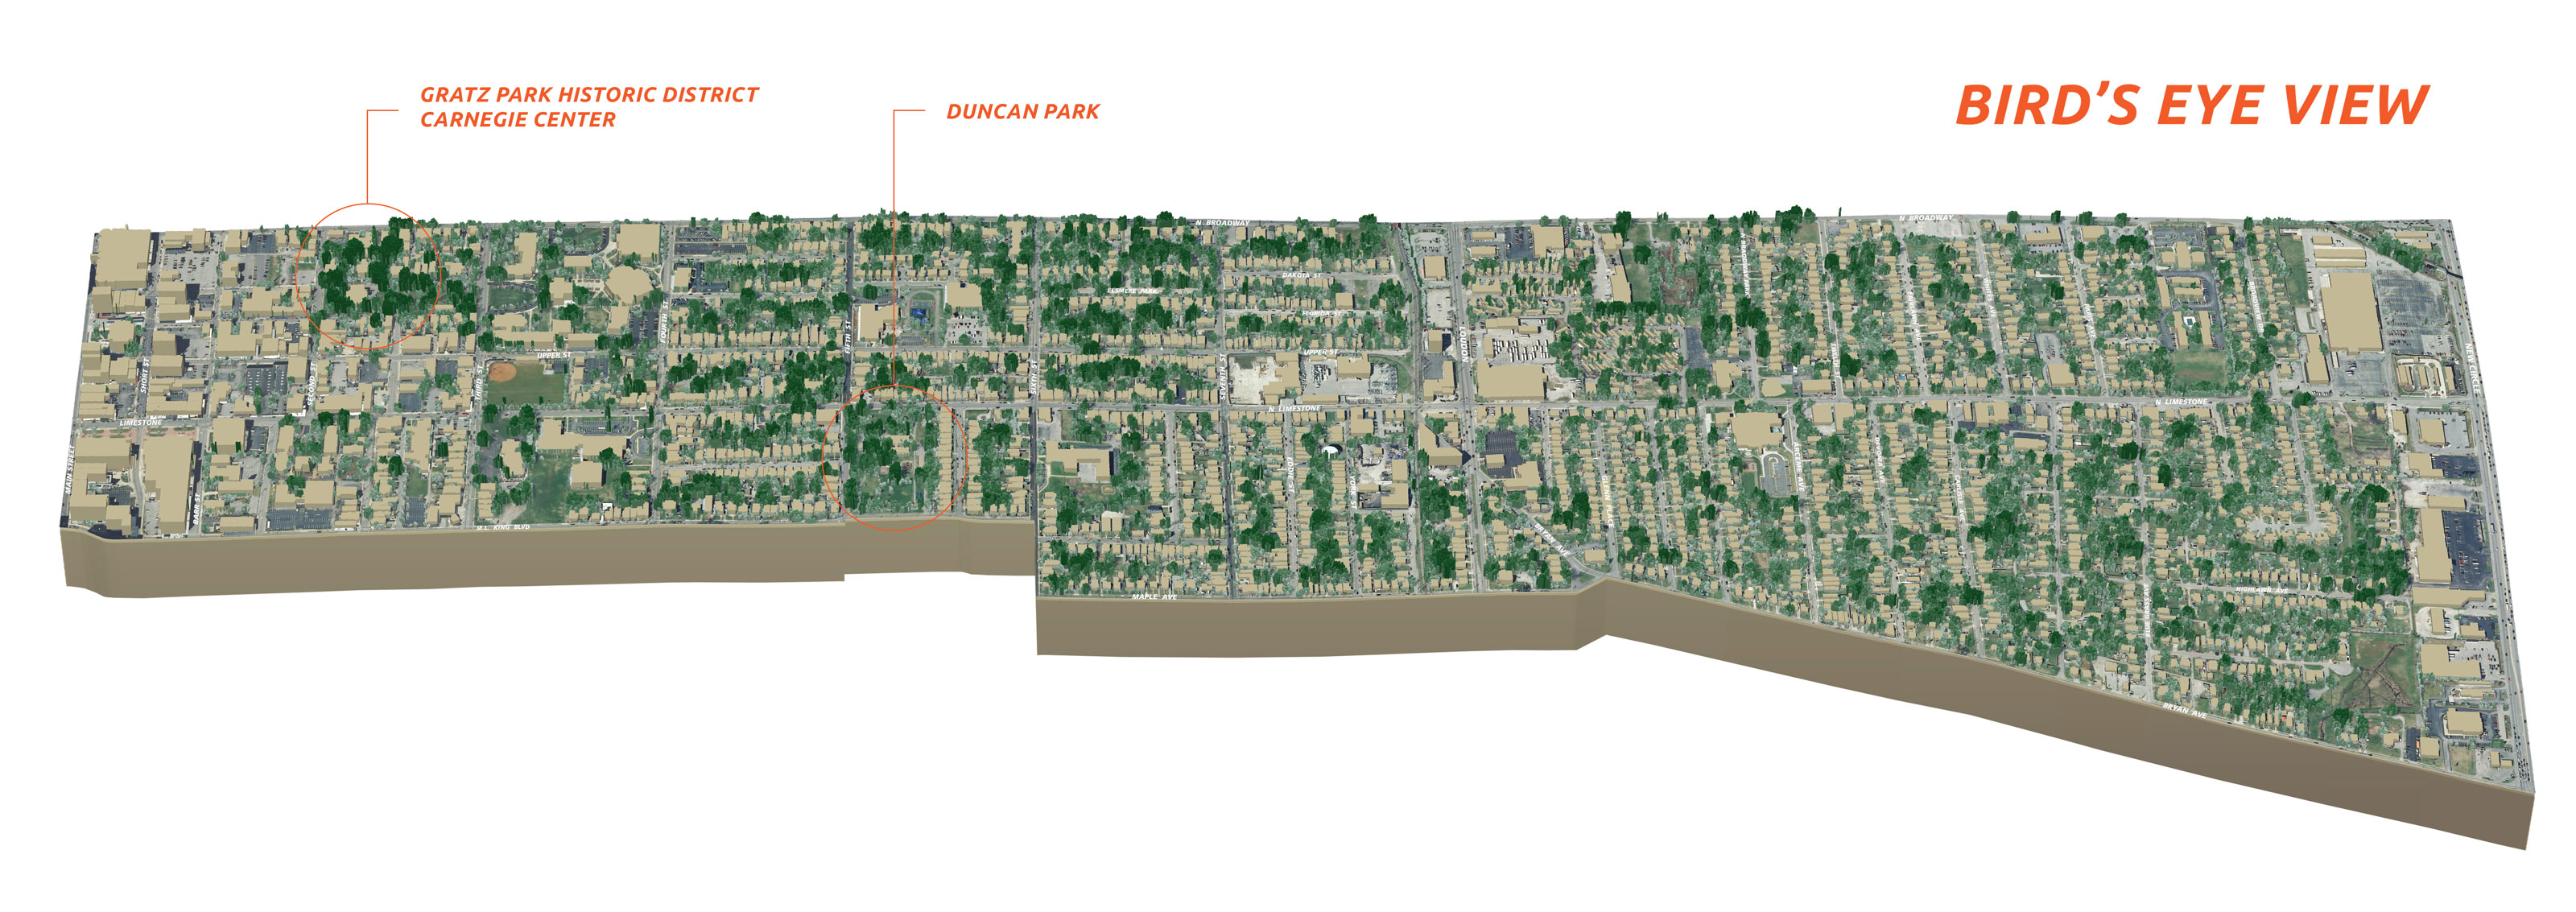
Bird’s eye view of the North Limestone Neighborhood Association showing tree heights relative to building heights
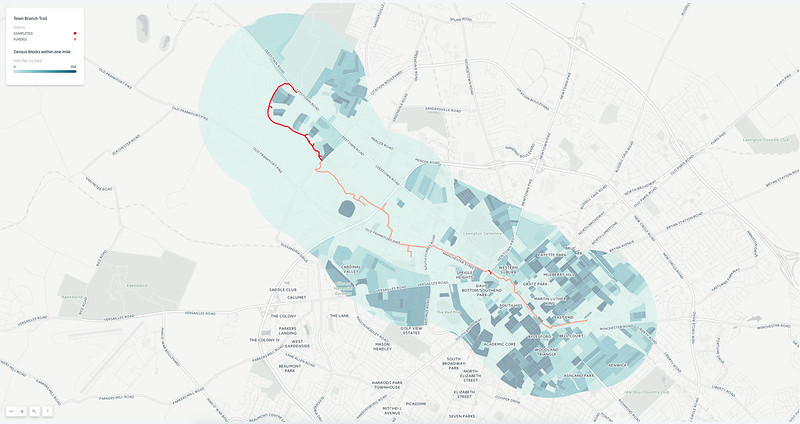
Town Branch Trail in maps
Students create many maps and a website for the soon-to-be-built Town Branch Trail during the Spring 2017 semester in the GEO 409 (Advanced Topics in GIS) in the Department of Geography, University of Kentucky. We used mainly open source GIS software QGIS and GitHub to create and publish our maps.
We used mainly open source GIS software QGIS and GitHub to create and publish our maps. For the final project, students grouped into separate teams for web page production, field GPS and photography, story production, and 3D mapping.
An interactive map of the content produced for the final project can be found in the following map:
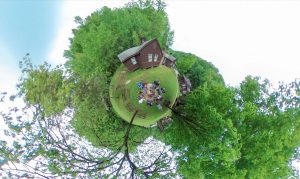
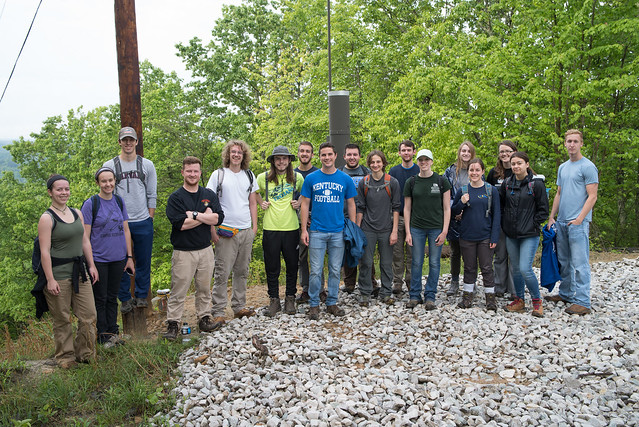
360 photography at camp
This is the third year teaching at the UK NRES (Natural Resources and Environmental Sciences) summer camp. This course was a one-day GPS and GIS exercise to map the interpretive trails around base camp. With seventeen undergraduates and their mobile devices, we split into two teams. One team focused on the trail network and GPS mapped trail alignment and intersections. A second team mapped points of interests and interpretive sites along the main hiking trail up to the fire tower.
We worked in the camp classroom with QGIS, the leading free and open source GIS software, to make all of our maps. We imported our GPS data as KML or GPX formatted text files, which we then edited in QGIS. We created a shaded relief base map from DEM data (using the Terrain plugin!) over which we laid the cleaned trail data. We finally exported a GeoTIFF which could be loaded on mobile devices and used to locate position without requiring a cellular data connection.
Link to interactive map (6 MB)
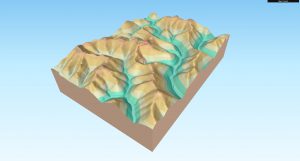
We also touched on how to make interactive 3D maps. QGIS offers one of the richest environments to experiment with GIS data. We introduced a plugin, qgis2threejs, that is perhaps the easiest method to make online 3d maps. Take a look!
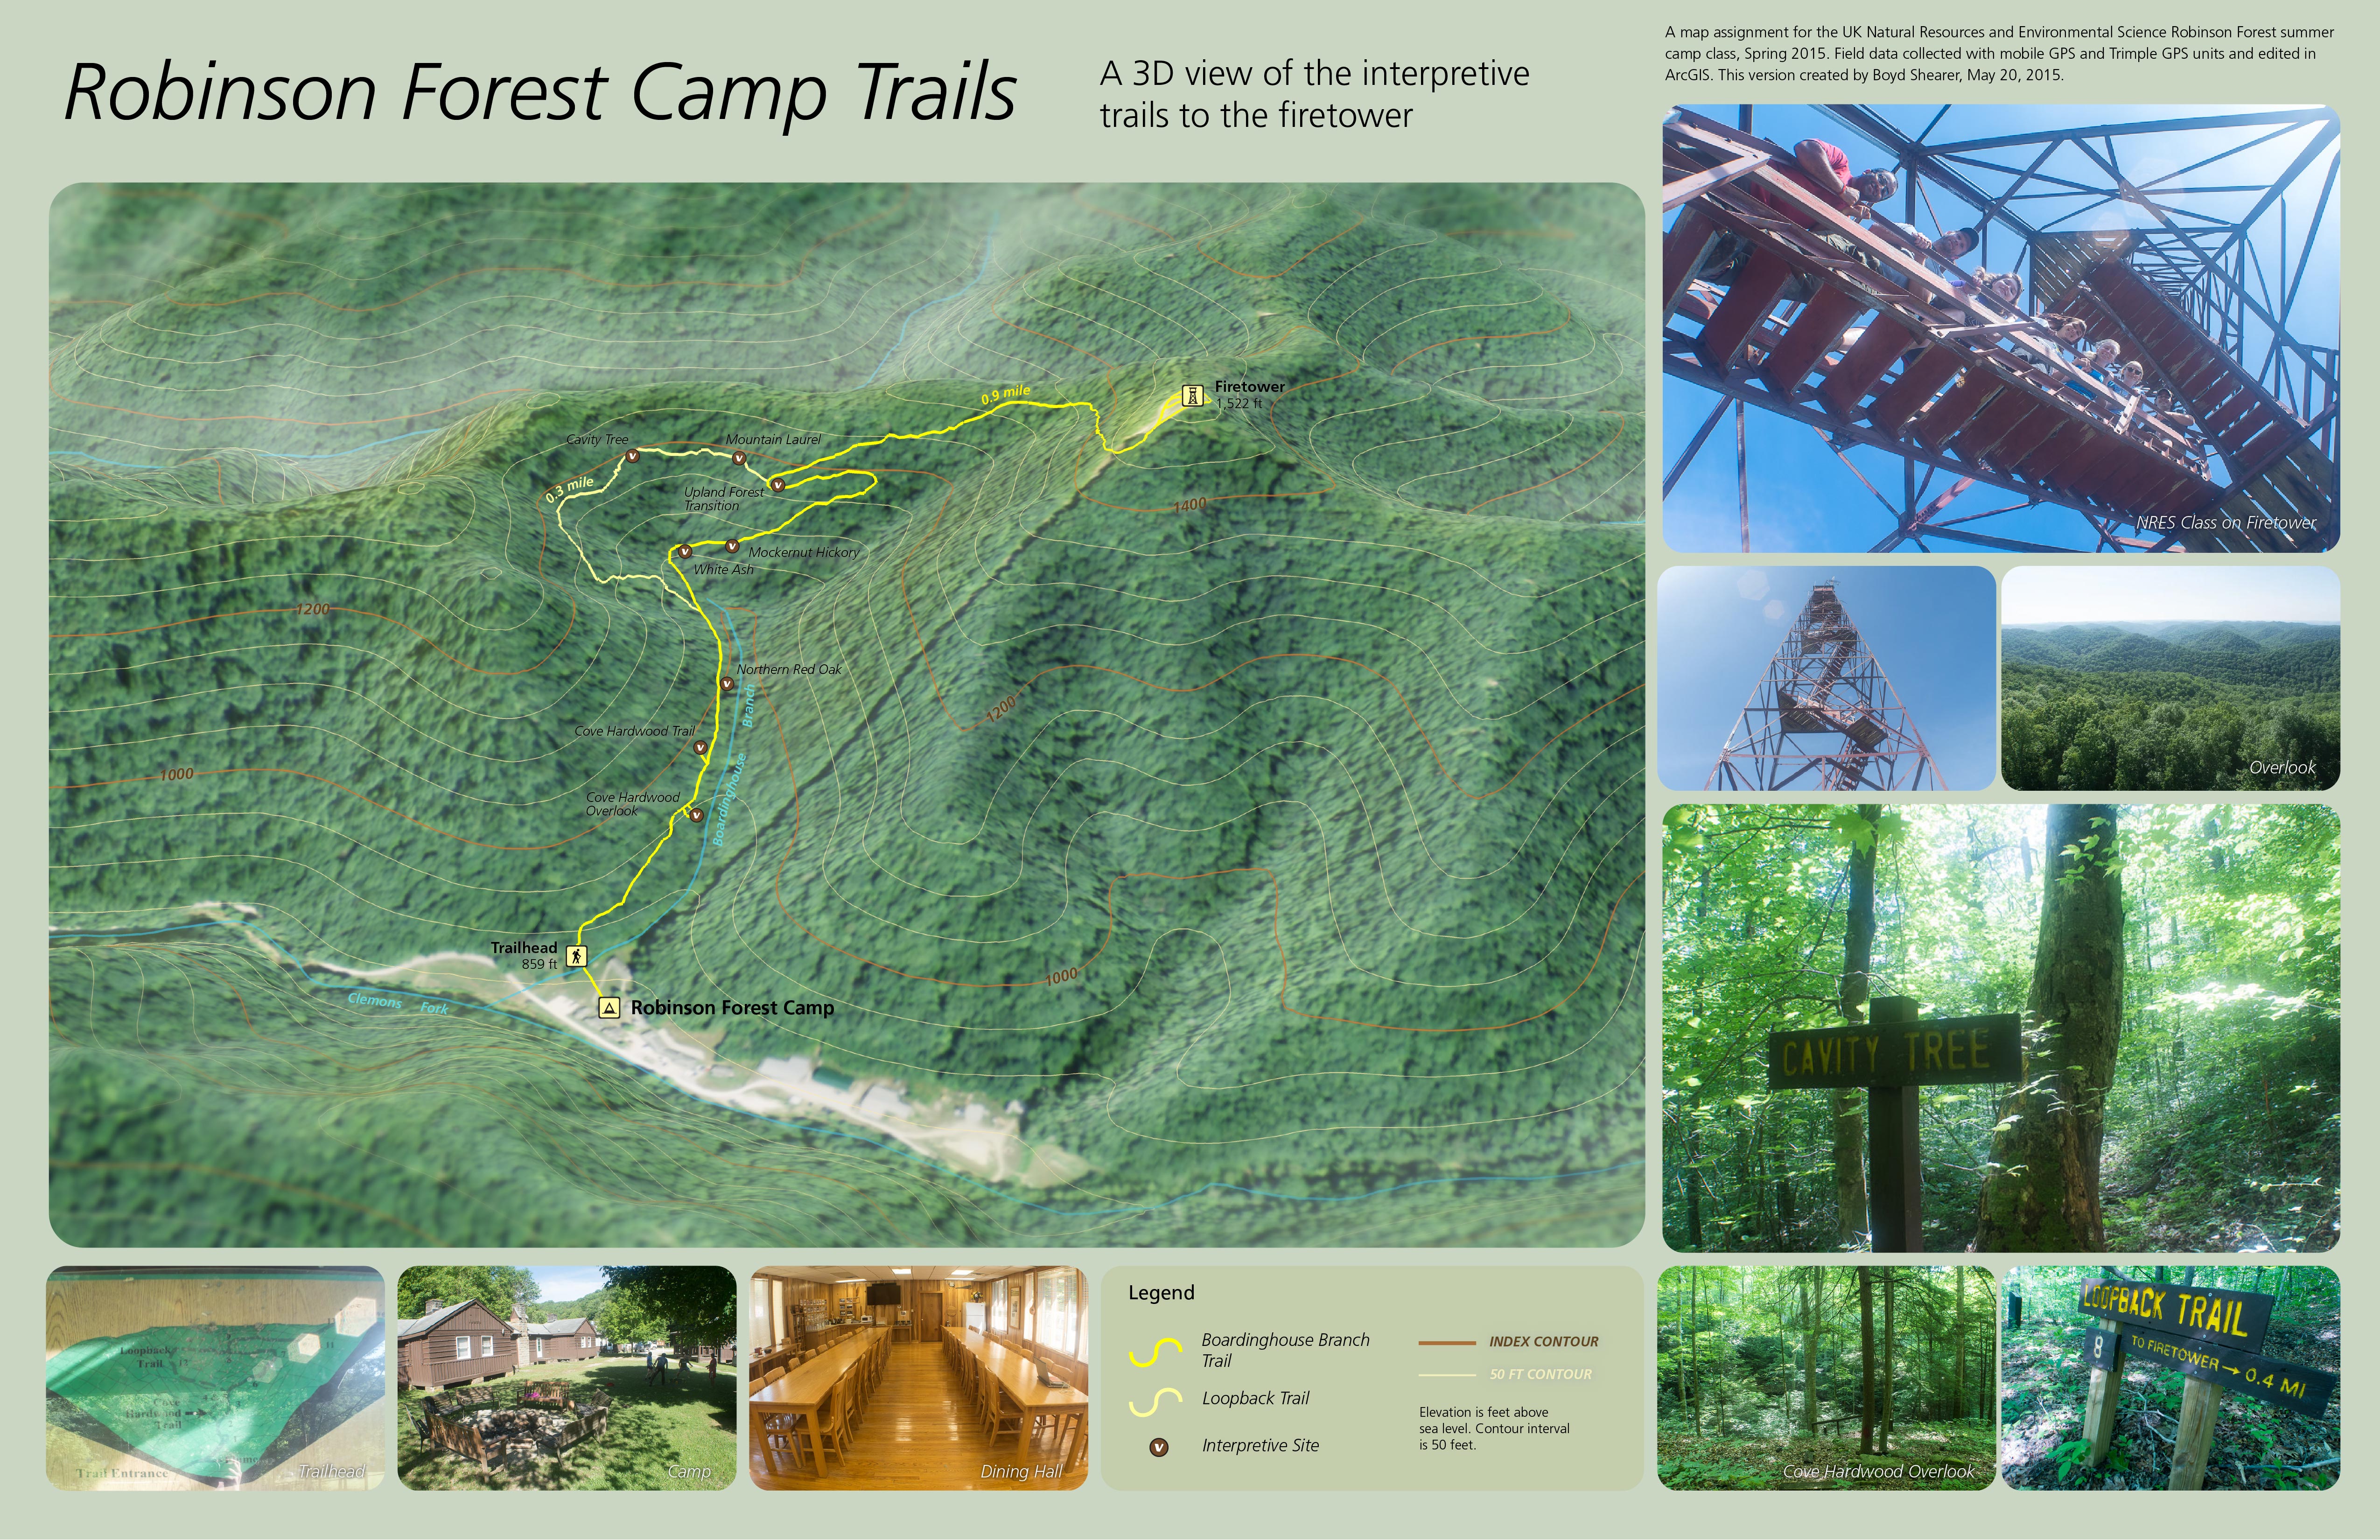
Robinson Forest Camp trail map
Last year, we GPS mapped the road to the fire tower. During the first year, we spent time making a static bird’s eye view of the main trail up to the fire tower. Since the first year, some students have asked about updating the map in the trailhead kiosk. It is a block diagram of the trail and its style is dated. This year, we discovered that theqgis2threejs QGIS plugin can make similar block diagrams. Maybe one year we can get one of these maps in the kiosk!
3D map with 2014 aerial photography (25 MB)
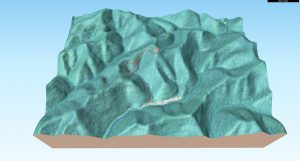
Students in NRE 355 (a GIS calass at the University of Kentucky Natural Resources and Environmental Sciences program) visited the 740-acre Pilot Knob State Nature Preserve on September 21, 2016, and used mobile devices to collect GPS data for the existing trail network. They mapped approximately 3.2 miles of trail then used ArcGIS and CARTO to measure the trails and create a 2D map and 3D visualizations of the nature preserve. Students then created websites to showcase their work.
http://sweb.uky.edu/~blshea1/nre355/pksnp contains maps, animations, and links to student pages.
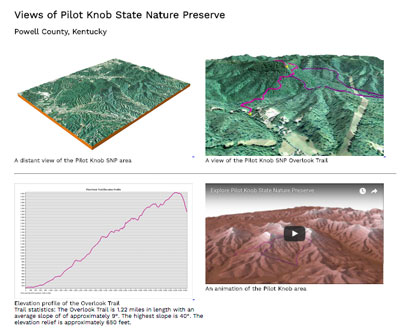
3D views and animations of Pilot Knob State Nature Preserve

Enlarge this graphic
It’s downtown Lexington, summer, and hot. Poor air quality and oppressive heat are hazards for older walkers and those with cranky babies. An interior (mostly air conditioned) pedway exists that connects various buildings downtown and is a walking convenience for many folks. When Lexington has more shady pedestrian paths away from city streets, walking inside wouldn’t be so inviting and necessary. [Read more…]

City of Rocks example visual
With the quality of elevation data increasing, especially with the availability of LiDAR data, we have an opportunity to make unique visuals. Recently Wolverine Publishing needed maps developed for the climbing area, City of Rocks in Idaho. The project needed high-resolution maps and the data was available through public sources. We like making the physiographic base maps for recreation areas and this offered a special challenge. [Read more…]
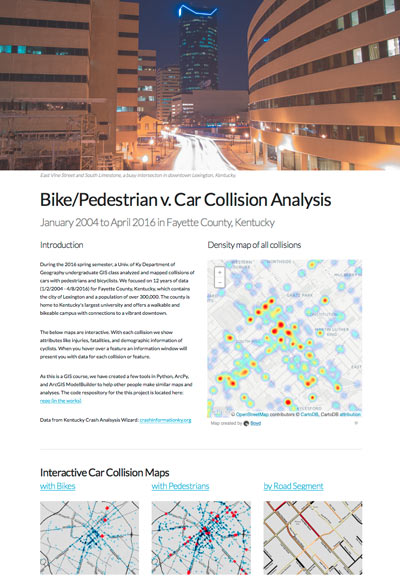
Website of collision maps
For a GIS course at the University of Kentucky Department of Geography (GEO 409), we mapped and analyzed the incidences of car collisions with pedestrians and bicyclists. Using data from Kentucky Crash Analysis Wizard (crashinformationky.org), we harvested collisions for Fayette County from January 2004 until April 8, 2016, the entire dataset at that point in time.Â
The website of collision maps is available here: http://boydx.github.io/collisions/ and the bike map is http://boydx.github.io/collisions/bikes

An exploration of canopy cover measures
How much tree canopy covers the urban service area of Lexington, Kentucky? Inspired by the Davey Resource Group’s October 2013 study of canopy cover using 2012 NAIP imagery within Lexington’s Urban Service Area, a GIS class at the University of Kentucky created a similar, though limited, evaluation. [Read more…]
Robinson Forest Camp trail map
As part of UK Natural Resources and Environmental Sciences 2015 Summer Camp, I taught a one-day GPS and GIS exercise to map the interpretive trails around base camp. With seven undergraduates and their mobile devices and one Trimble ProXRS, we split into three teams. One team focused on the trail network and GPS mapped trail alignment and intersections. A second team mapped interpretive sites on the left-side of trials, while a third-team mapped right-side features.
In the second-half of the day, we worked in the classroom and on laptops to make a map in ArcGIS. Some students had GIS software experience and helped their fellow classmates to make a map as a geospatial PDF and use on their mobile devices. A GeoPDF is a mobile map that doesn’t require a cellular data connection to function.
Map of basketball celebrations
During two weekends this spring, students in UK GEO 309 (Introduction to GIS) were asked to log celebrations associated with UK men’s basketball NCAA tournament around campus in selected zones. Student teams were then tasked to map and analyze these patterns of celebrations during the last week of class. Their maps and photographs are shown here.
Their topics include: locations of campus rental properties, noise pollution from major party locations, population density, and changes in social media engagement during and after games.Â
Elevation range in feet within an area 164-foot square
Sheltered coves and north-facing cliffs are hemlock habitats in Eastern Kentucky. This map shows range of elevation change within a 164-foot square area. Red areas indicate the highest relief, which are mountain slopes in the coal fields, and cliffs along the Pottsville Escarpment and Pine and Cumberland Mountains fault. Since most cliff is sandstone, areas indicated as cliffs would presumably have sandy soils, which is a condition for other evergreen species habitats, e.g., mountain laurel and rhododendron.
This is first-run test. Further analysis would include adding aspect, evergreen canopy cover, and soils to better refine predicting hemlock habitat.
A selected gallery of student final posters from GIS courses at the University of Kentucky. Classes include, FOR 330, NRE 355, and LA 355.
Mammoth Cave NP Acoustic Bat Survey, by Shelby Fulton

Kentucky’s Best Public Land Waterfowl Hunting Areas, by Zack Hackworth
Kentucky’s Oil Production in the Illinois Basin, by Clark Higgins
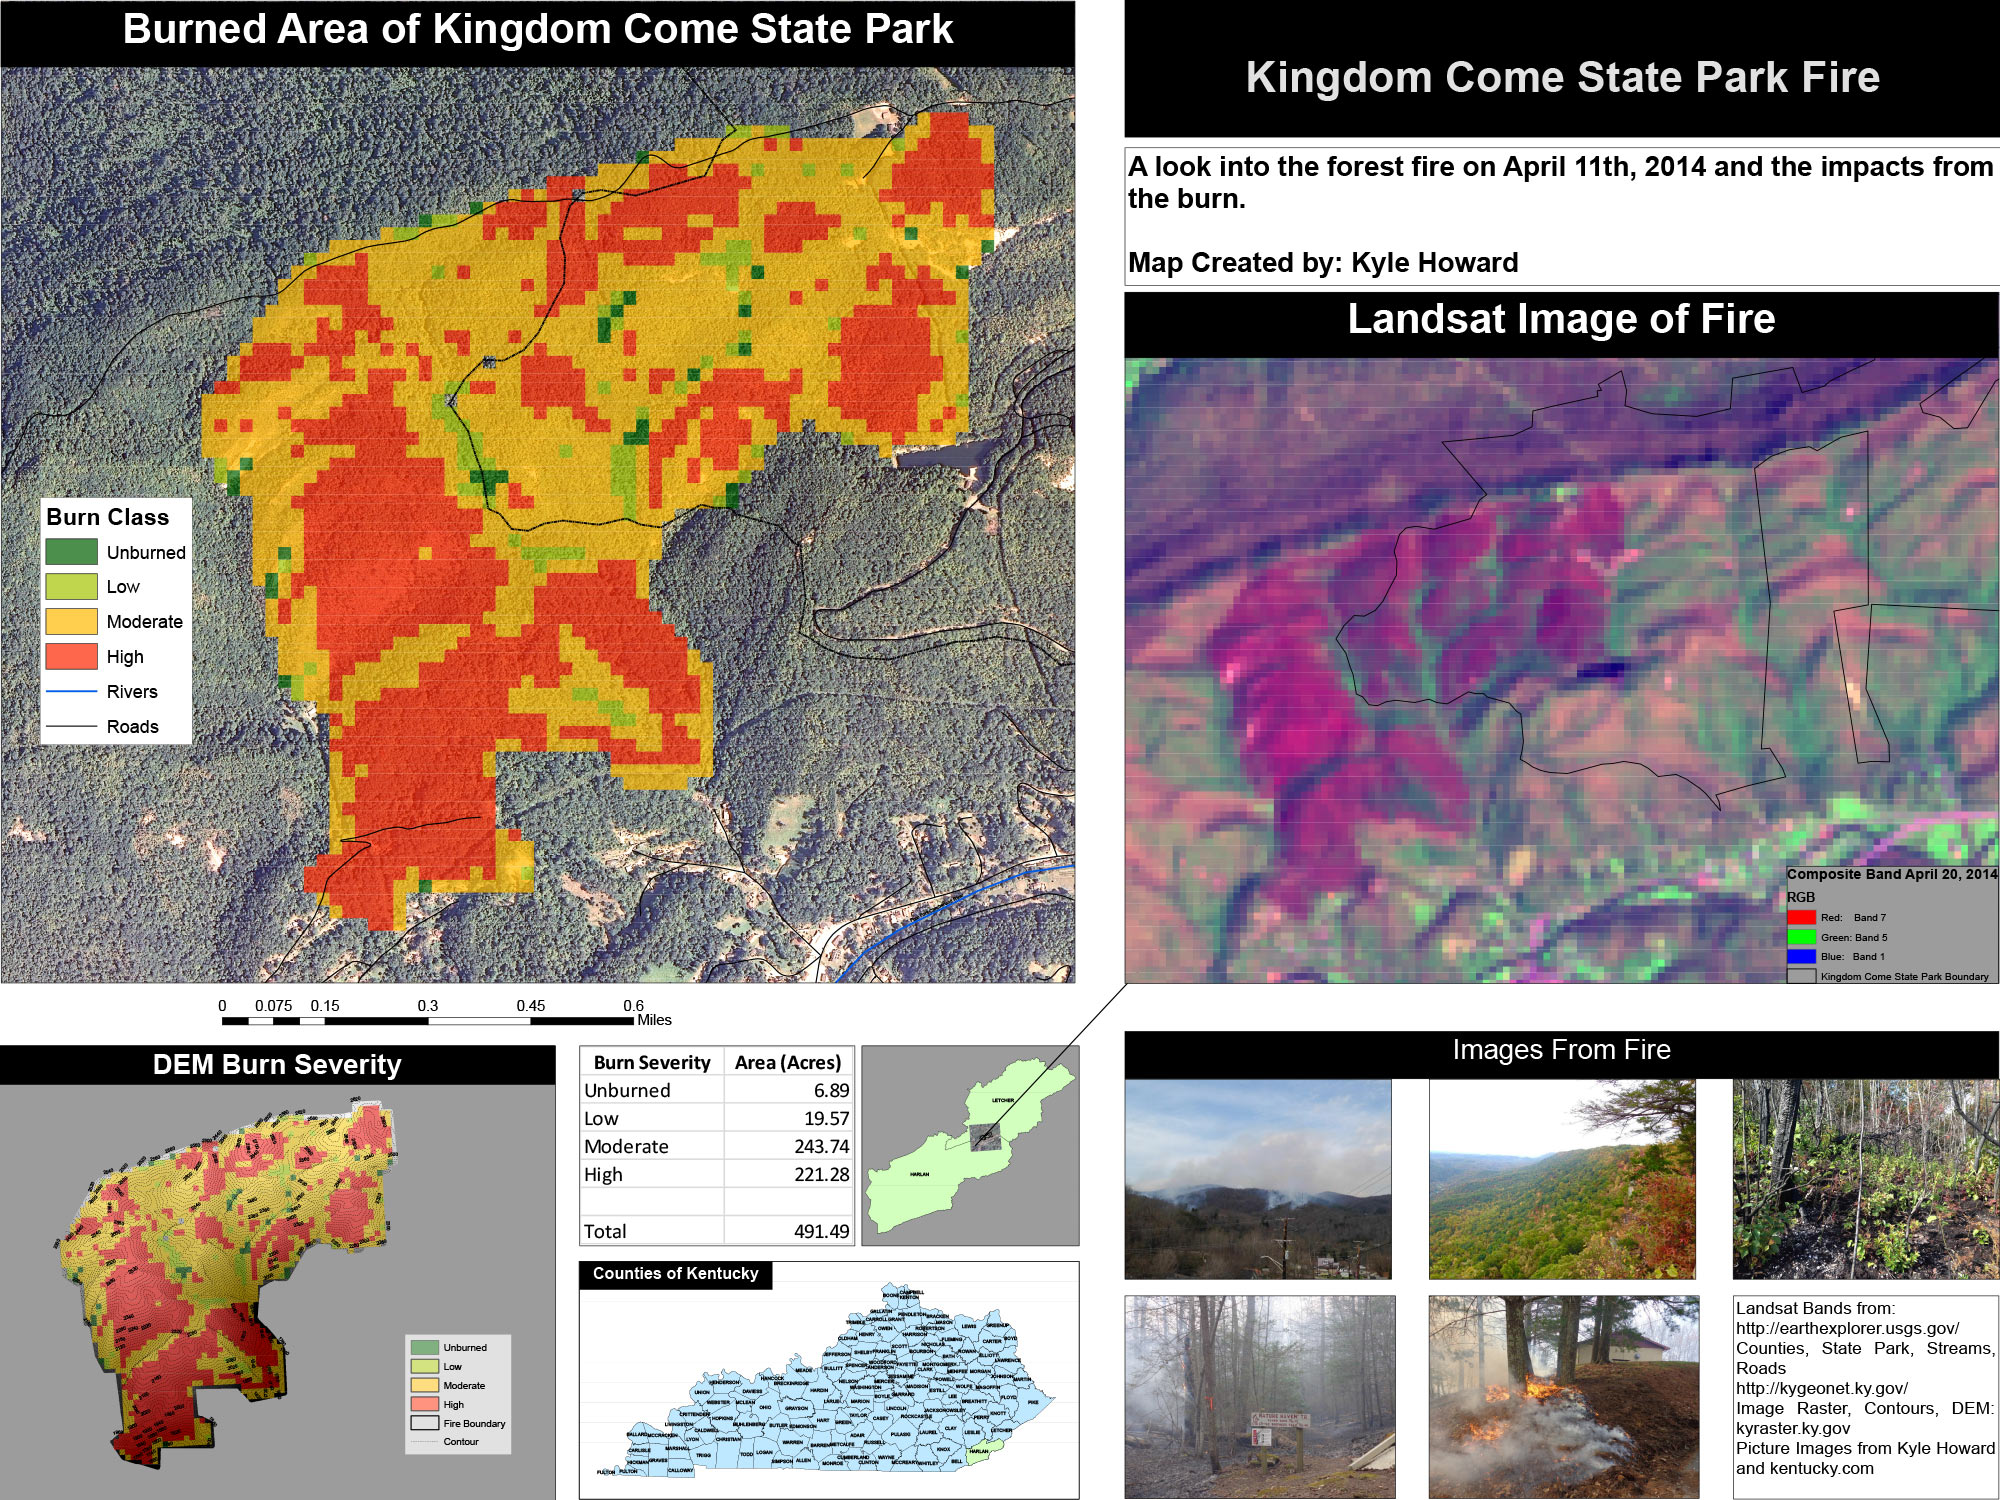
April, 2014 Kingdom Come State Park Wildfire Analysis, by Kyle Howard
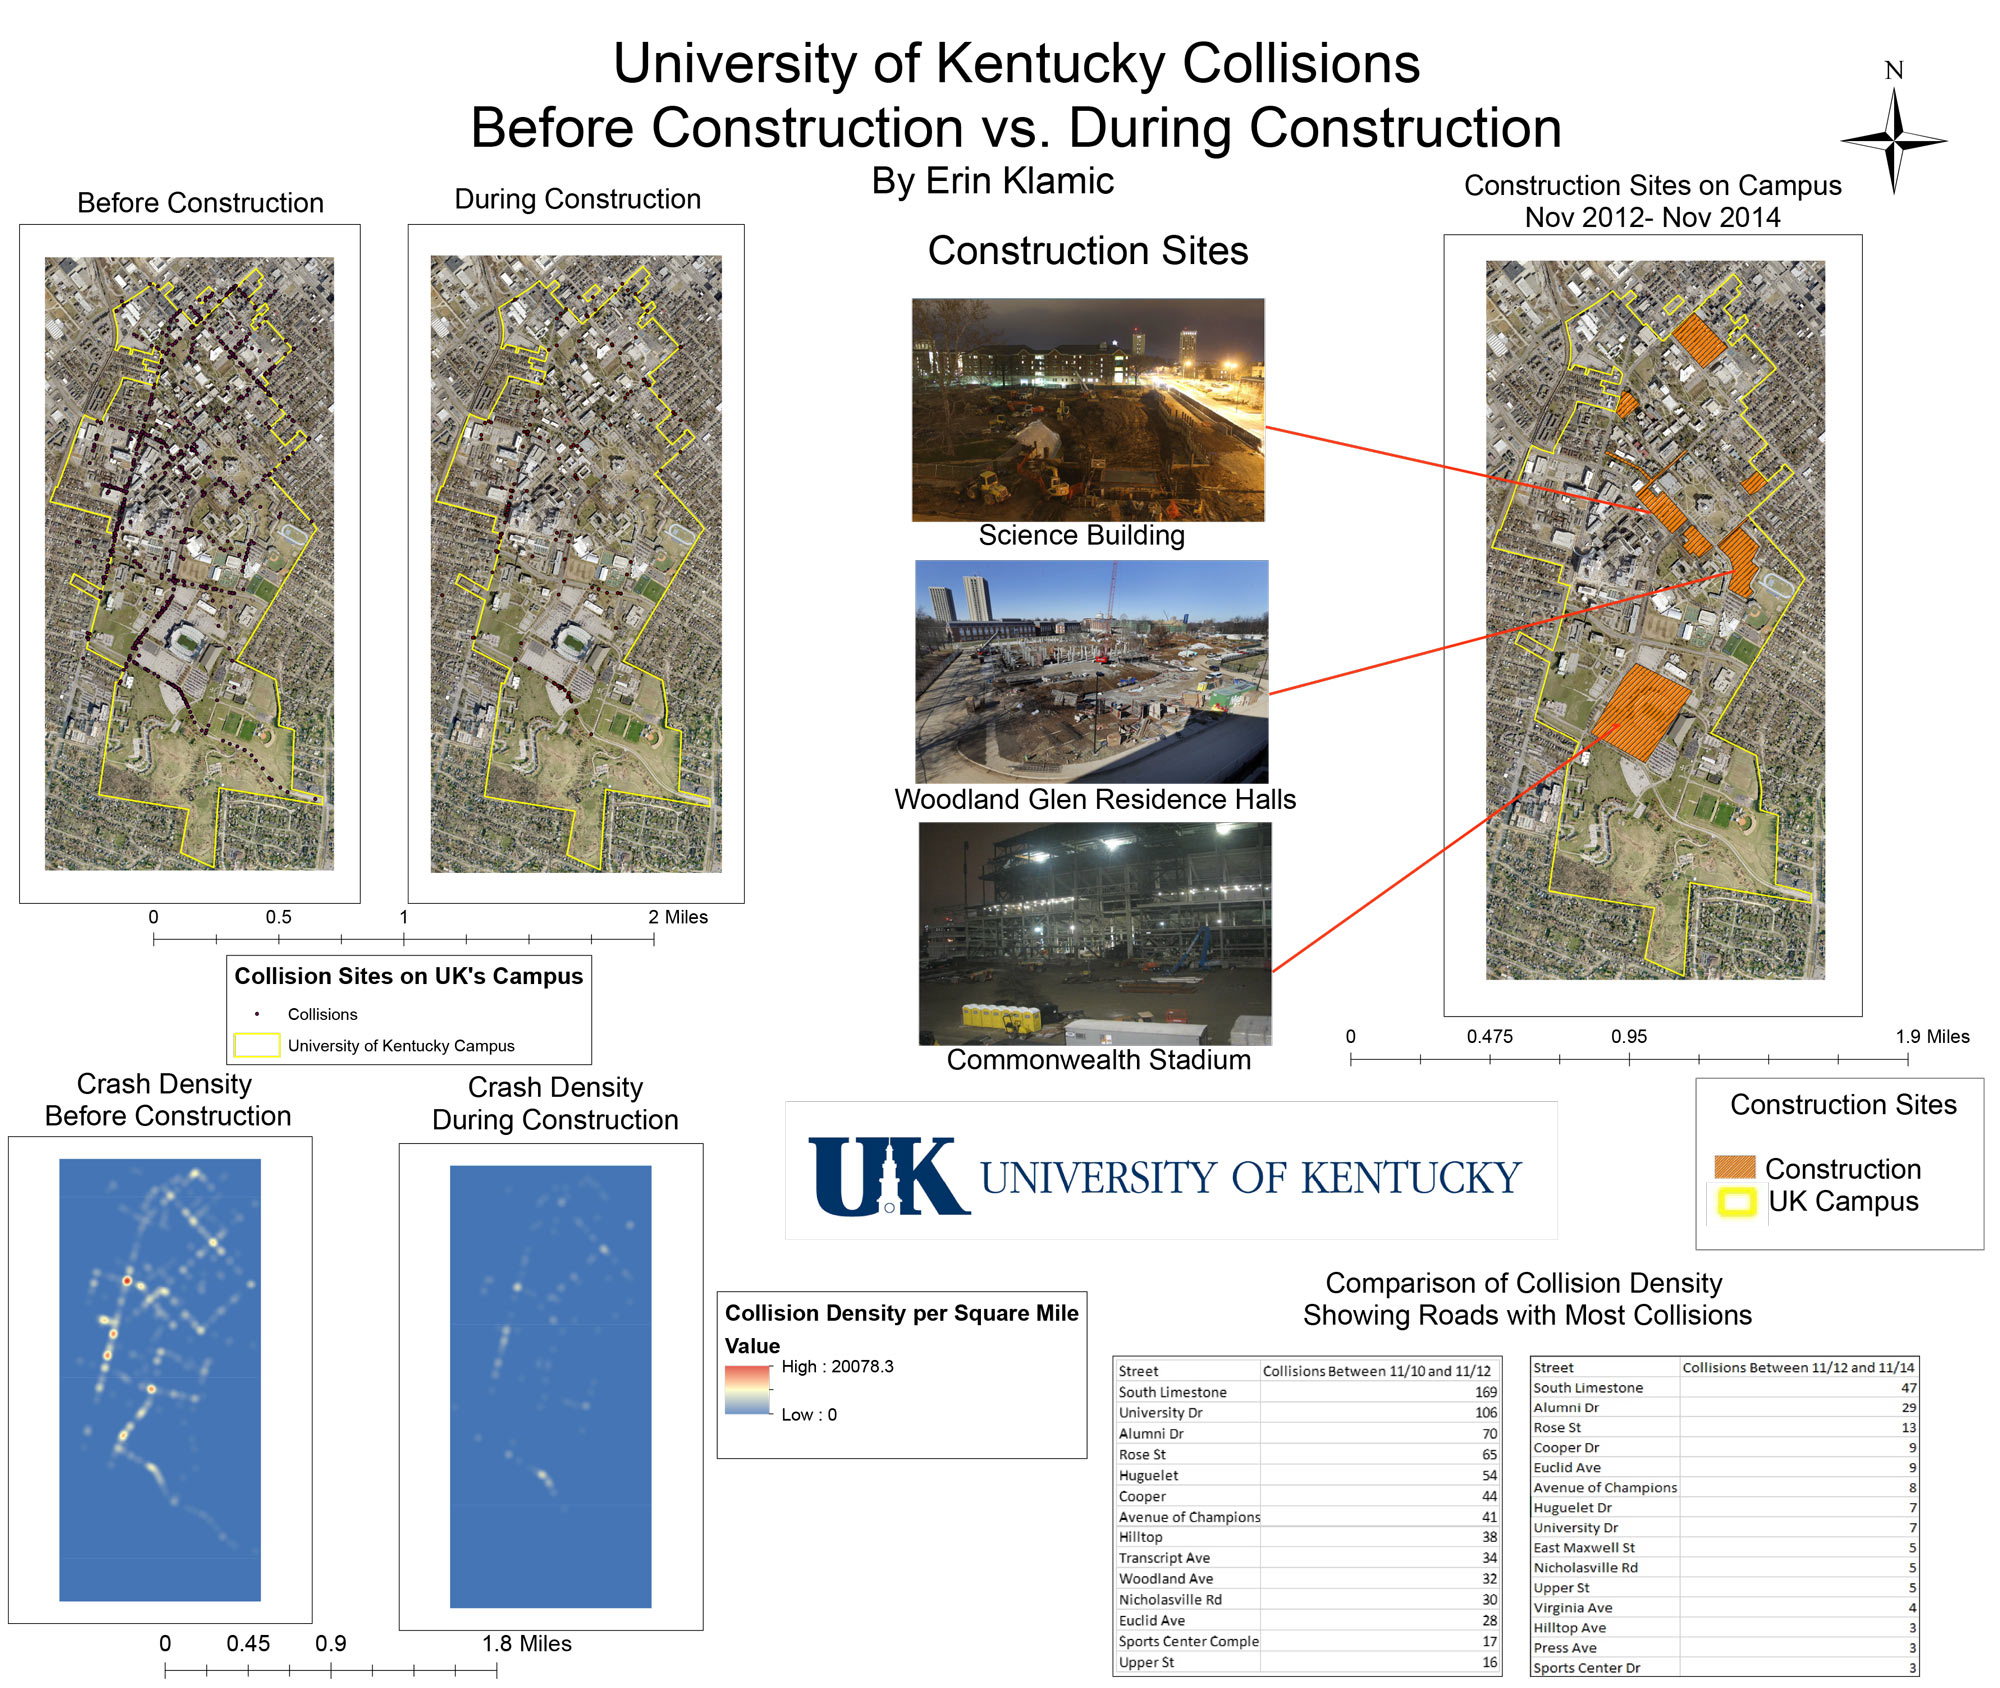
University of Kentucky Car Collision before and during Campus Contruction, by Erin Klamic
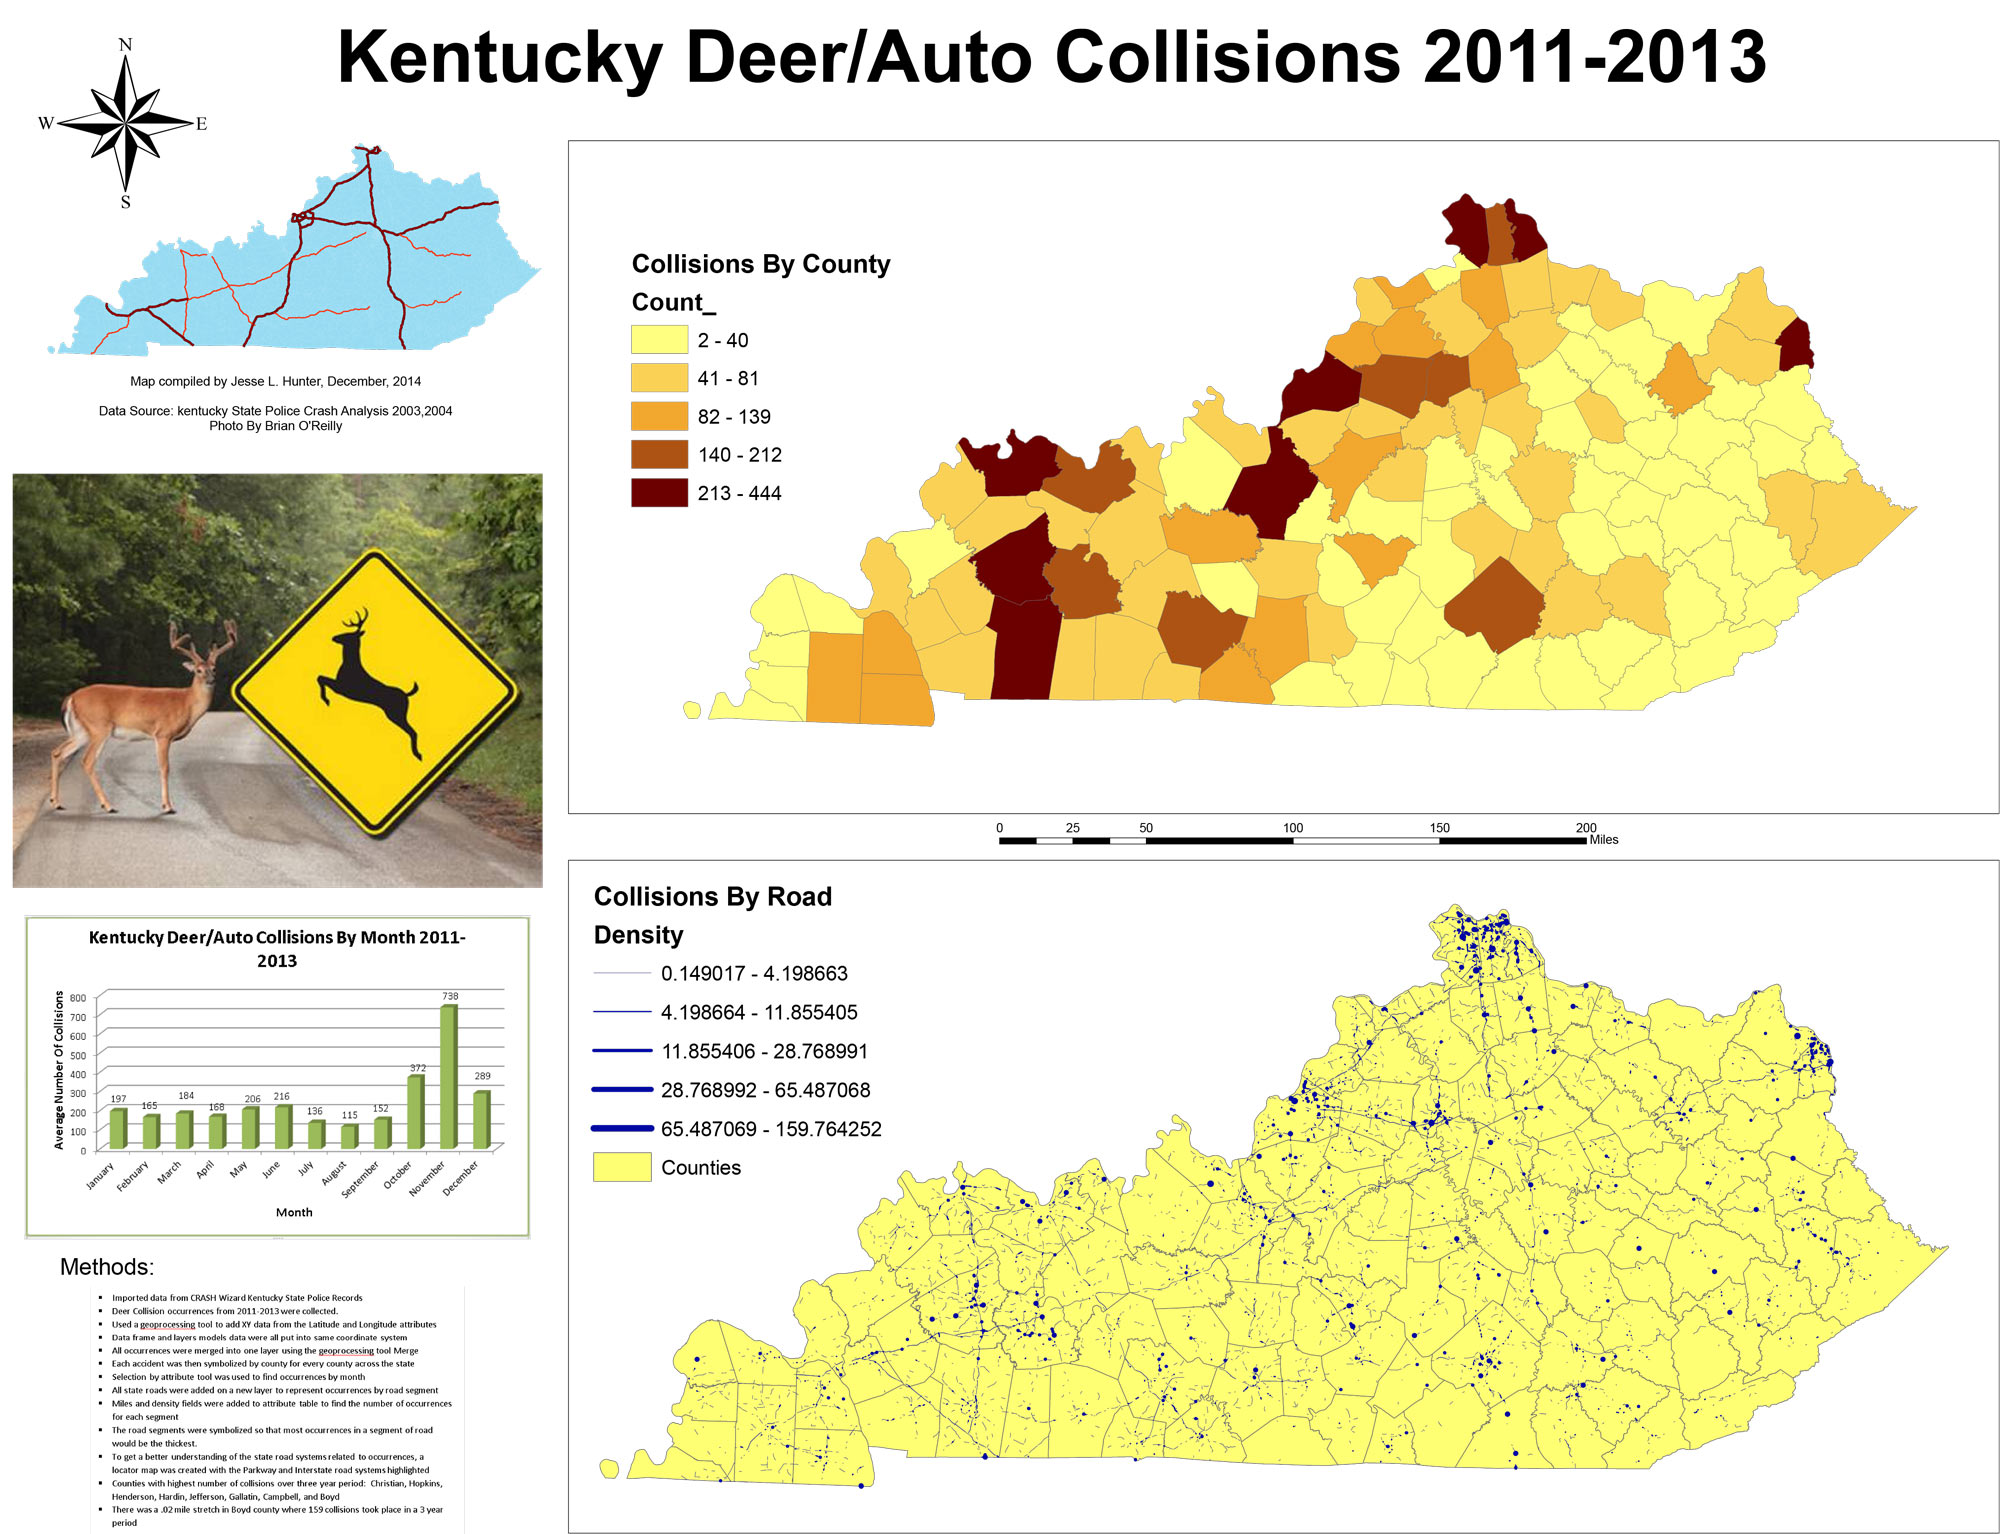
An Analysis of Kentucky’s Deer v. Car Collisions between 2011-2013, by Jesse Hunter

Analysis of Car Crashes in Bullitt County, by Austin Sauer
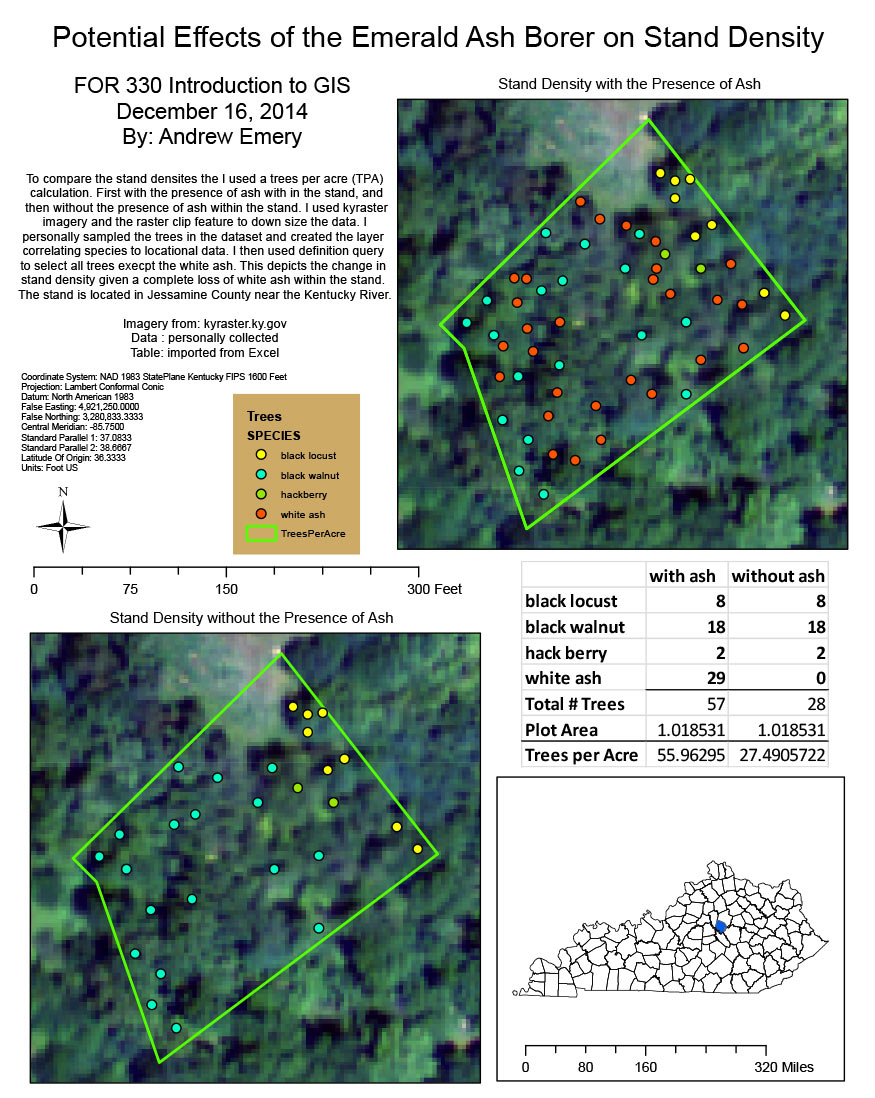
Potential Effects of the Emerald Ash Borer on Stand Density, by Andrew Emery


