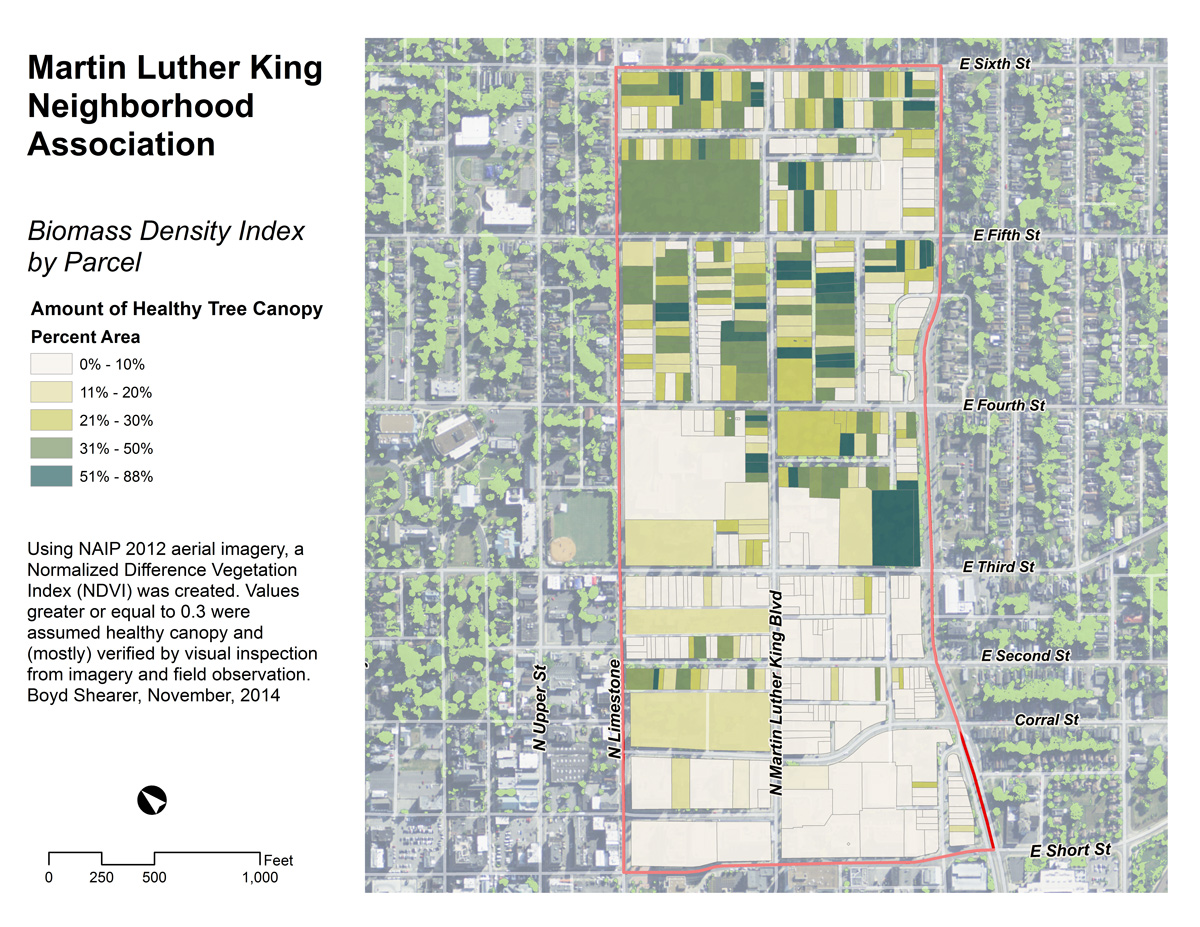
Which property has the healthiest canopy?
Town Branch Trail is a developing shared-use trail connecting downtown Lexington with the city’s outer countryside. The exercise shows the completed and funded phases for the trail, and assesses the extent and health of trees along the trail.
Using National Agriculture Imagery Program (NAIP)  2012 imagery an NDVI (Normalized Difference Vegetation Index) was created and then shown as a ratio per parcel area. After viewing the initial results, a student said, “This is a realtor’s map!” and then quickly visited the PVA website to compare property values to its ‘green index.’