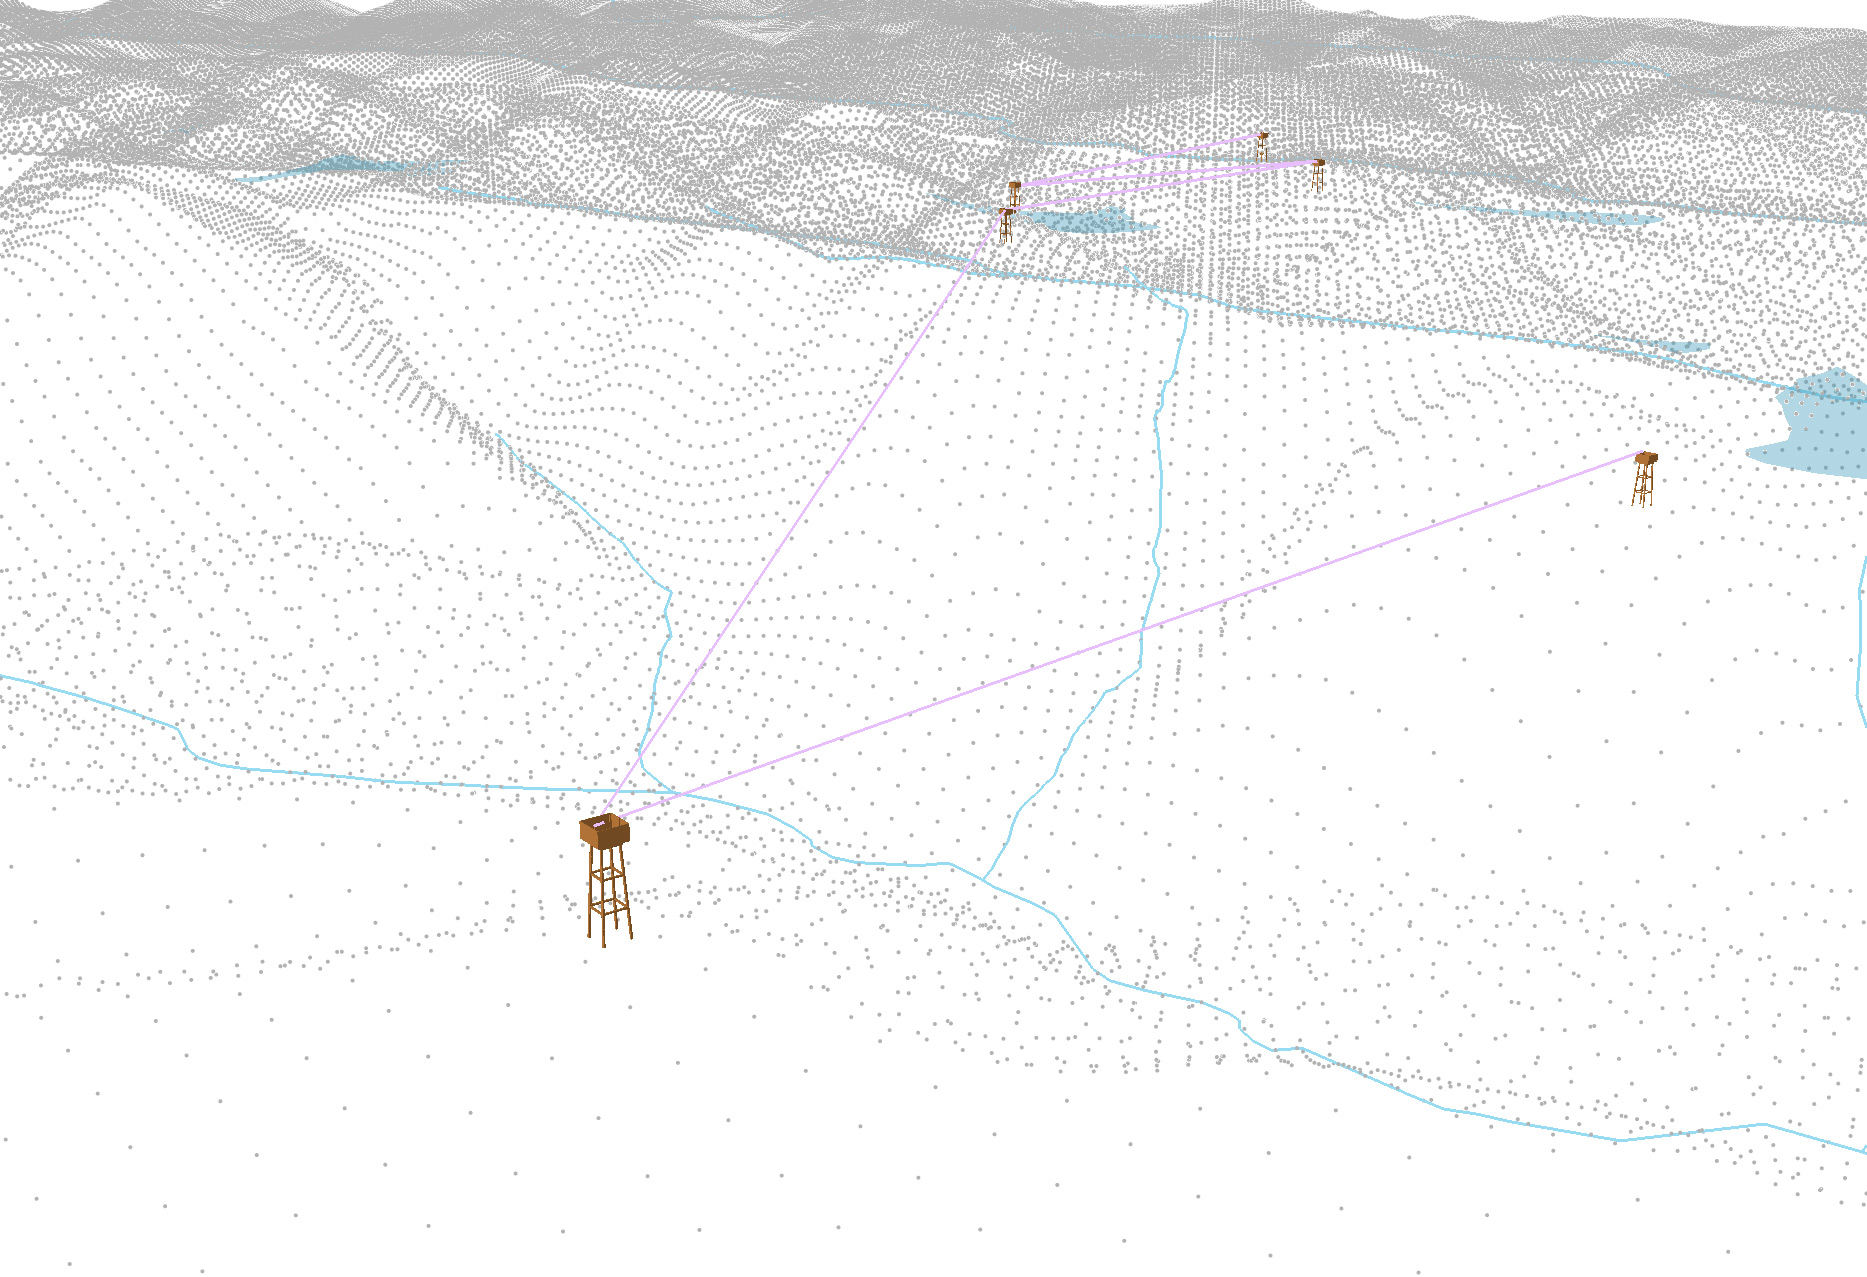
Mass Elevation Points
A project to develop a large-format printed document that helps visitors navigate the resort and better understand the unique ridge. This map requires developing a terrain dataset to model cliffline and dams, because the resolution of the elevation data is not sufficient for this scale. These samples focus on the zipline tour in the resort. Hopefully, this completed map will be released in late June.
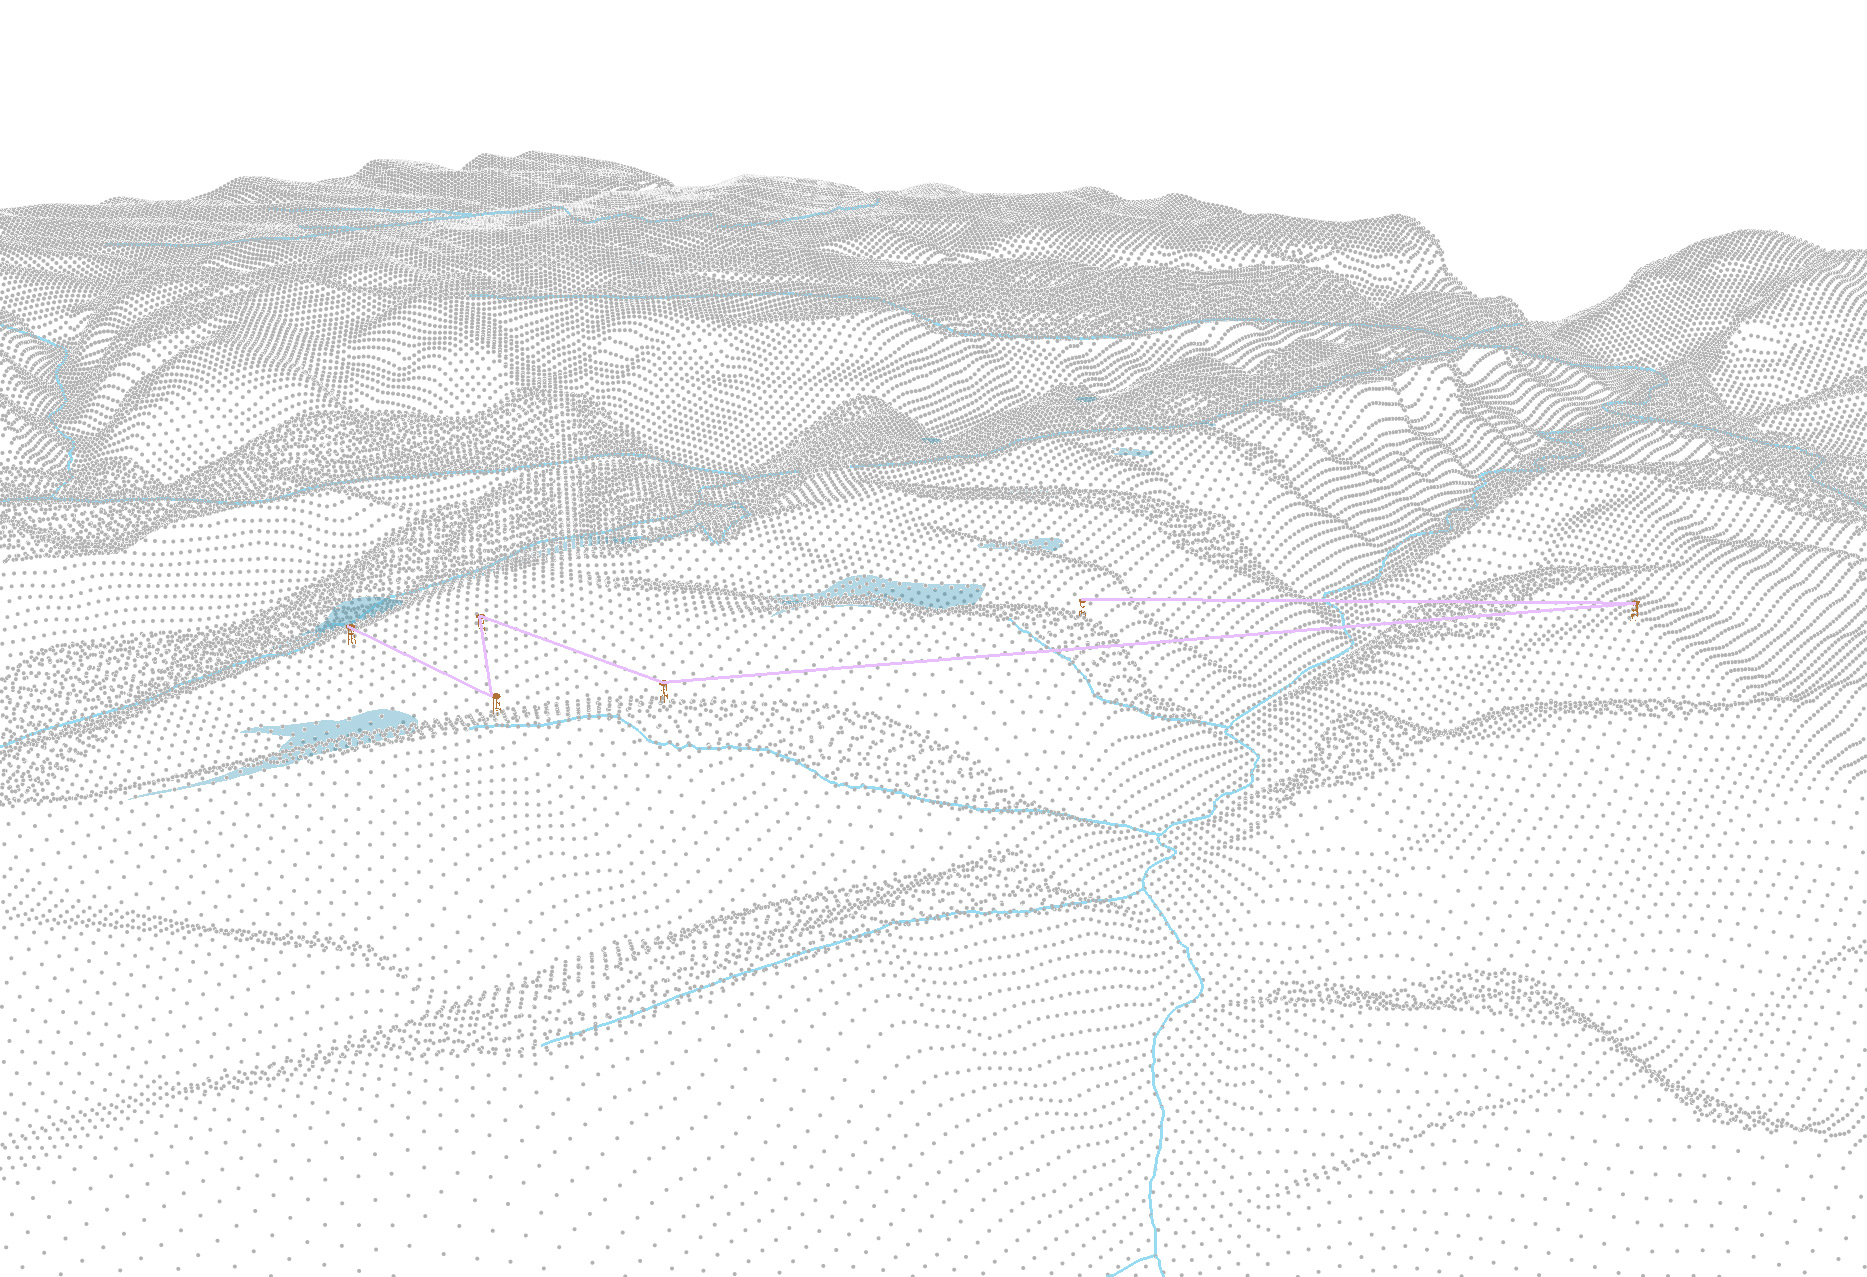
Mass Elevation Points
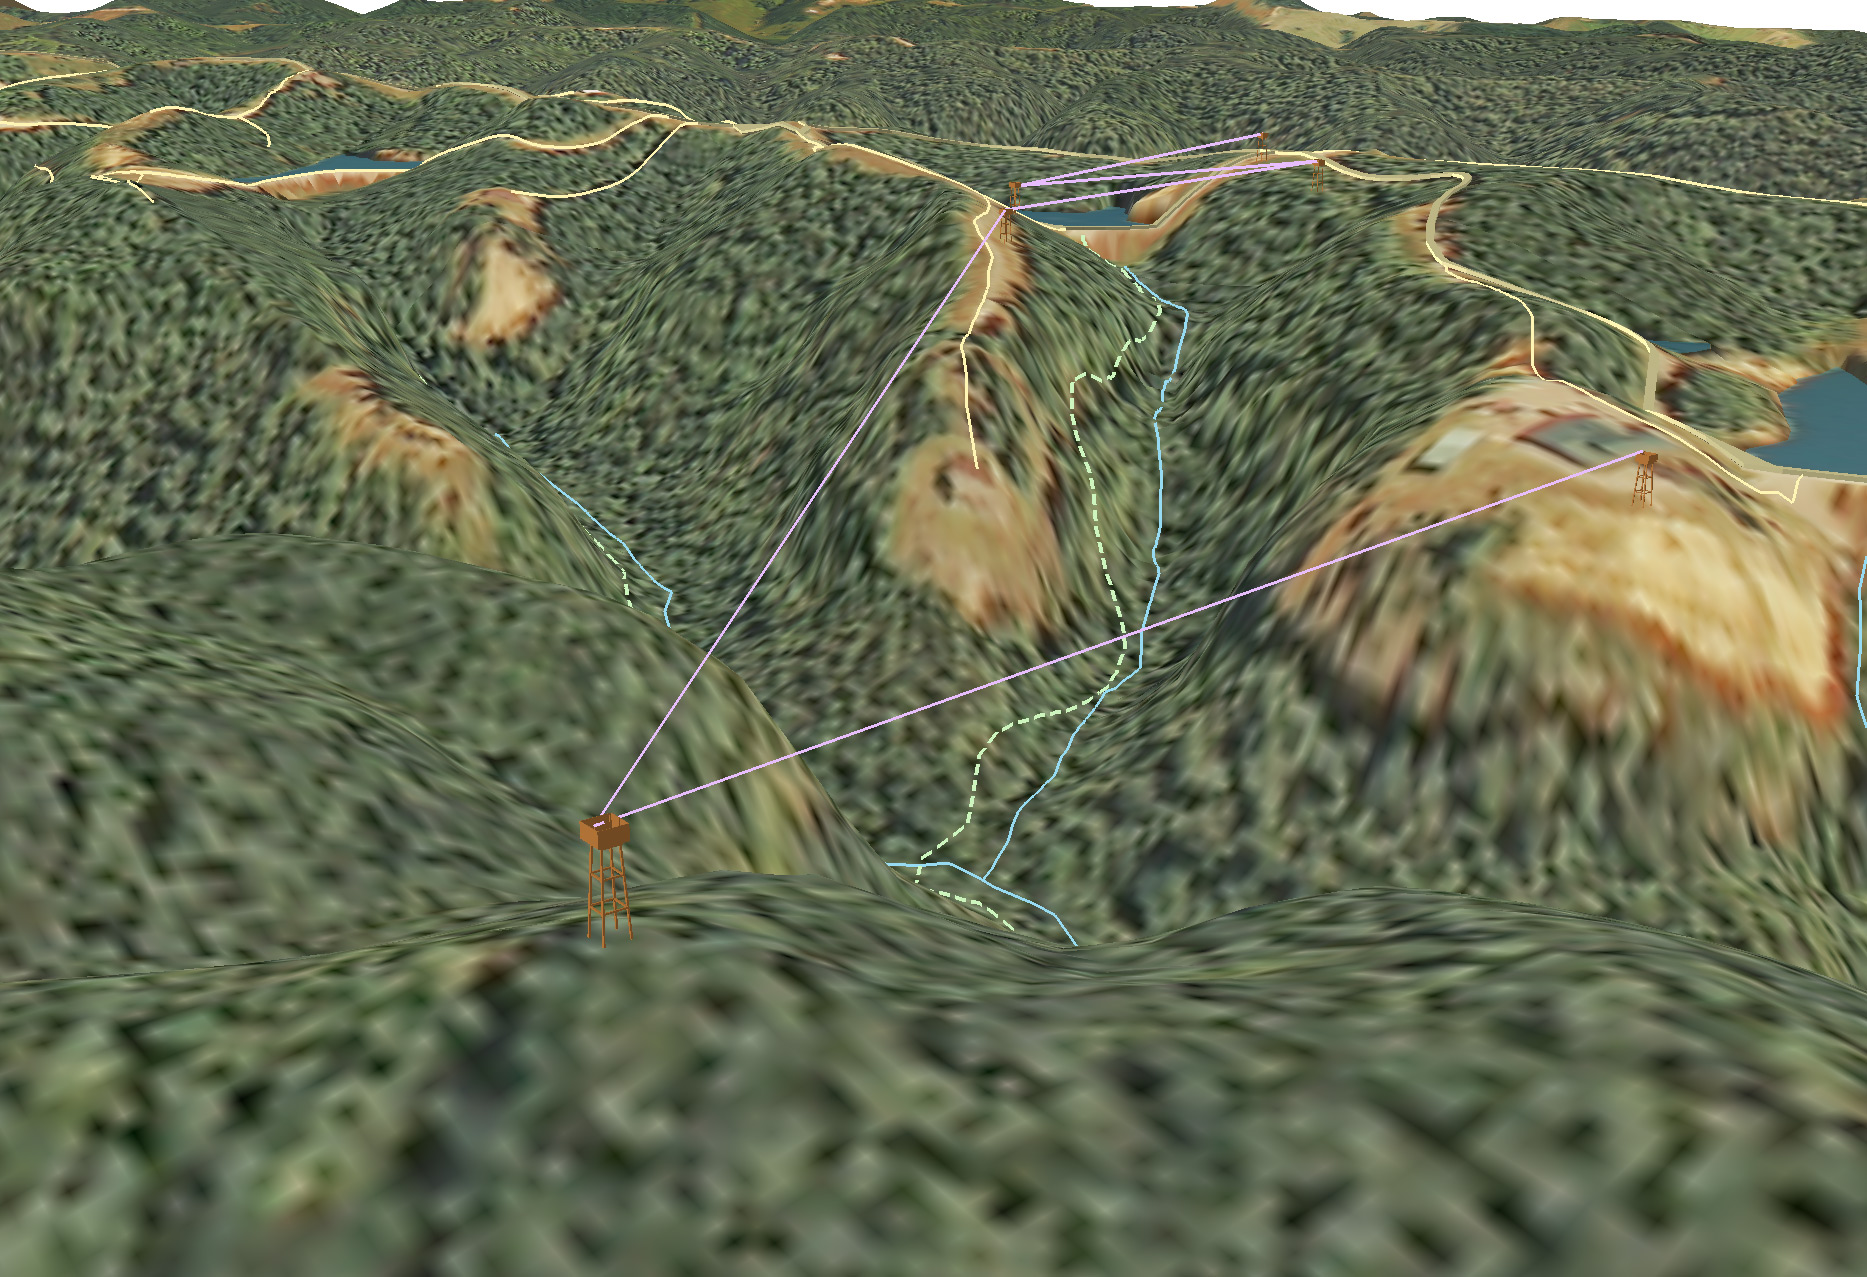
Zipline
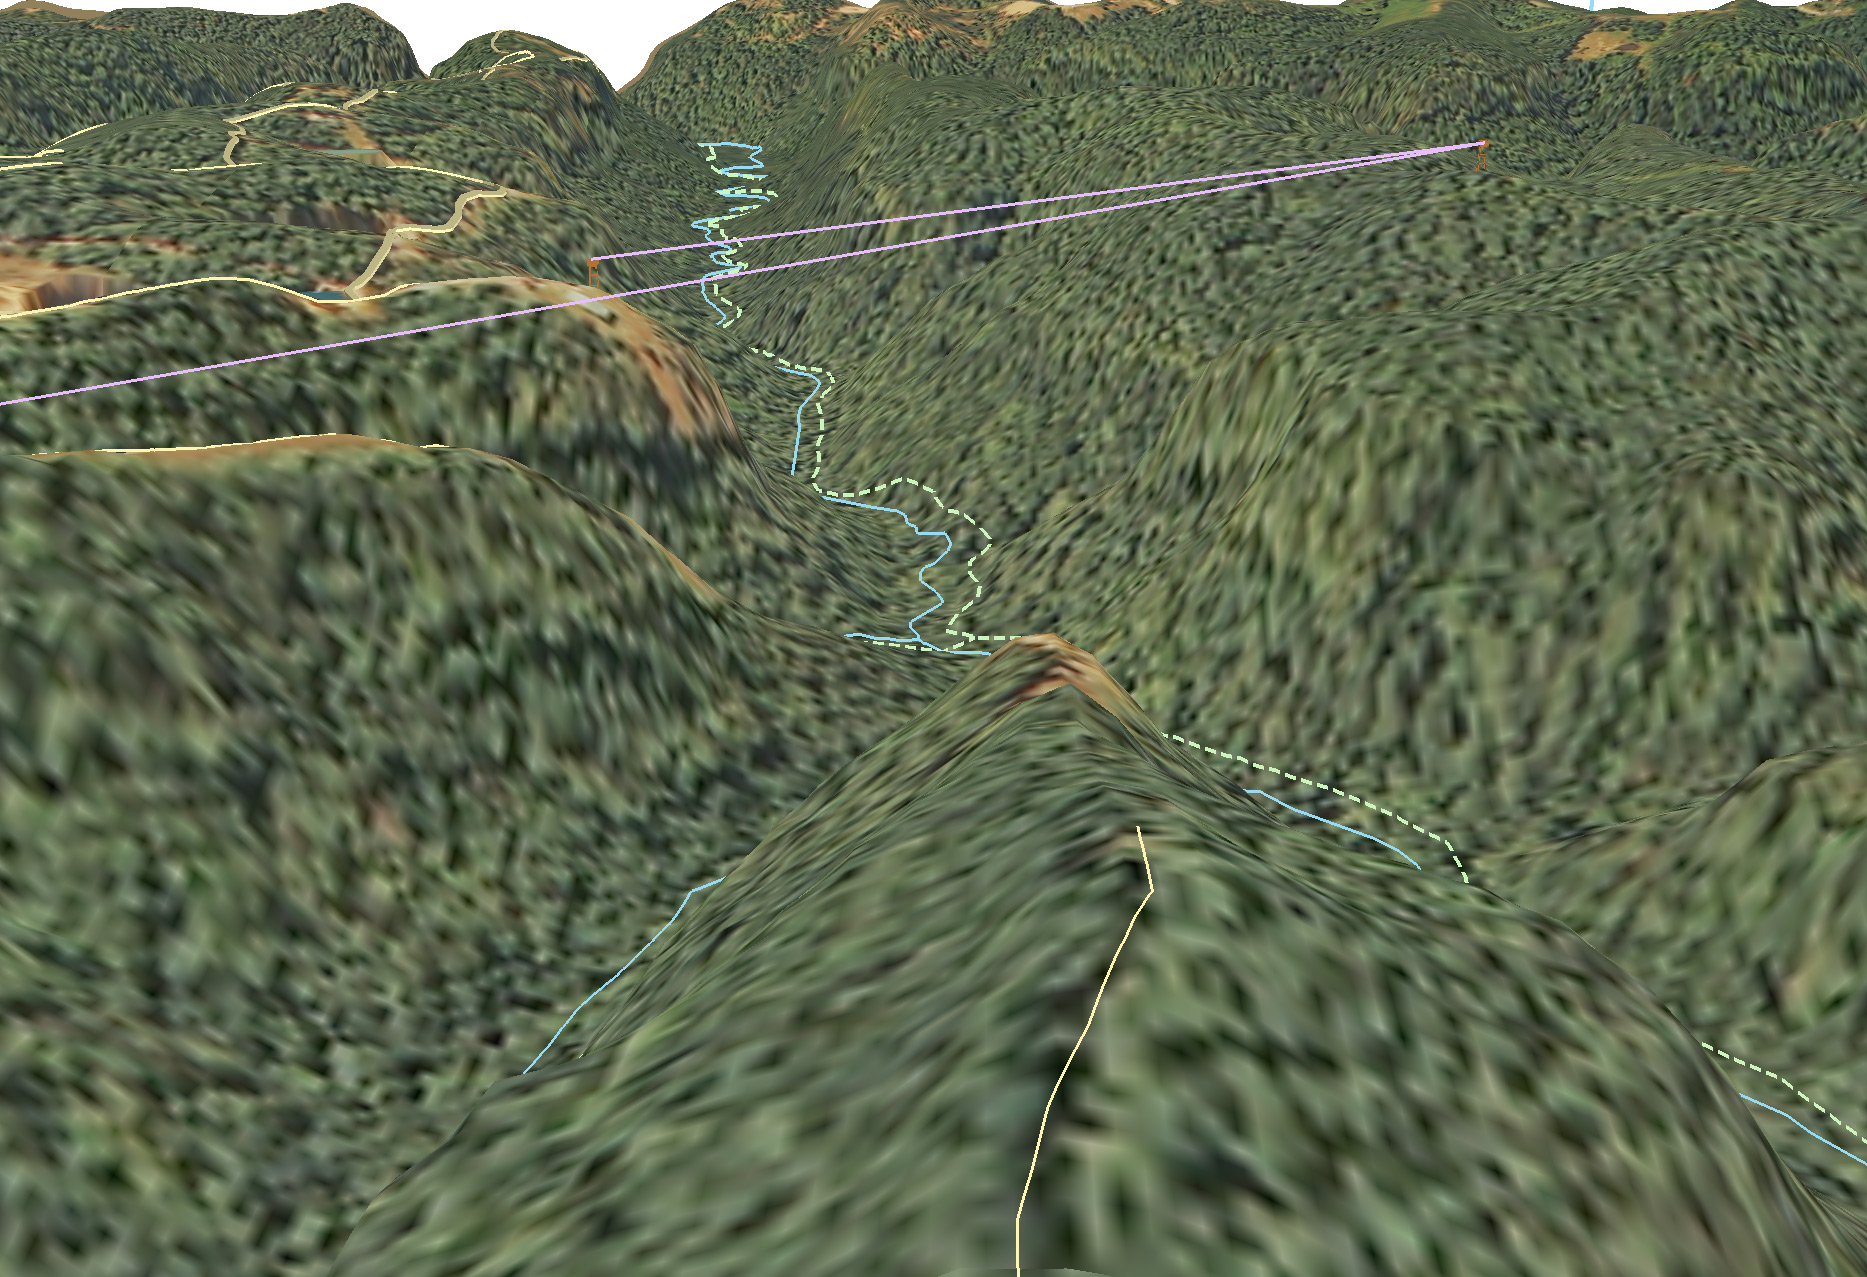
Zipline
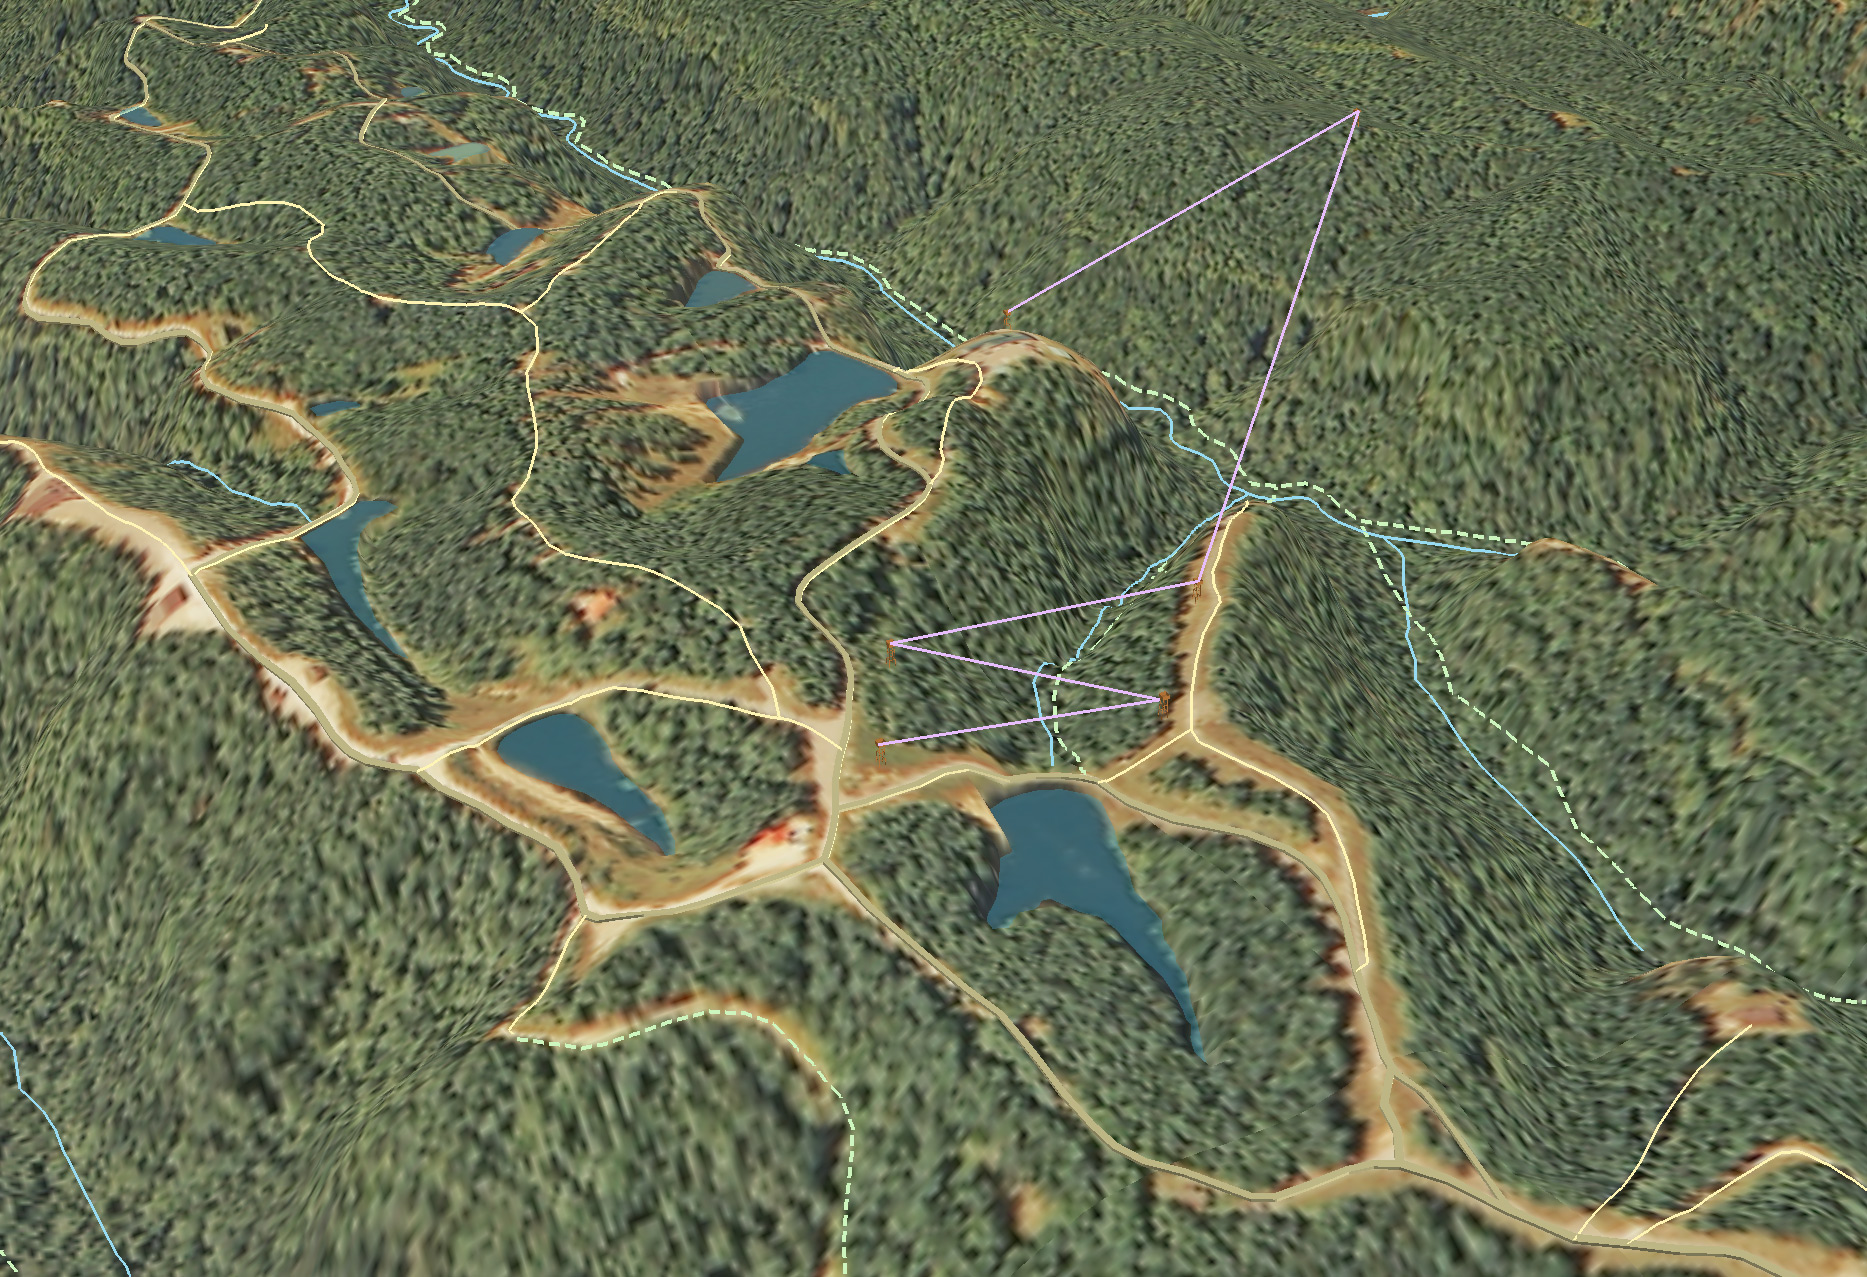
Zipline
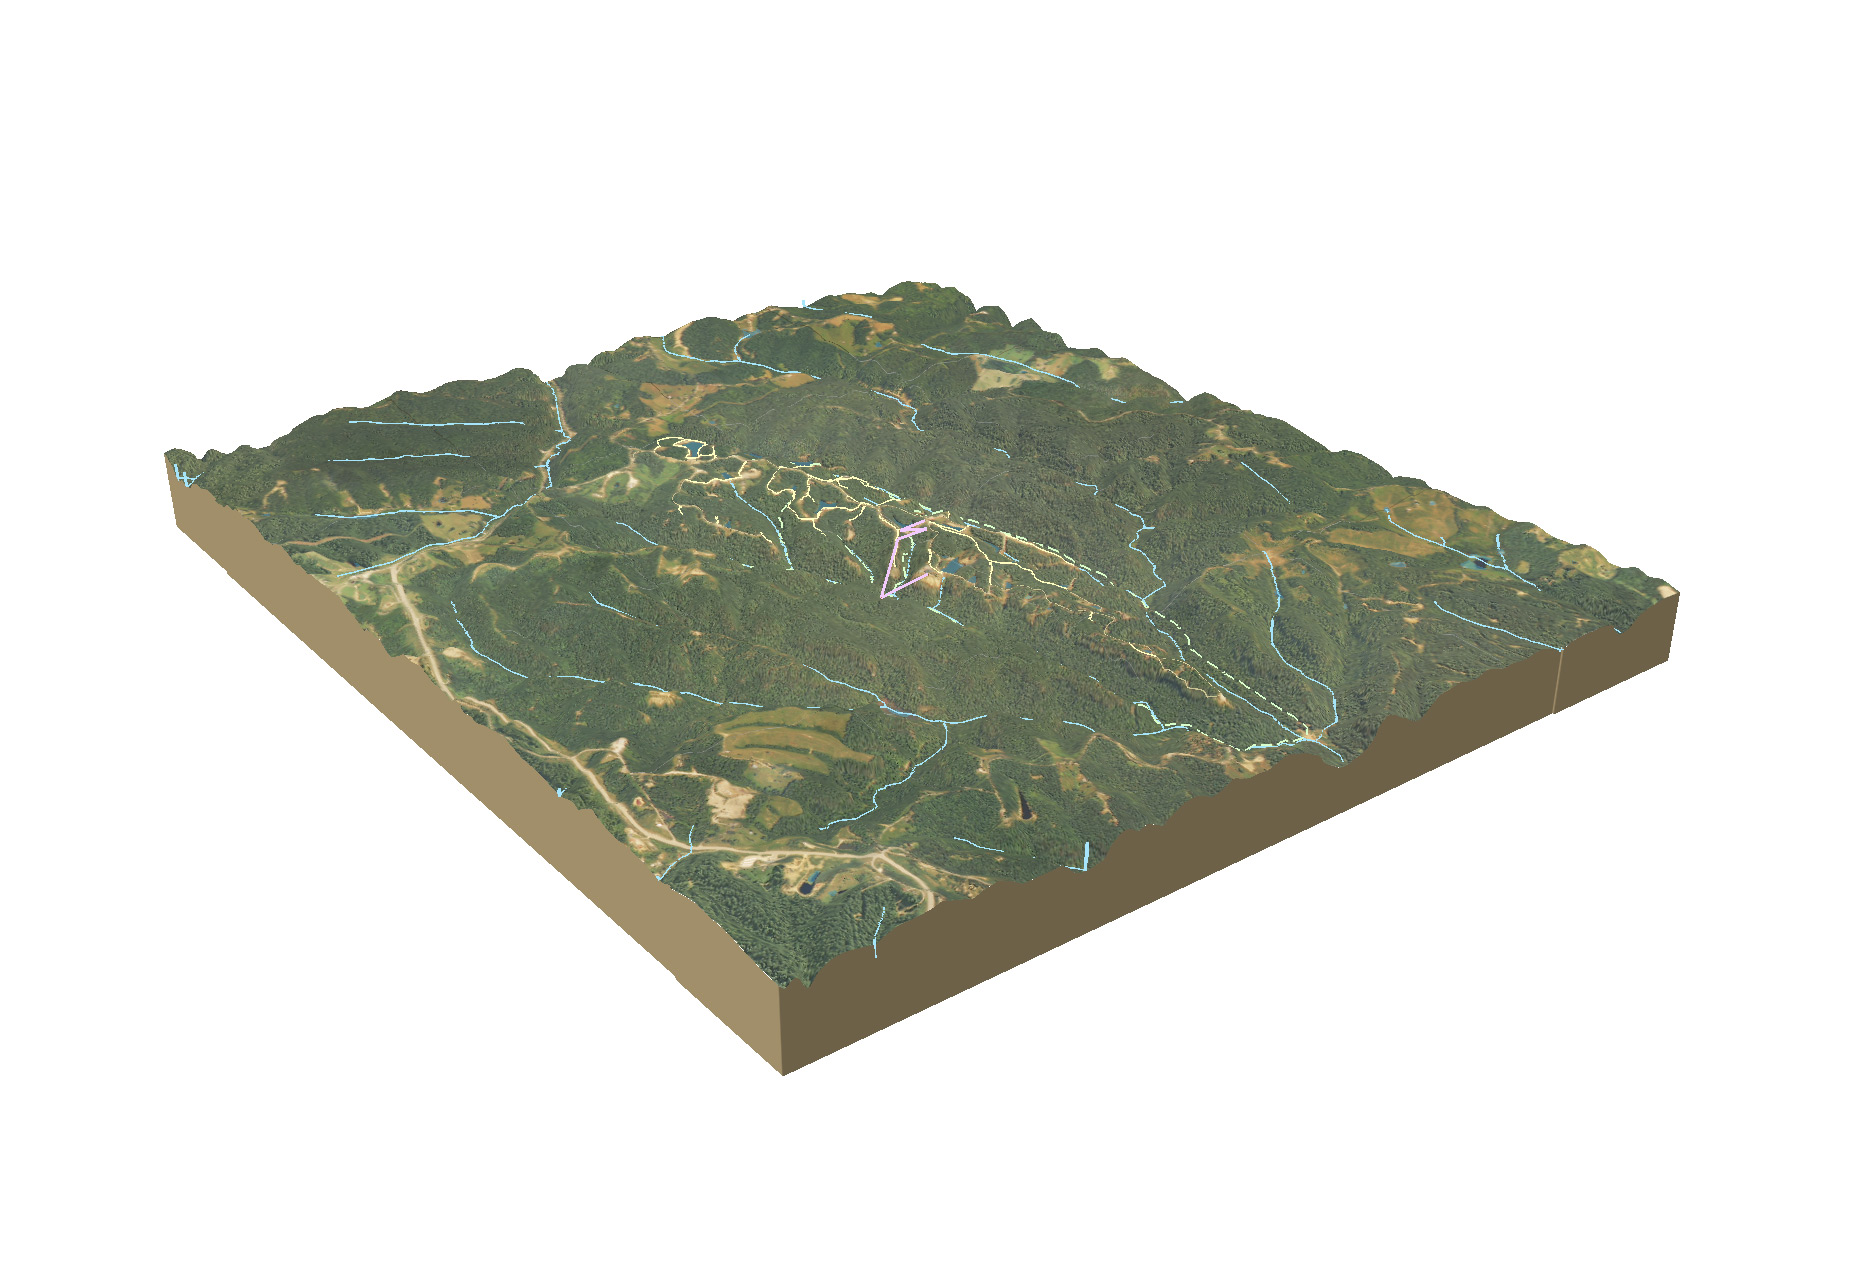
Block Diagram

Style sample