5th Edition Red River Gorge Backpacking Map
It’s almost ready for release!
A complete remake of our popular backpacking guide with the green maps. This new set keeps all of the great features of the old maps, but in full-color and updated trails and data.
Visit our Gorge webpage to learn more: http://www.outrageGIS.com/gorge
In January we looked at the previous editions, all 2-color with an travel elevation profile booklet, and thought how we could improve it. We had used aerial photography to show landcover type, which did a good job indicating density of canopy, open areas, sunlight, and offered a rustic green background for our GPS trails.
However, most people are confused when they look at aerial photographs…they think hills are valleys and vice versa. This terrain inversion is a significant cartographic problem, but we were confident then when most people *used them in the field* they made sense.
While unique advantages exist using photographs, for the new edition we used a custom created, full-color hillshade that shows forest canopy cover type and open areas. We artificially lit the landscape from the west and eliminated terrain inversion. We added a distinct stream symbol to clearly mark drainage. With 50-foot contours and spot elevations, this new edition offers a handsome way to stay located.
Since most GPS applications are now by default in the latitude/longitude (decimal degrees) coordinate system, we added this graticule to the map. A UTM grid is also labeled. With scales on the corners of maps that can be seen while folded, a hiker can quickly determine distance and locate themselves with a GPS in either dd.dddd or UTM coordinate systems.
We still have all of the trail profiles, side trails, backcountry campsites that were in the previous edition. The new edition actually covers more area and trails.
| Red River Gorge Backpacking Map: $14 |
 |
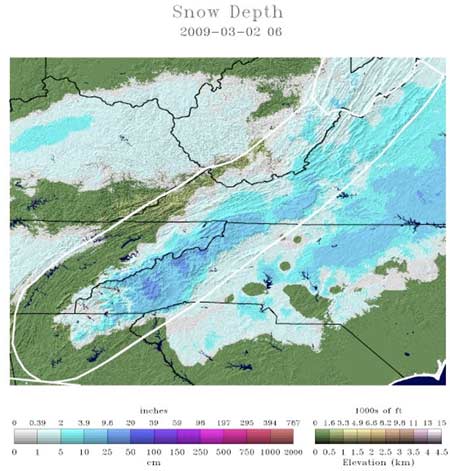
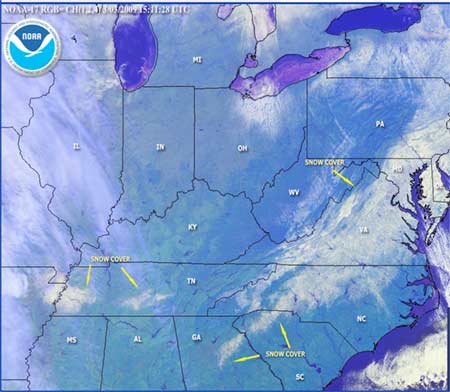
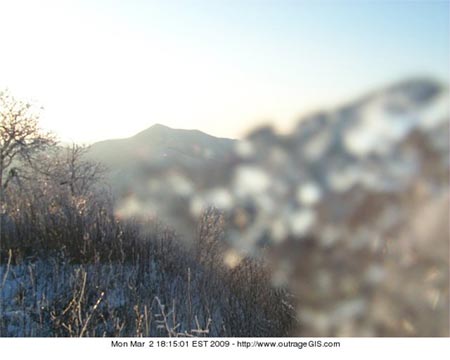
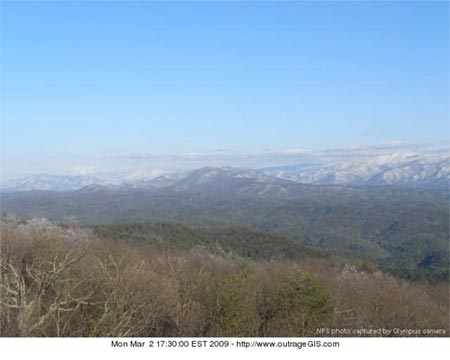
 April 15, 2009. We see two very different Smokies today and the highest peaks in the southern Appalachians provide an atmospheric boundary.