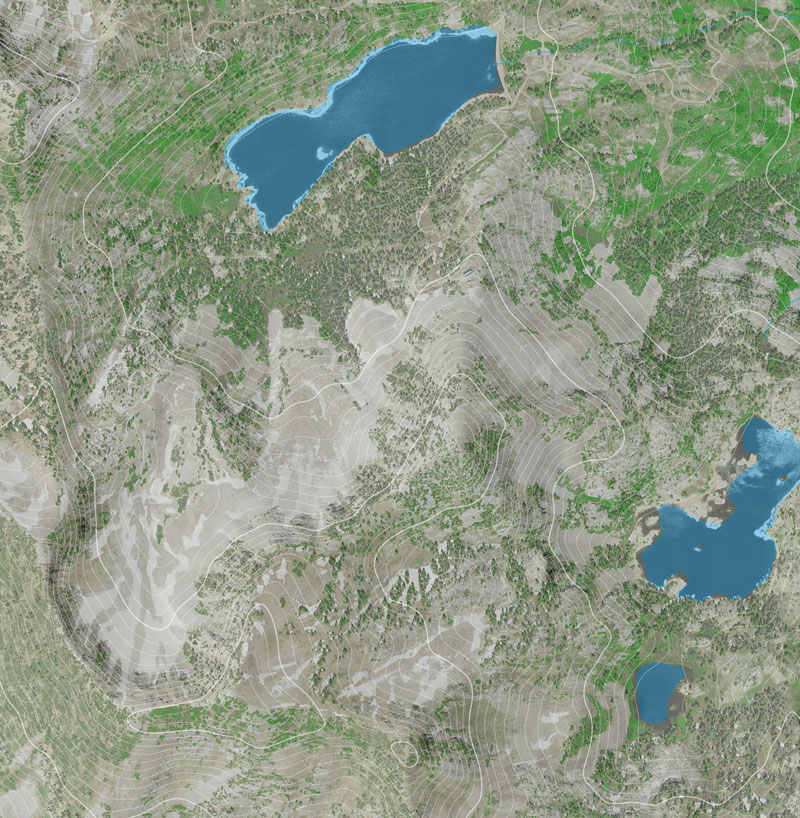
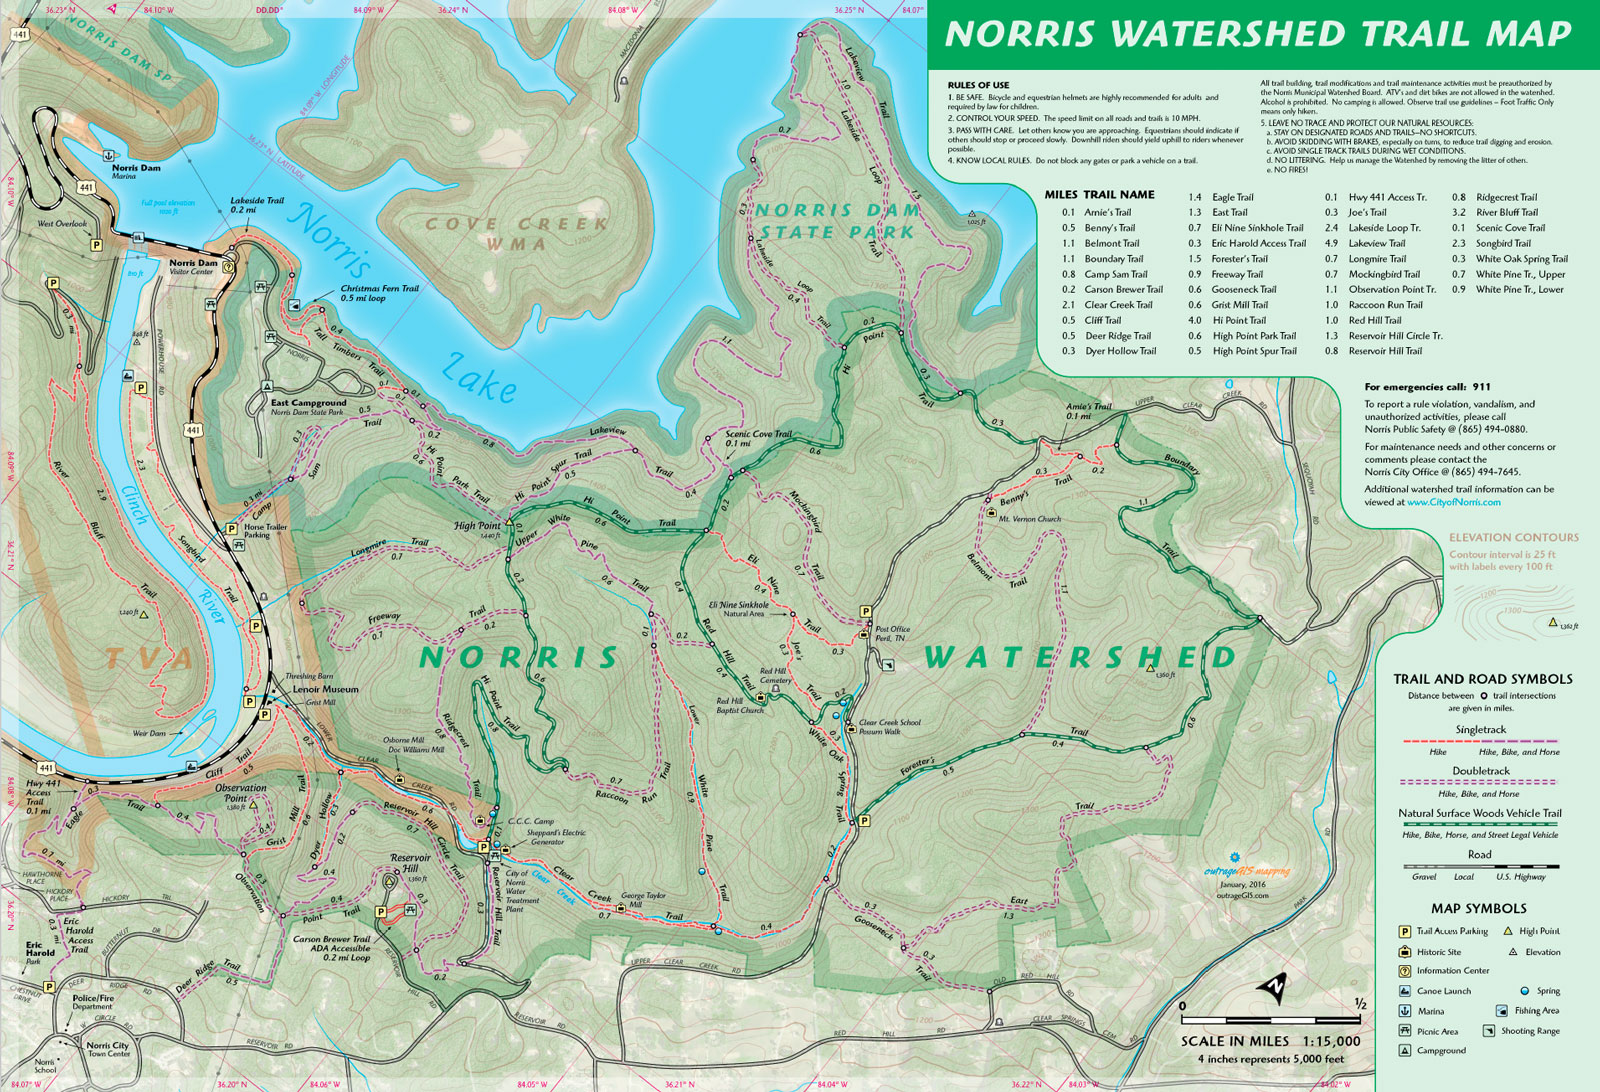
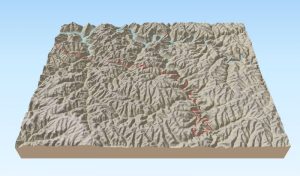
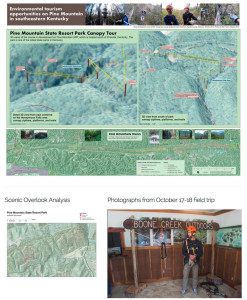
Students in NRE 355 (a GIS calass at the University of Kentucky Natural Resources and Environmental Sciences program) visited the 740-acre Pilot Knob State Nature Preserve on September 21, 2016, and used mobile devices to collect GPS data for the existing trail network. They mapped approximately 3.2 miles of trail then used ArcGIS and CARTO to measure the trails and create a 2D map and 3D visualizations of the nature preserve. Students then created websites to showcase their work.
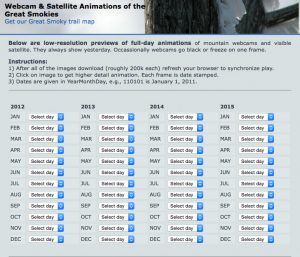
http://sweb.uky.edu/~blshea1/nre355/pksnp contains maps, animations, and links to student pages.
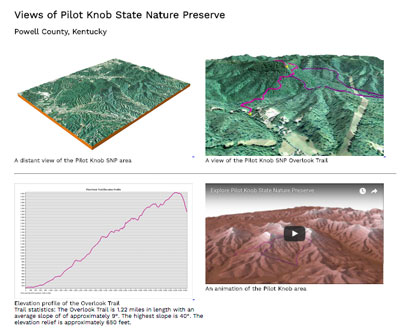
3D views and animations of Pilot Knob State Nature Preserve