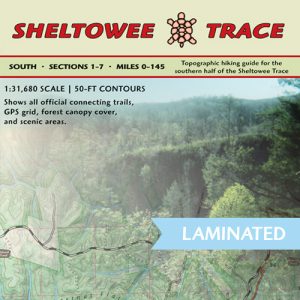
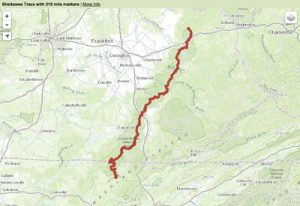
Come down to the Woodland Art Fair this Saturday and Sunday, Â August 15 and 16. We’ve made big progress on the Sheltowee Trace South map and we’ll have samples to show at our booth. Â While in the same format as Sheltowee Trace North map, we’re adding an additional sheet to cover the Big South Area.
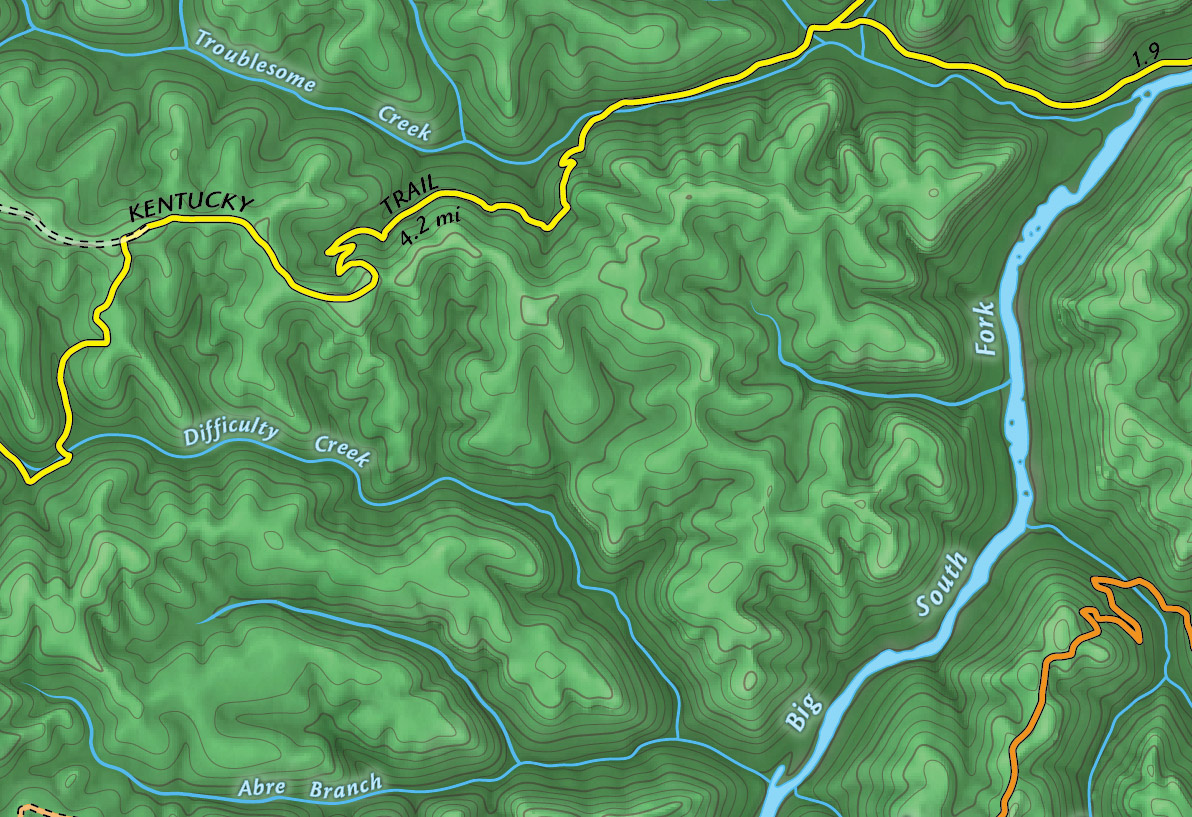
Working draft of the Sheltowee Trace South map
The fair runs from 10 a.m. to 5 p.m., or there abouts. We’ll stay as long as you’re visiting!
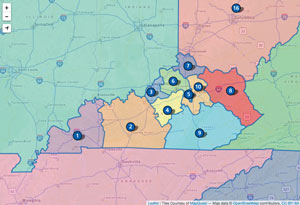
Our booth location and coordinates are shown on the below map. We’ll be between Troublesome and Difficulty Creeks, at least spirit! Find us on the Woodland Christian Church side of the fair at the shady bottom of the hill.