If you visit this site often, you likely have a favorite map app on your phone. I certainly do and I have installed dozens of apps over the years. Most focus on placing your location as a dot on the map.
The dot
Any map app that shows your location as a dot on the map fosters a dependence on your exact location. We end up saying, "I am here" instead of asking "Where am I?"
To build strong spatial awareness, we should look at the dot after studying the plain map and doing an exercise in terrain association. Can we orient the map (best done with a paper map, folks) so that map north aligns with observed north? Can we then identify features on the map and estimate their distance from us?
These are questions in topograhic map reading. If you carefully observe your environment and compare its representation on the map, you will not need the dot.
When there was no dot
Let’s say the early 1990s. Before that time, we used paper maps. Soon after, handheld GPS units became popular and only showed coordinates for your position and maybe some other location statistics like speed, elevation, distance & bearing to next waypoint. They were often used with a paper map that had a grid (with linear units on a flat space) or a graticule (angular units on a curved space) that helped a user measure their location.
Using coordinates, we looked at the paper map’s margin for marks that pointed you to a general location. To find the exact location, we looked up and asked, "Where am I?" and compared the map with what we saw. We built a mental map of our surroundings. There was no dot.
An app without a dot?
So, we thought we would kick it back to the 90s and make a browser app that mimics these early devices. Because our maps have detailed graticules and mile markers for the Sheltowee Trace, this app should compliment your journey into topography and map reading. This app is designed for mobile devices and below is a screen capture of a use on an iPhone.
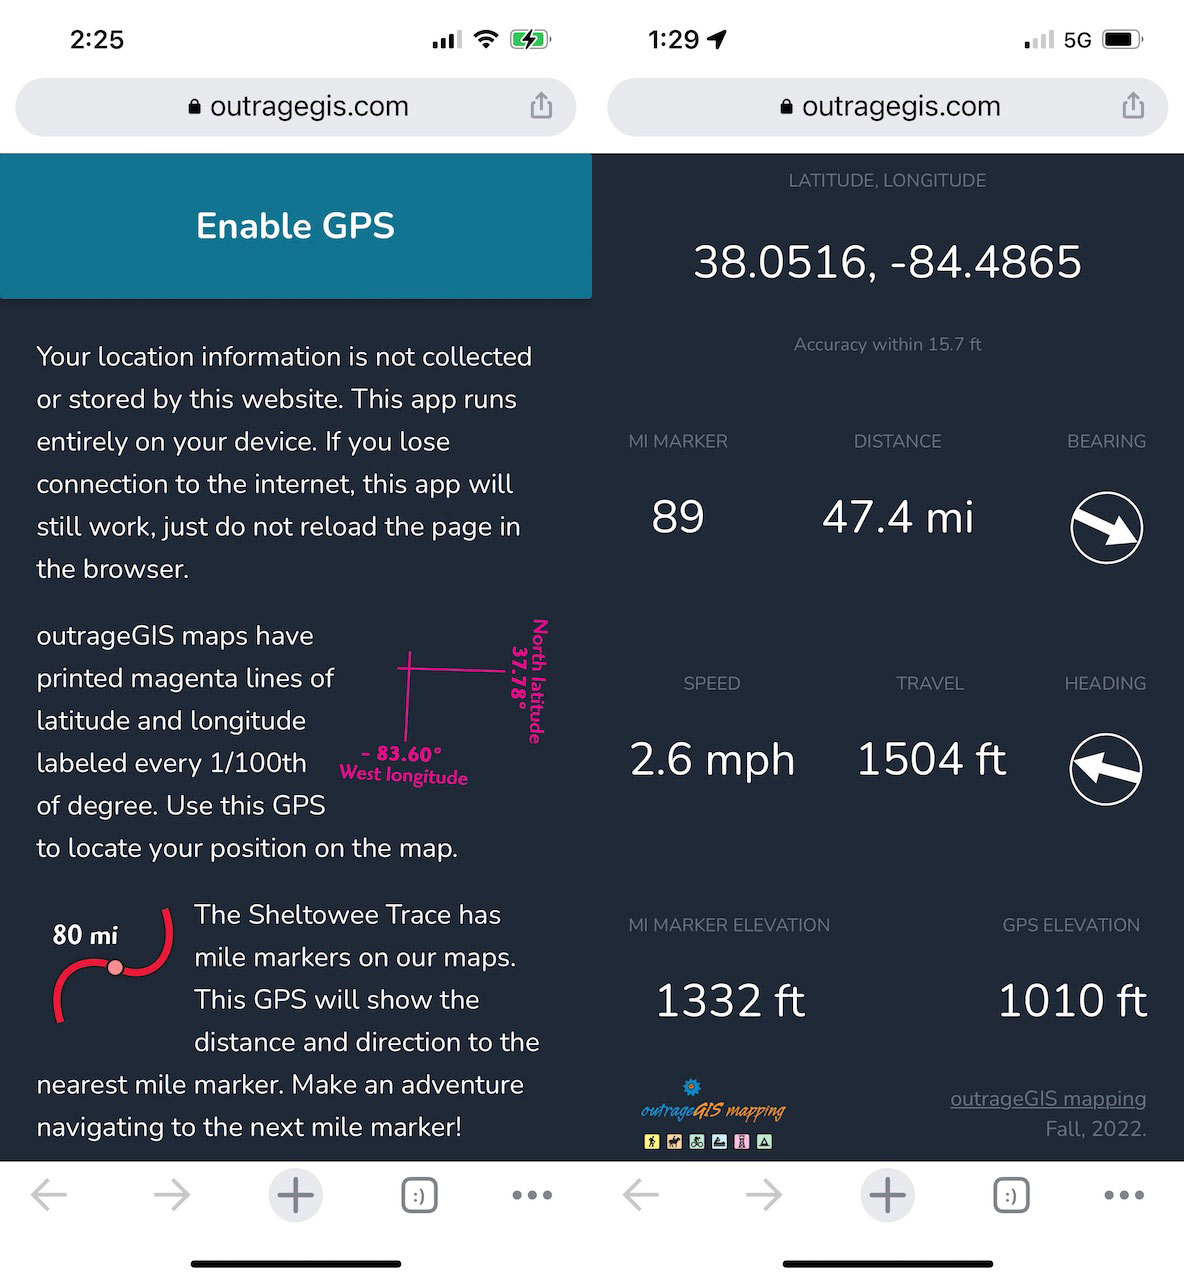
GPS app can be loaded here: https://outrageGIS.com/gps
This app is free, open source, doesn’t need to be installed, and won’t collect any information from you.
Happy adventures!
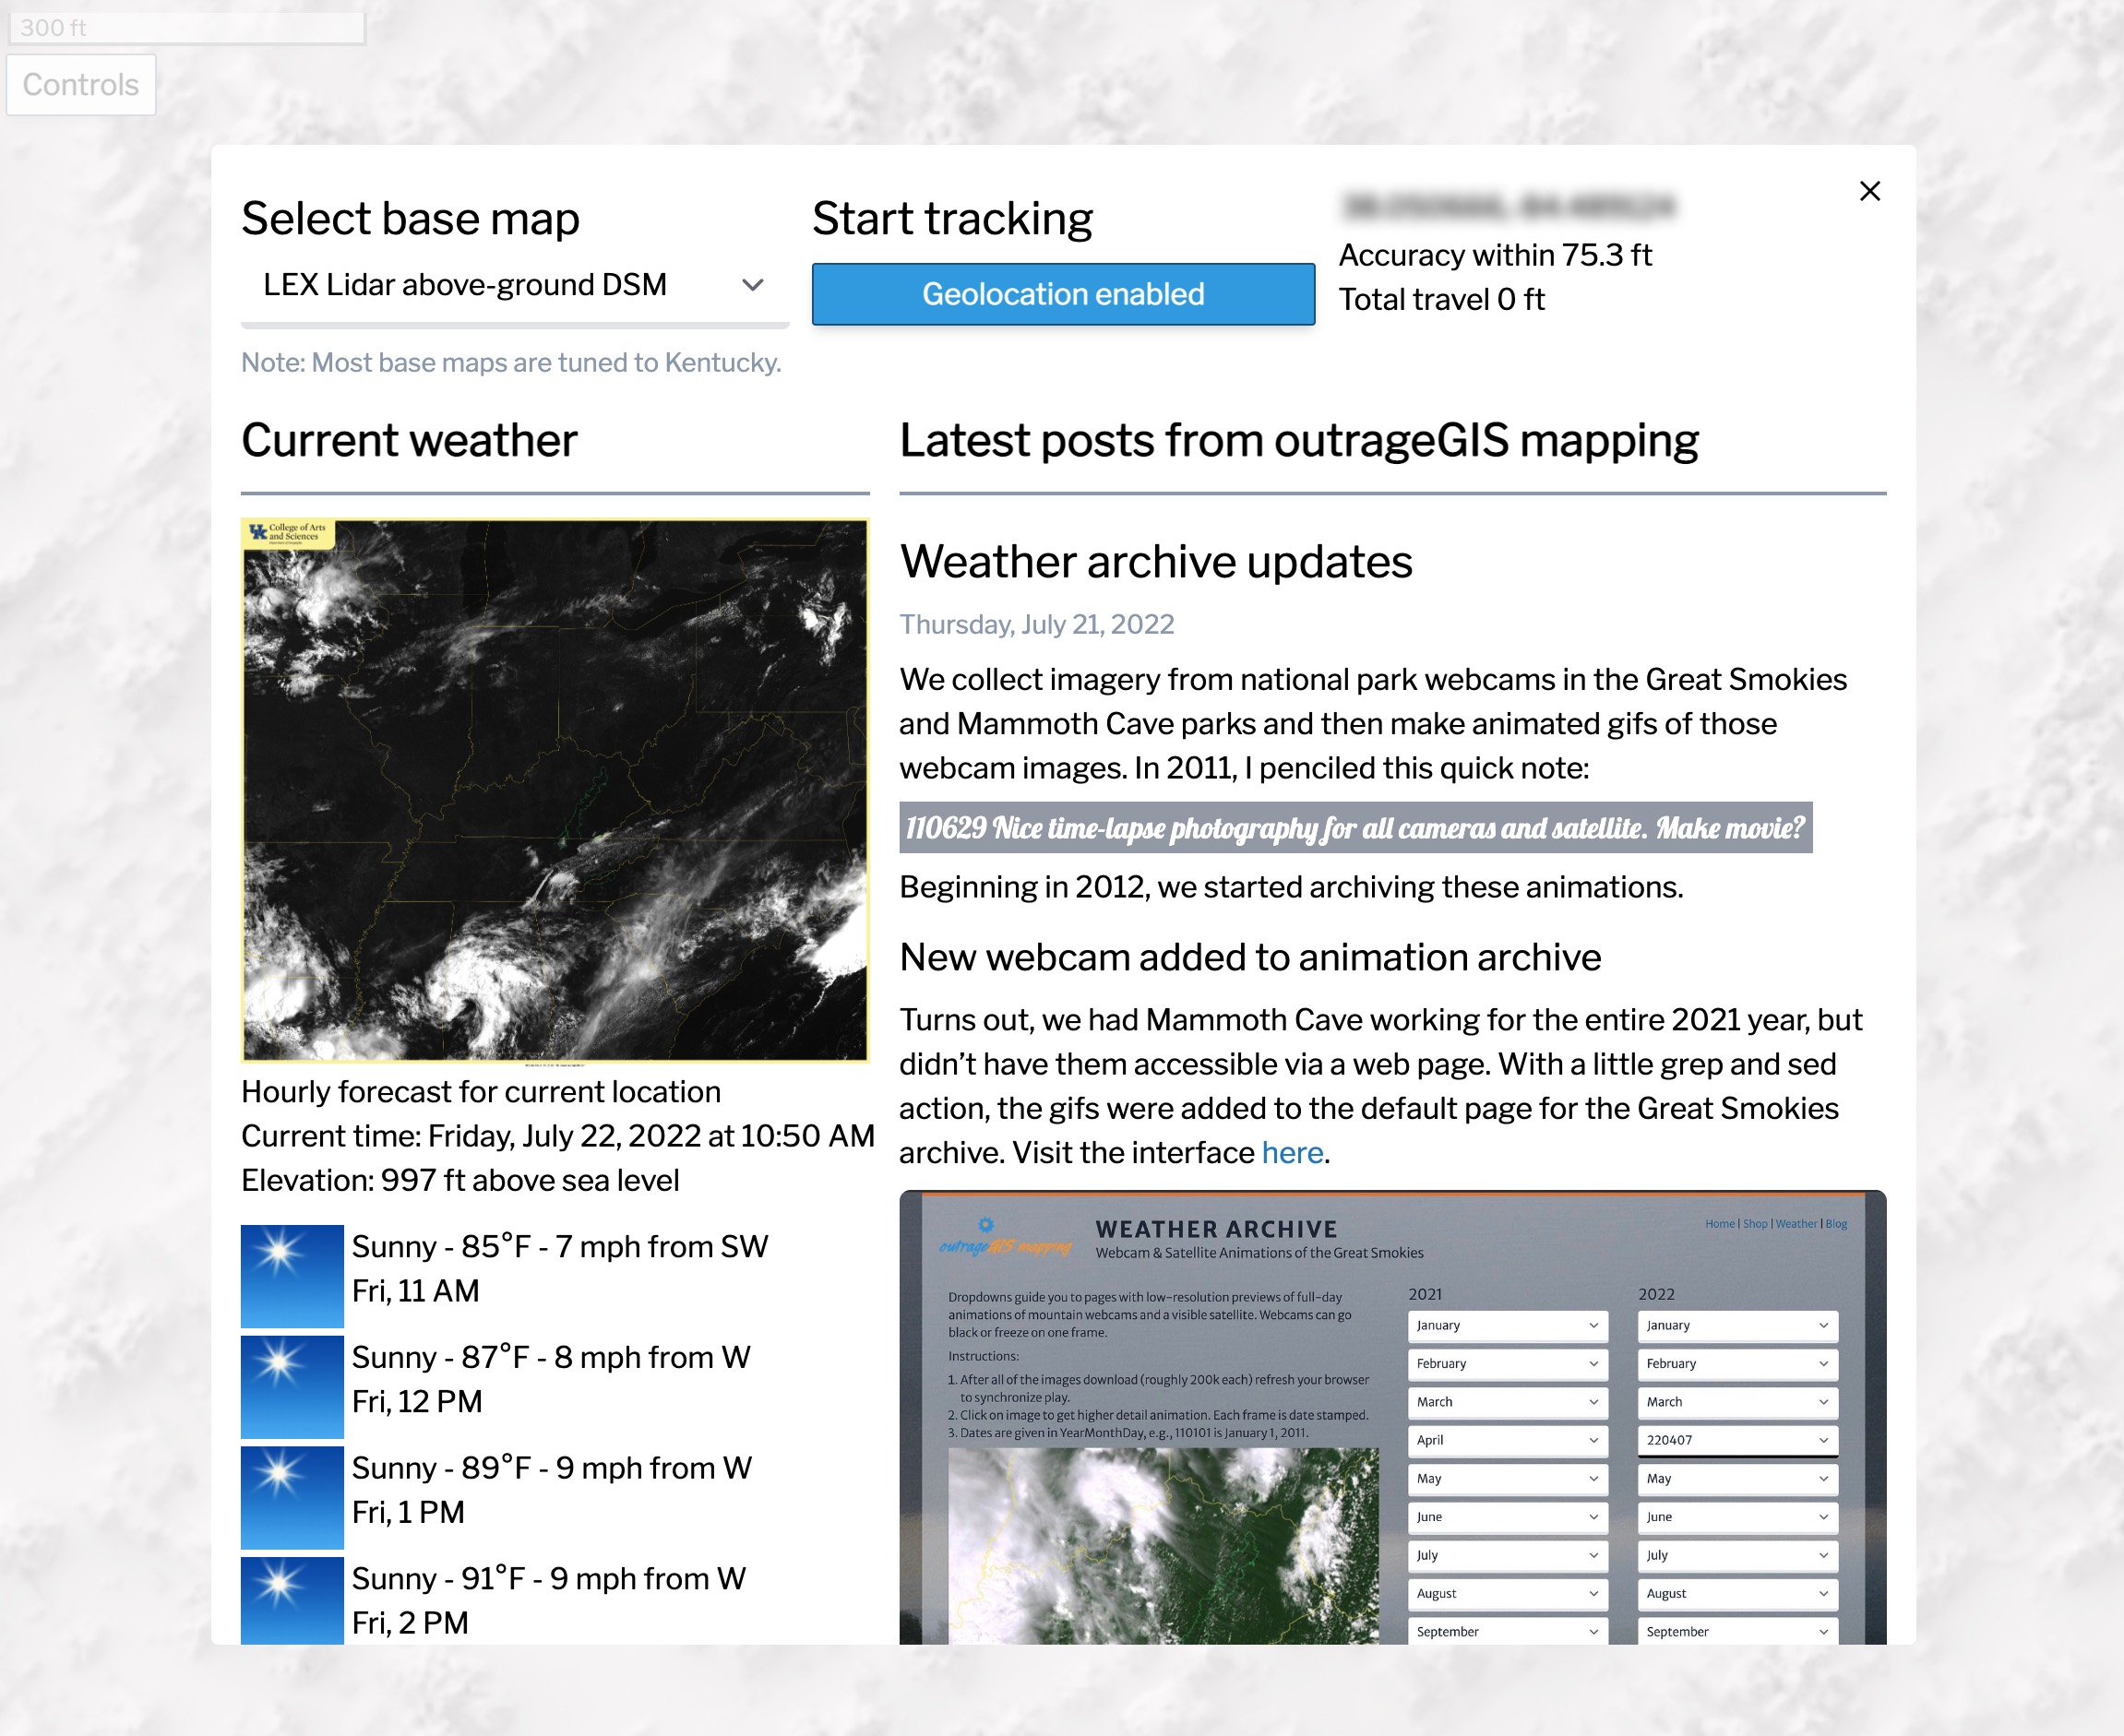
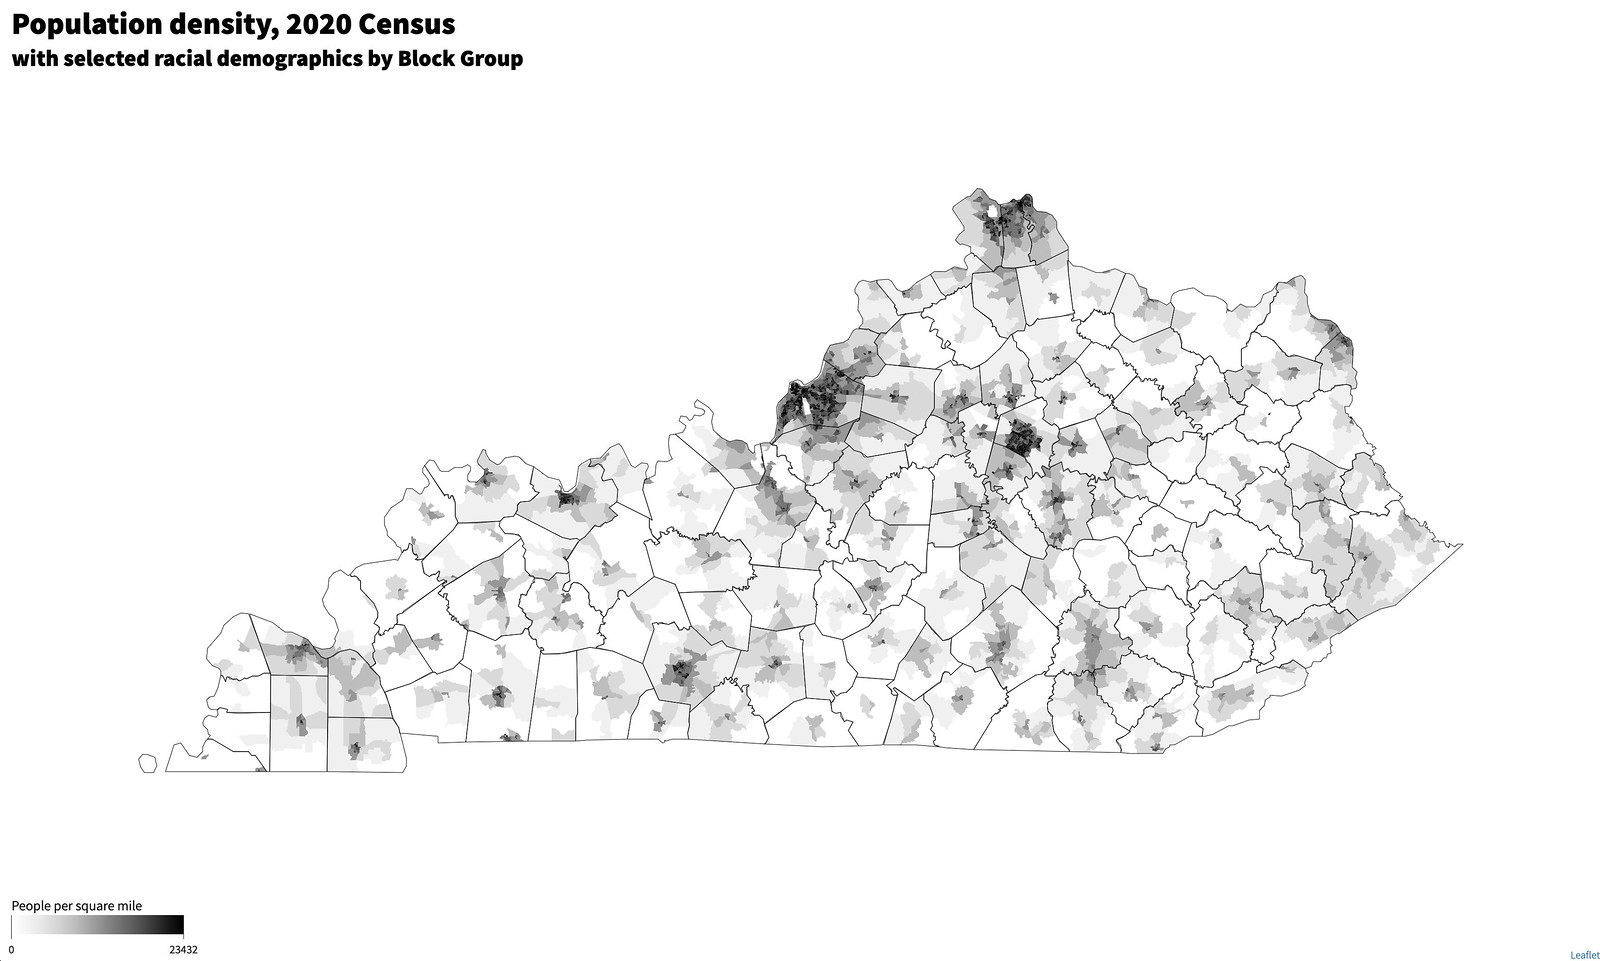
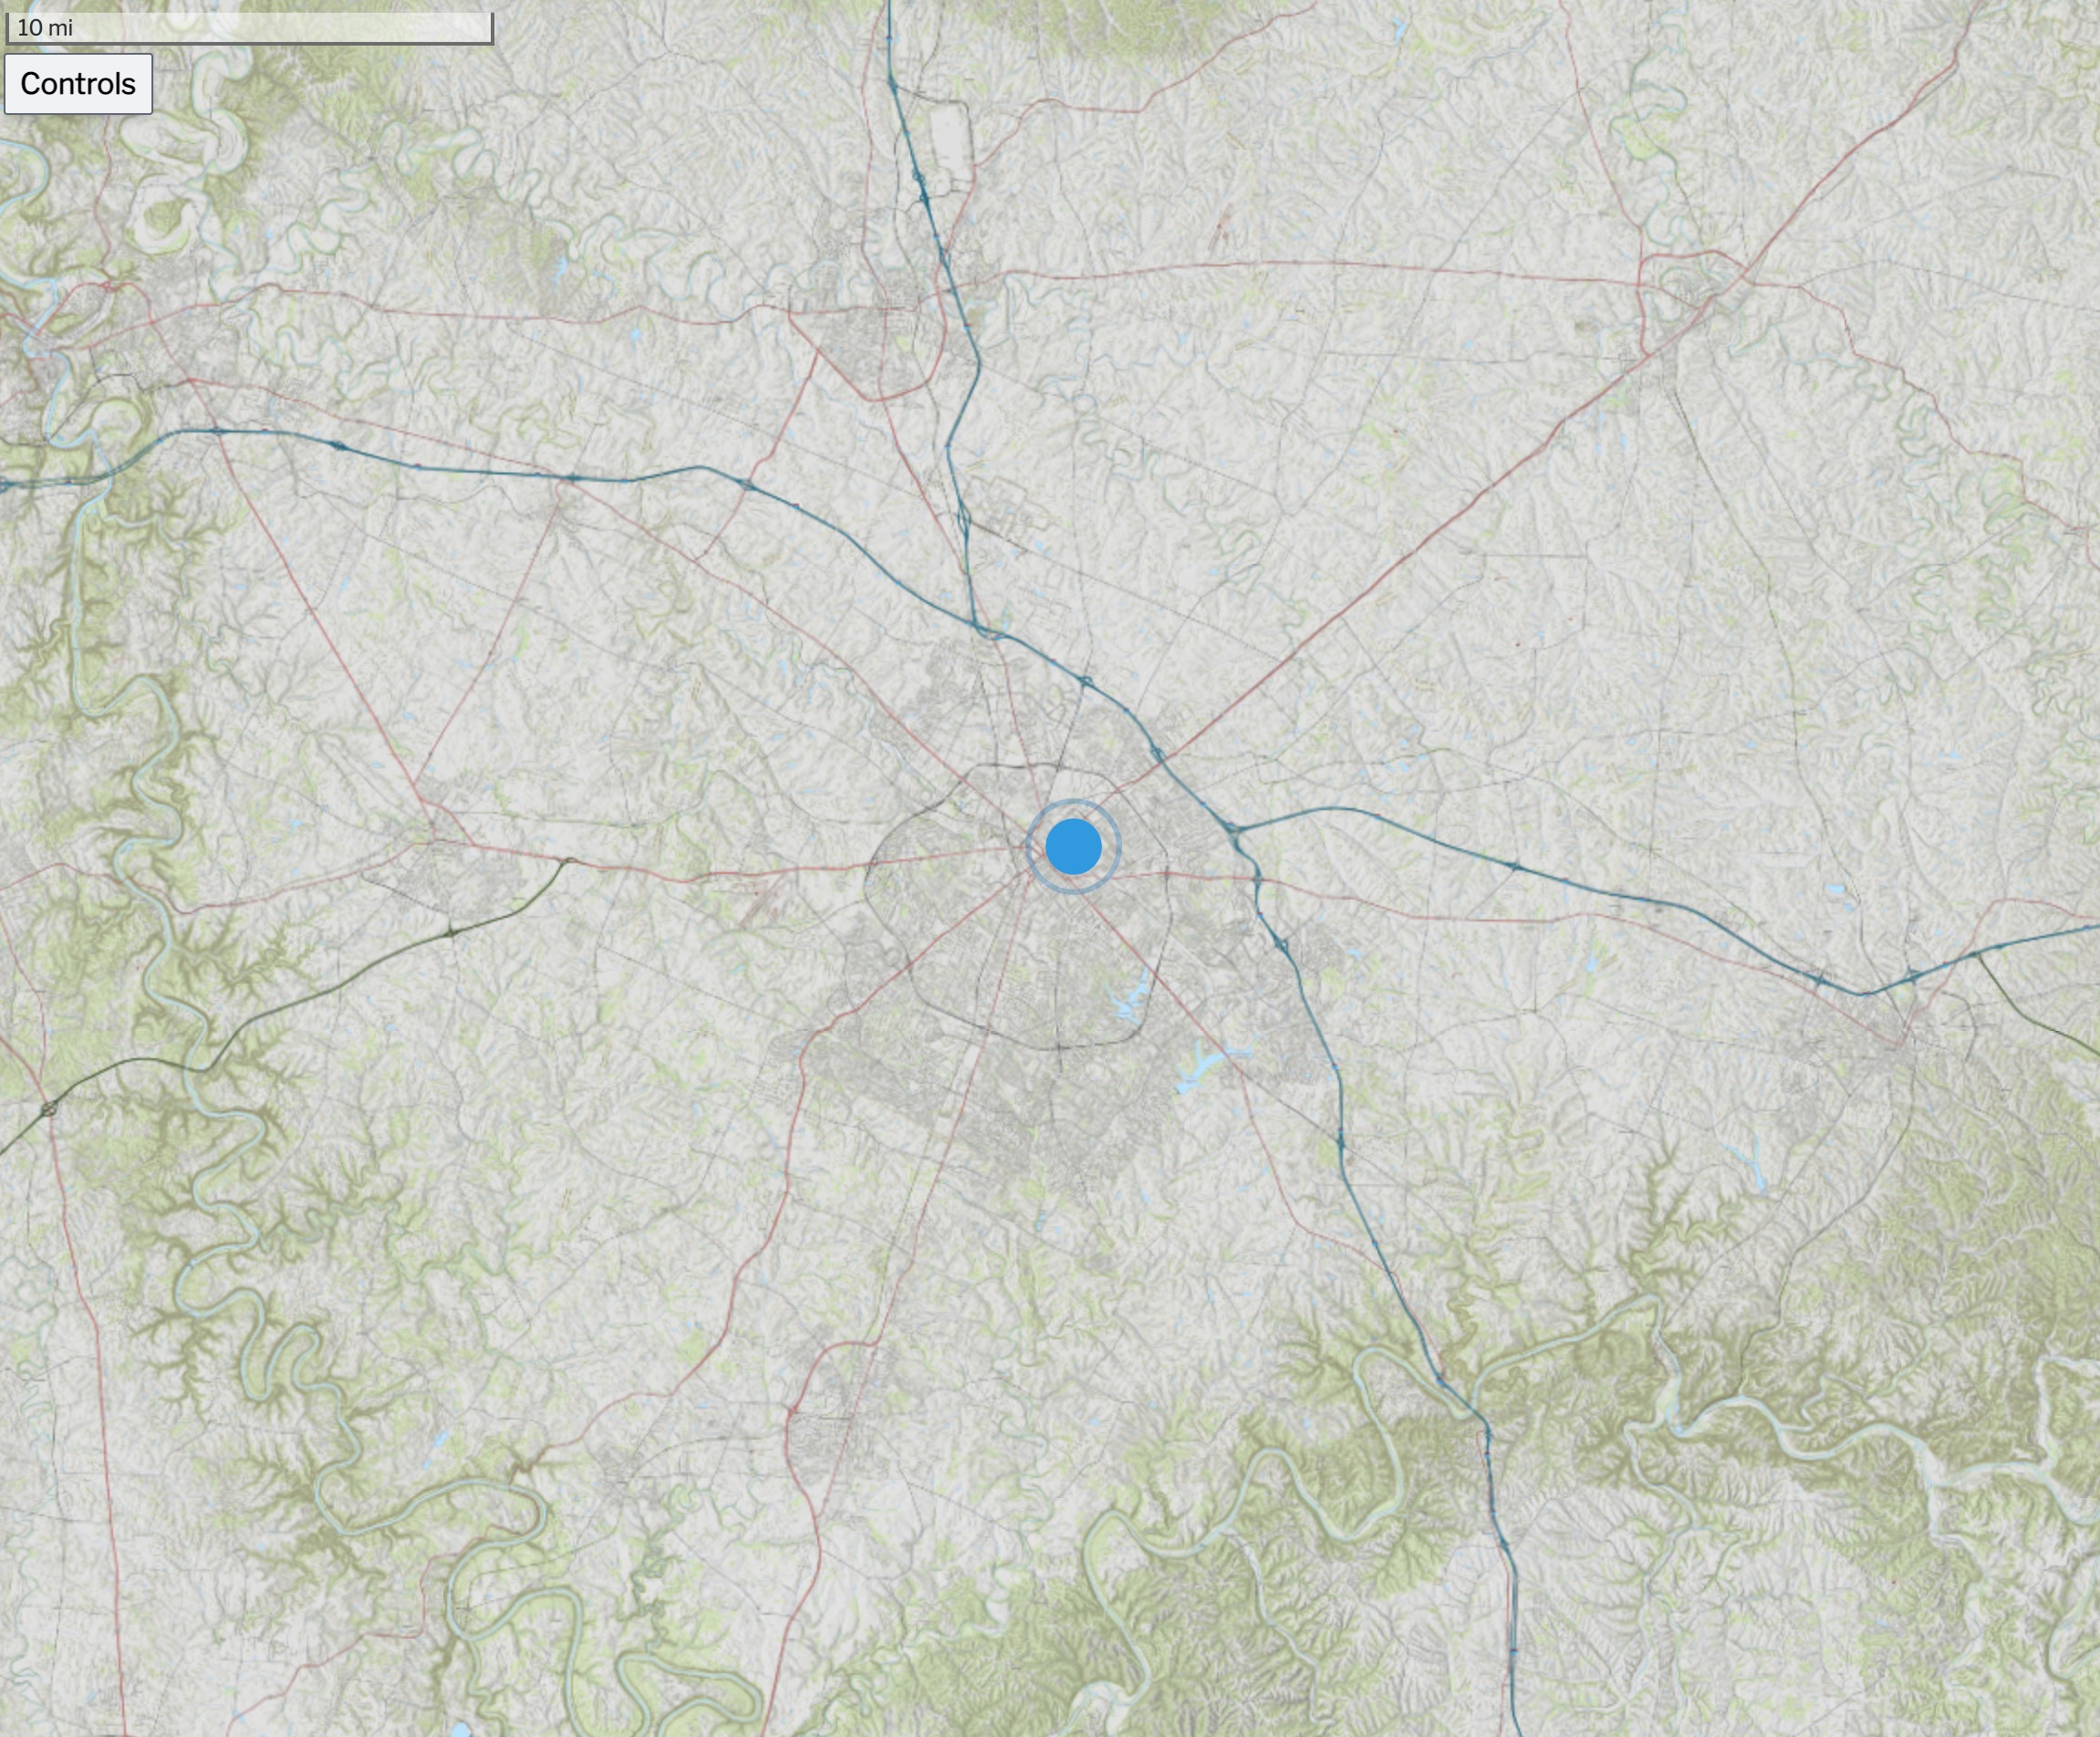 Above is an screen capture of the Kentucky Topo map for the state. Other base maps include, lidar-derived surface models and current GOES-16 imagery.
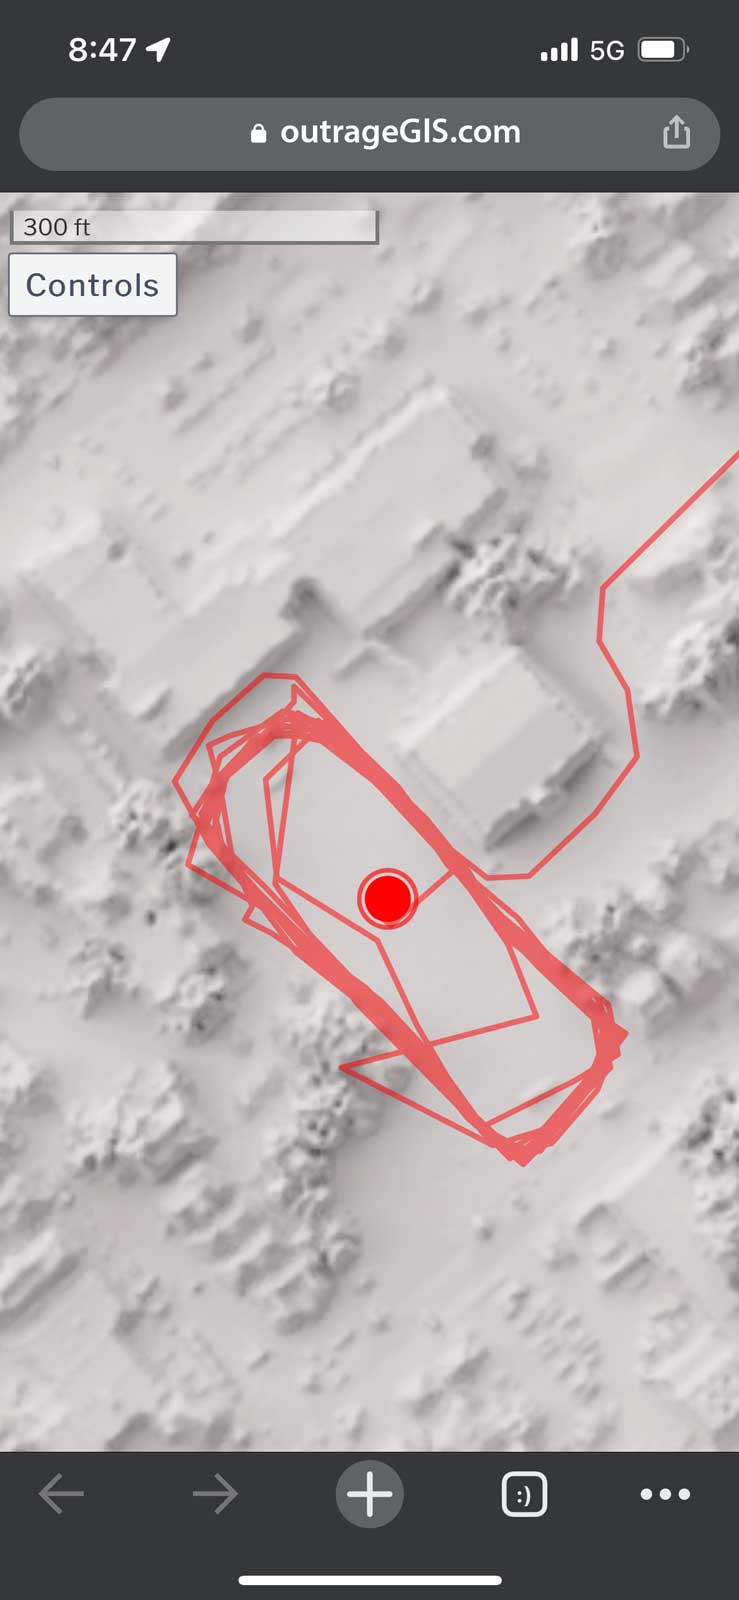 Screen capture of track mapping on a mobile device
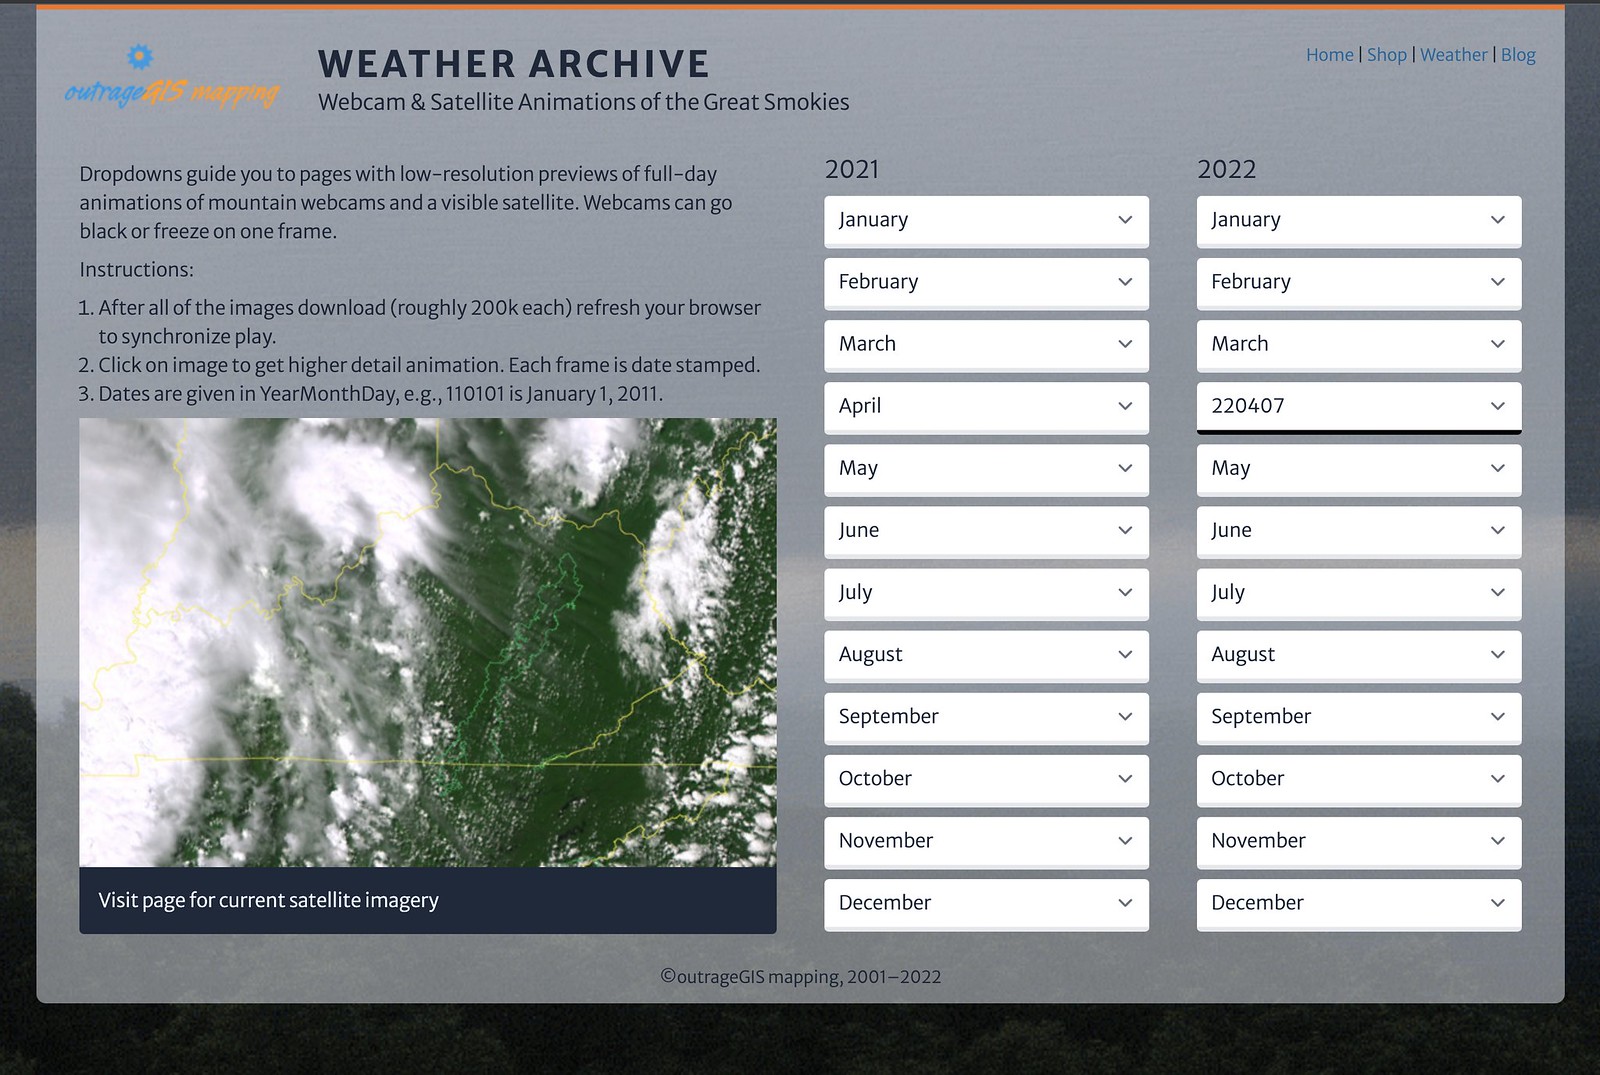
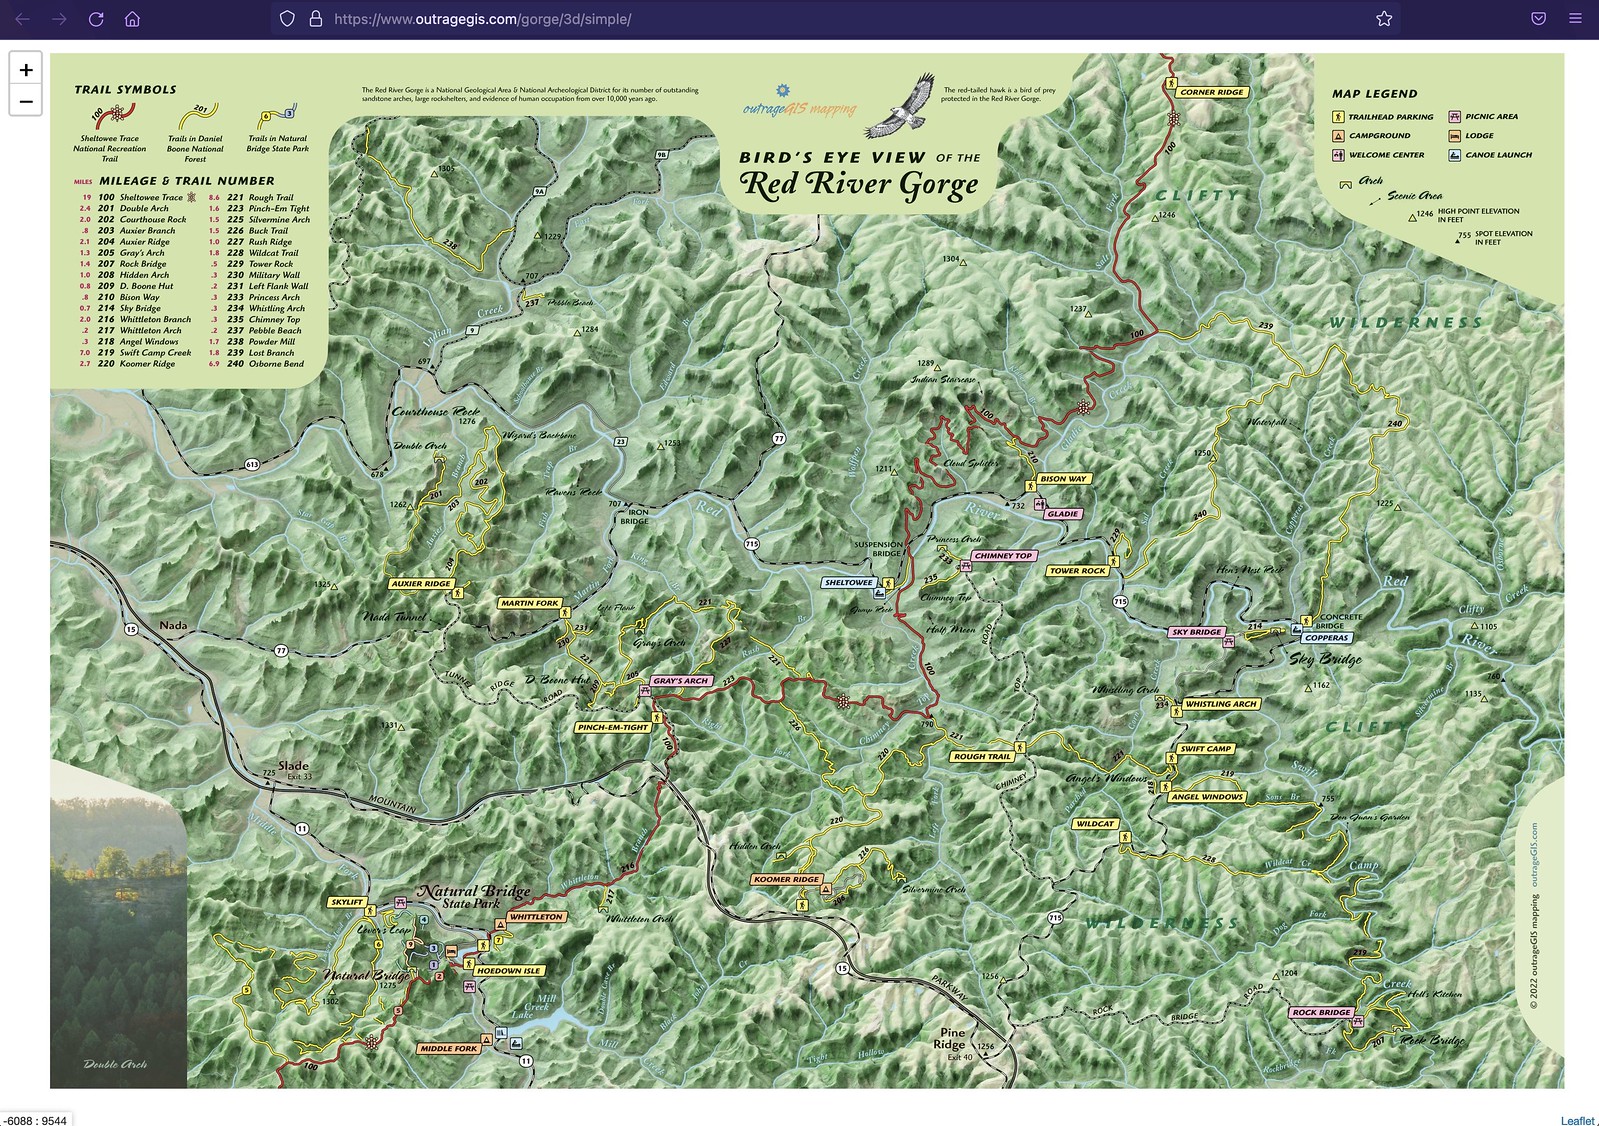


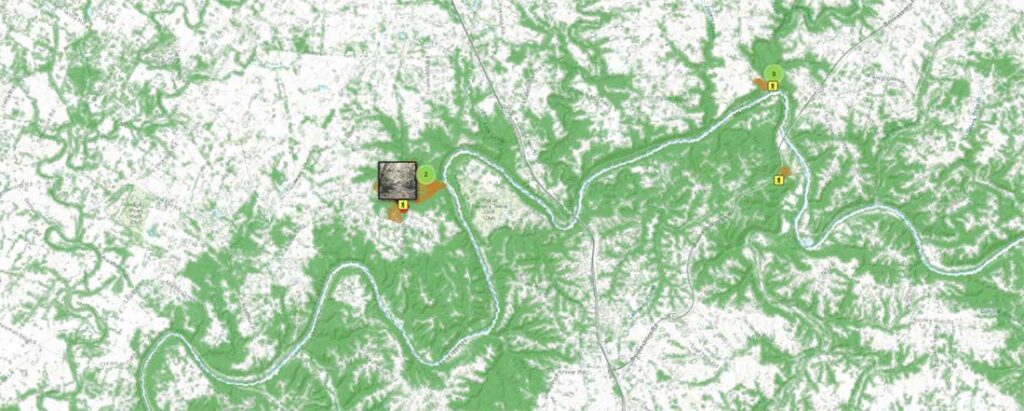
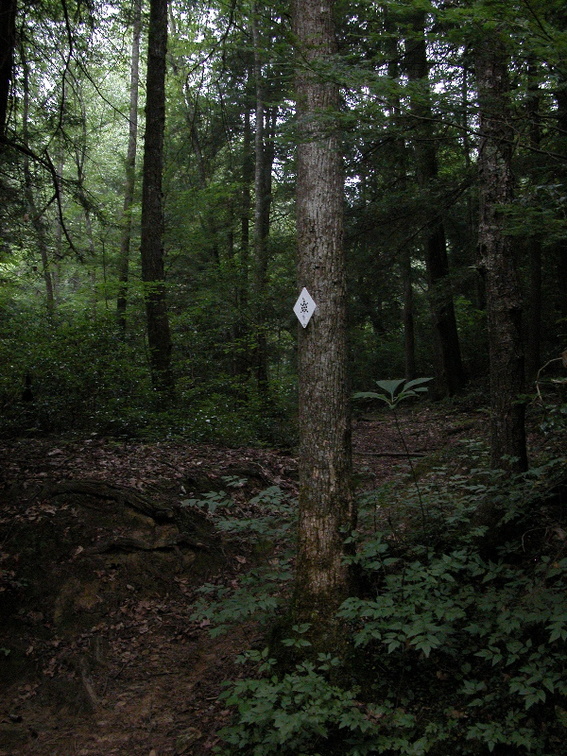
 Sheltowee Trace North map


