KyFromAbove released Phase 3 aerial photography, including oblique imagery, in Spring 2025. The images are available to download and are open data. However, finding the right set of images to download might be a task.
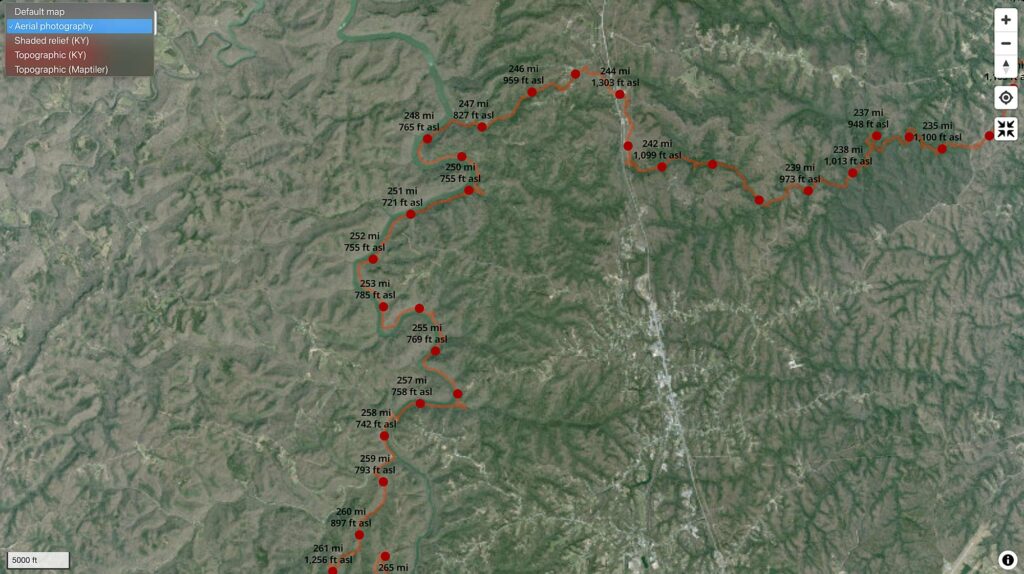
This viewer allows you to zoom in and see the available images for each exposure point, which takes 5 images: one nadir and four at cardinal directions. With 885,789 exposures, that’s over 4.4 million images, which range between 40 MB and 100 MB at roughly 10k x 15k pixels per image.
You can interactively search and download them through this website:
boydx.github.io/phase-3-oblique-centroids
You can interactively
- toggle between oblique image centroids and exposure points (the paper airplane symbol),
- discover the cardinal direction of each exposure,
- place approximate frame extents for each selected oblique centroid,
- interactively download full-resolution images, and
- download a GeoJSON of these polygons with metadata in its attributes.
The oblique images are hosted as TIFFs on a KyFromAbove AWS S3 bucket and can be previewed on mobile devices using modern browsers.
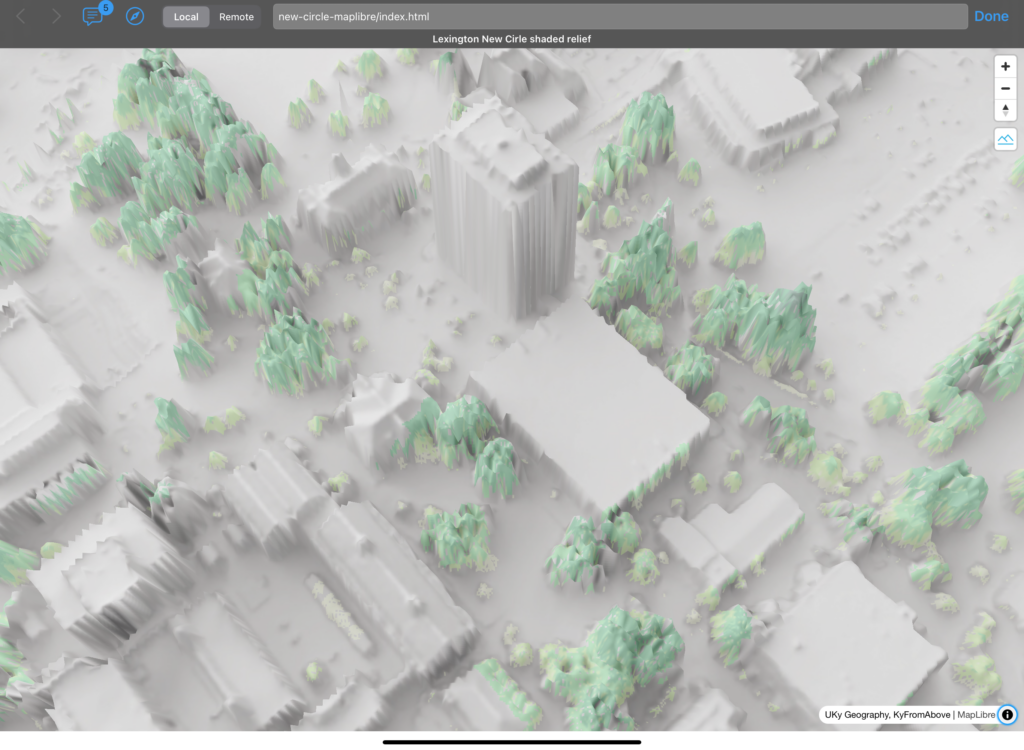
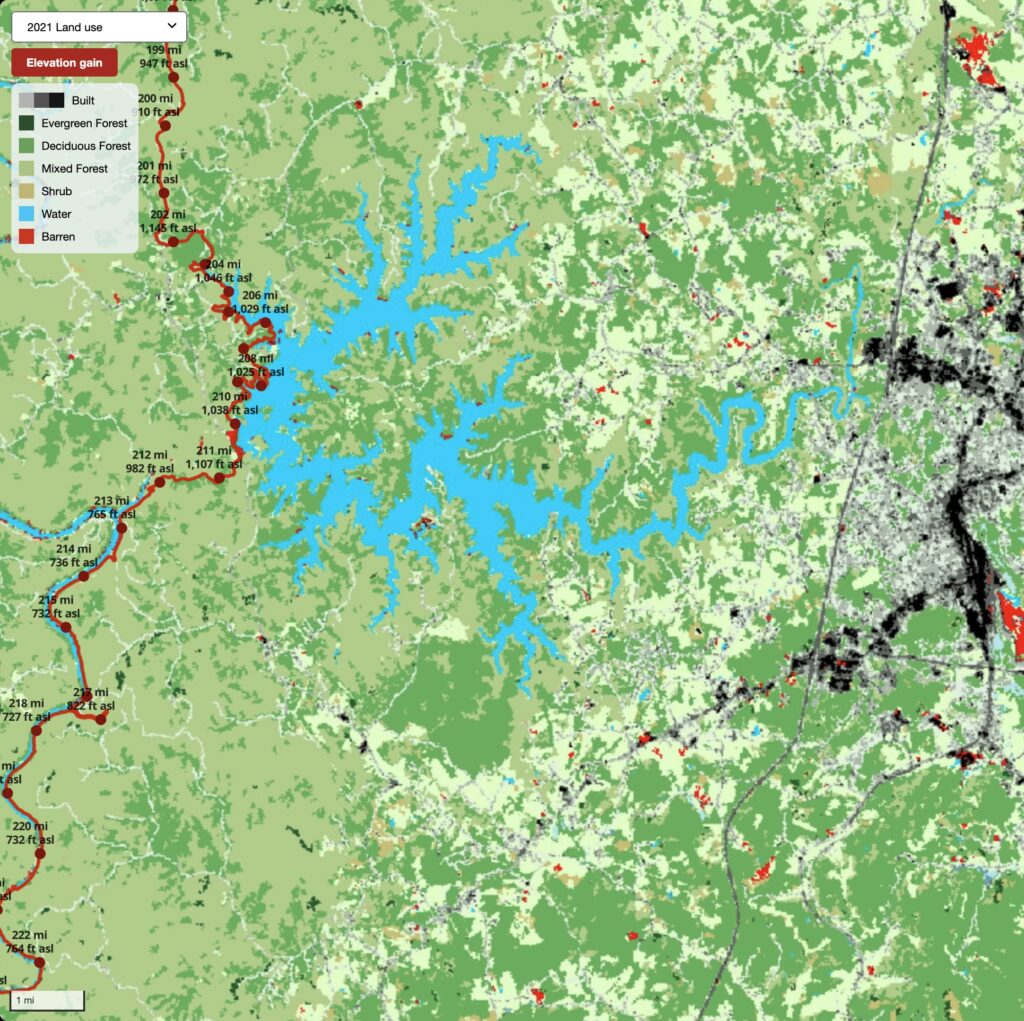
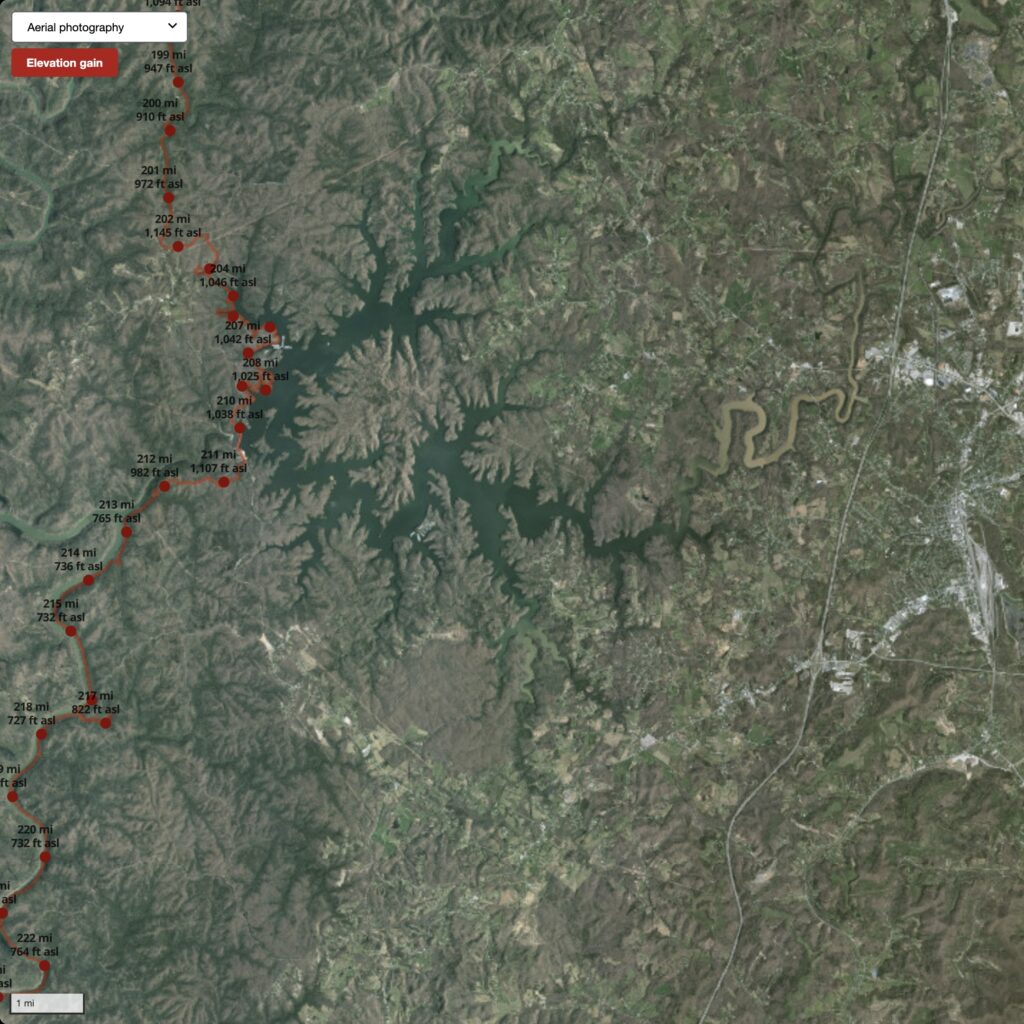
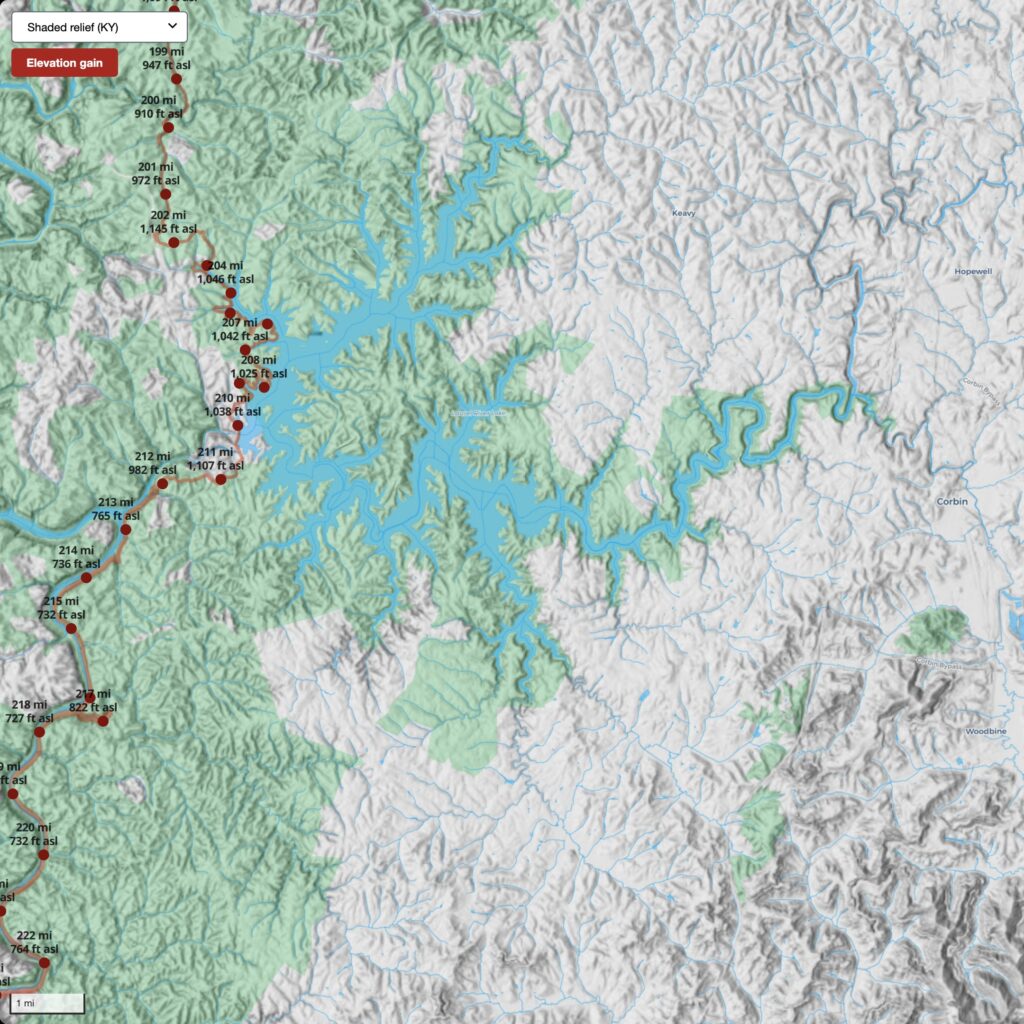
Below are some screenshots of the viewer and oblique images.
 Oblique of Frankfort
 Viewer interface
 Viewer interface
 Viewer interface
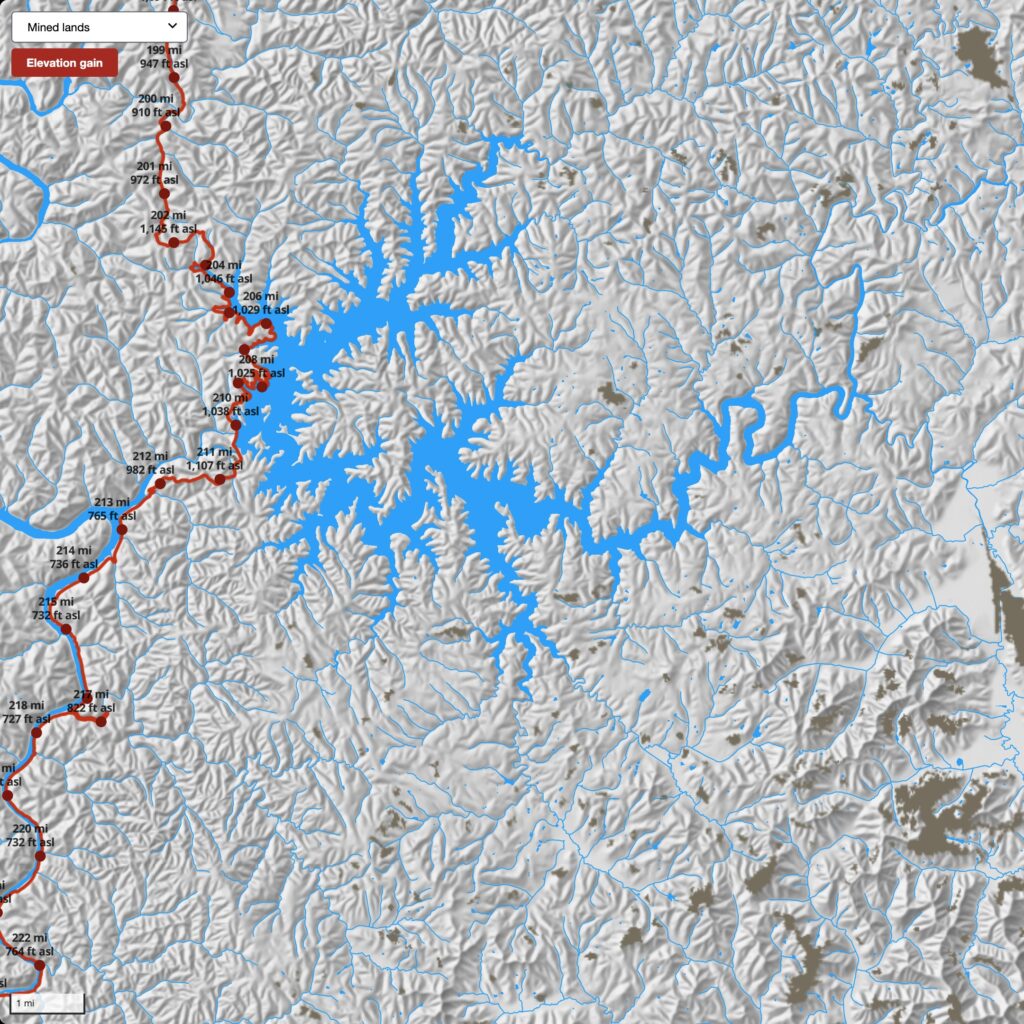
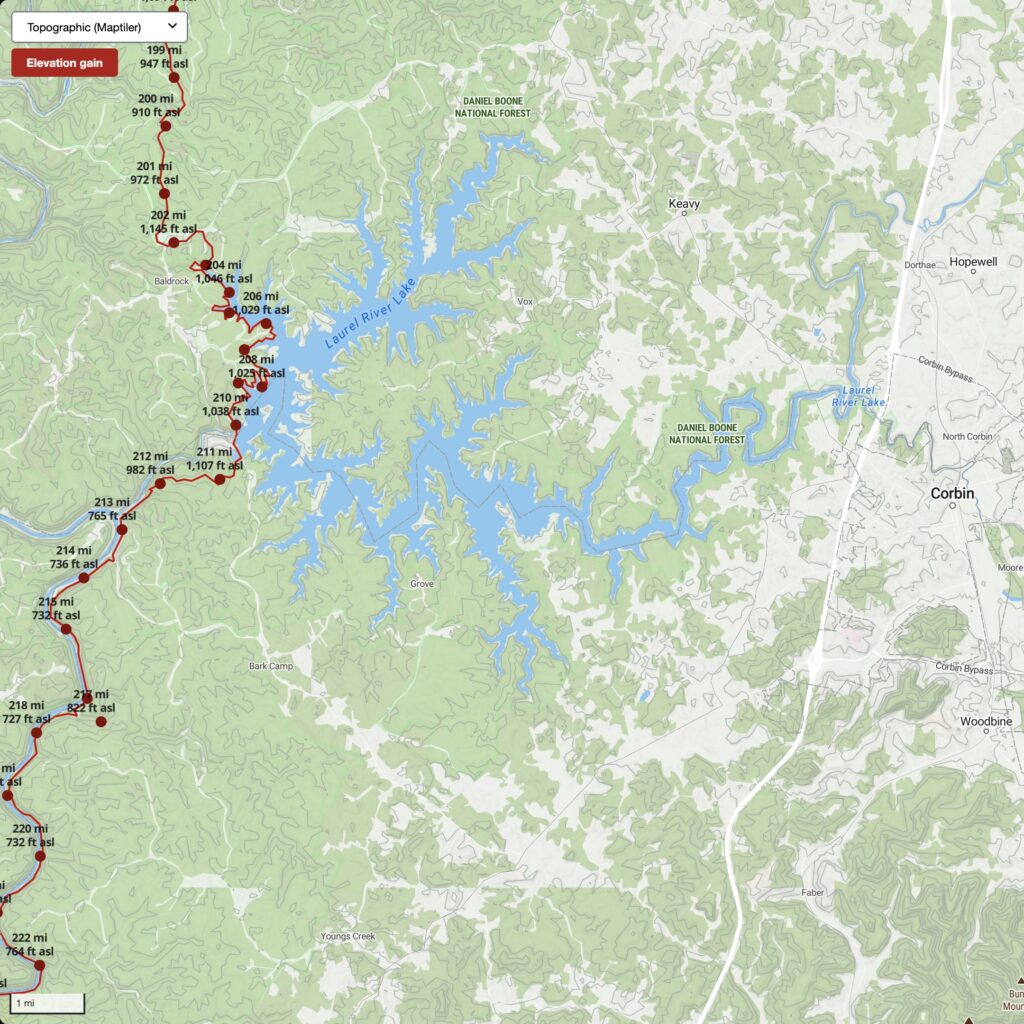
 Oblique of Laurel Lake
 Search by flight and shot ID
 Attributes of image footprint centroid
 Viewer interface
 Viewer interface
 Viewer interface


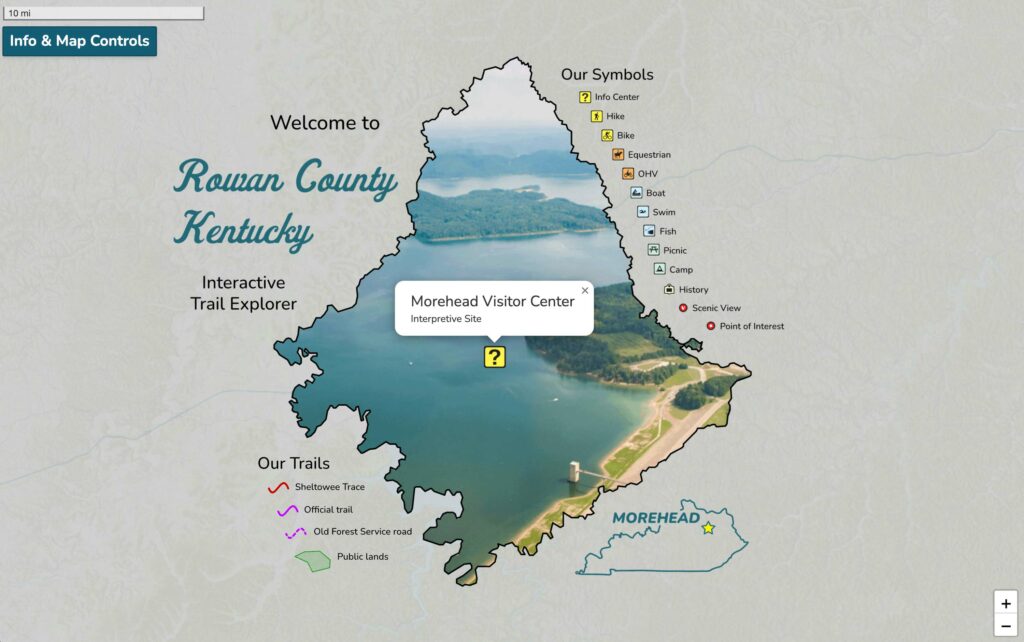
 KyFromAbove Data Explorer