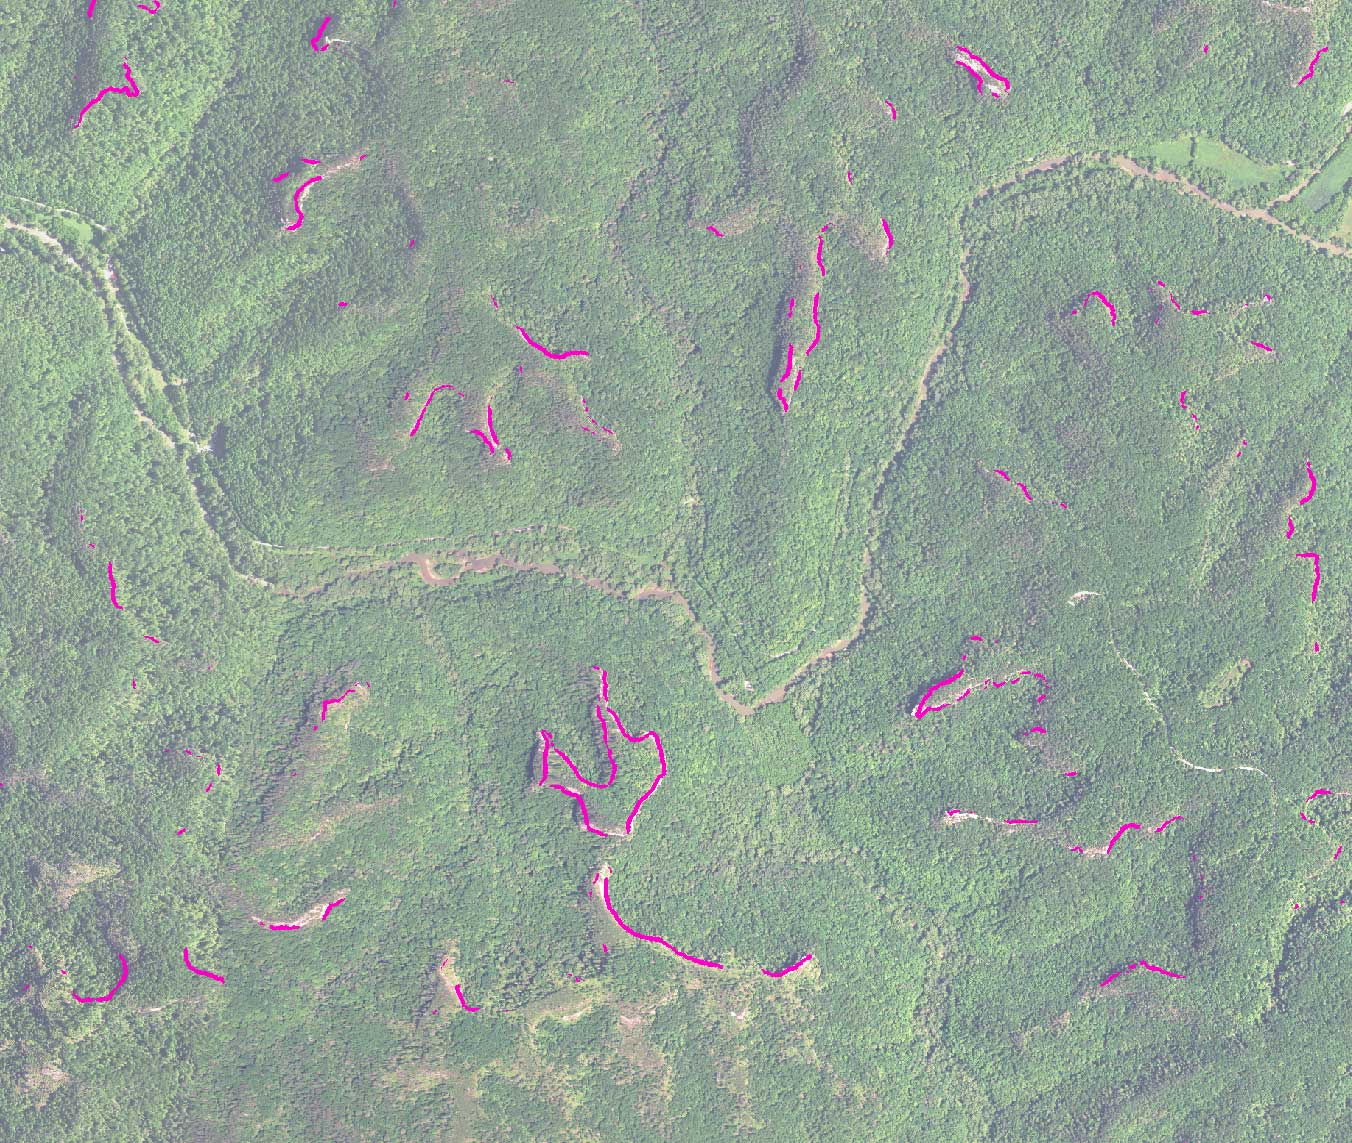
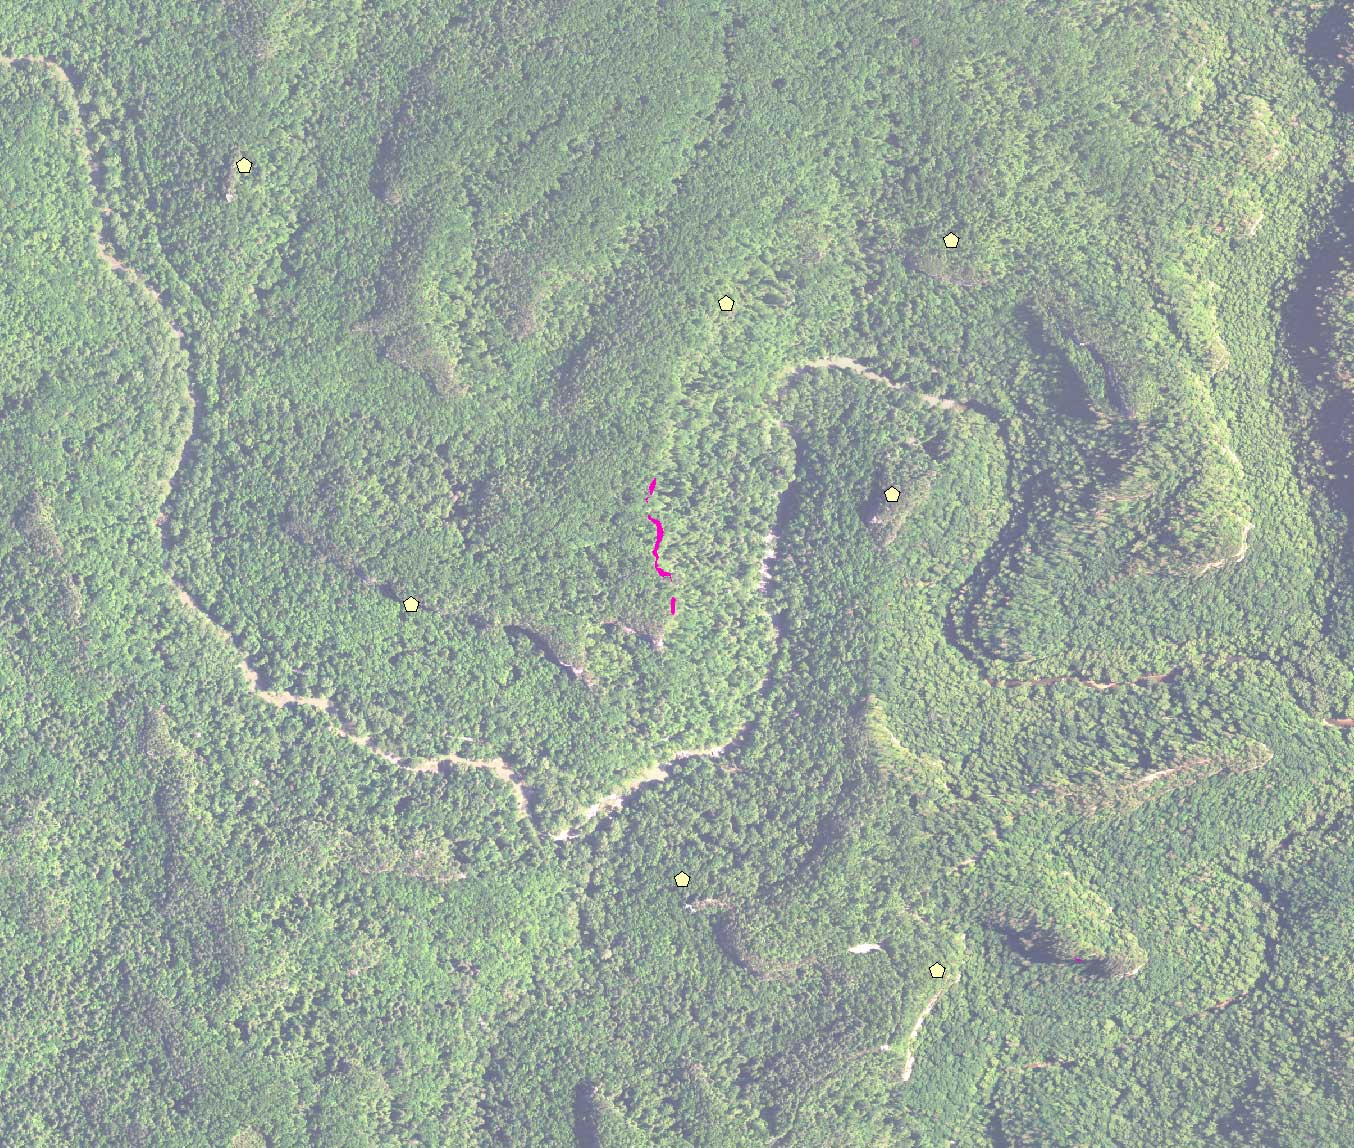
Took an afternoon to GPS map the trail network at the West Sixth farm outside of Frankfort, Kentucky. You can download the map here https://www.westsixth.com/farmtrailmap.
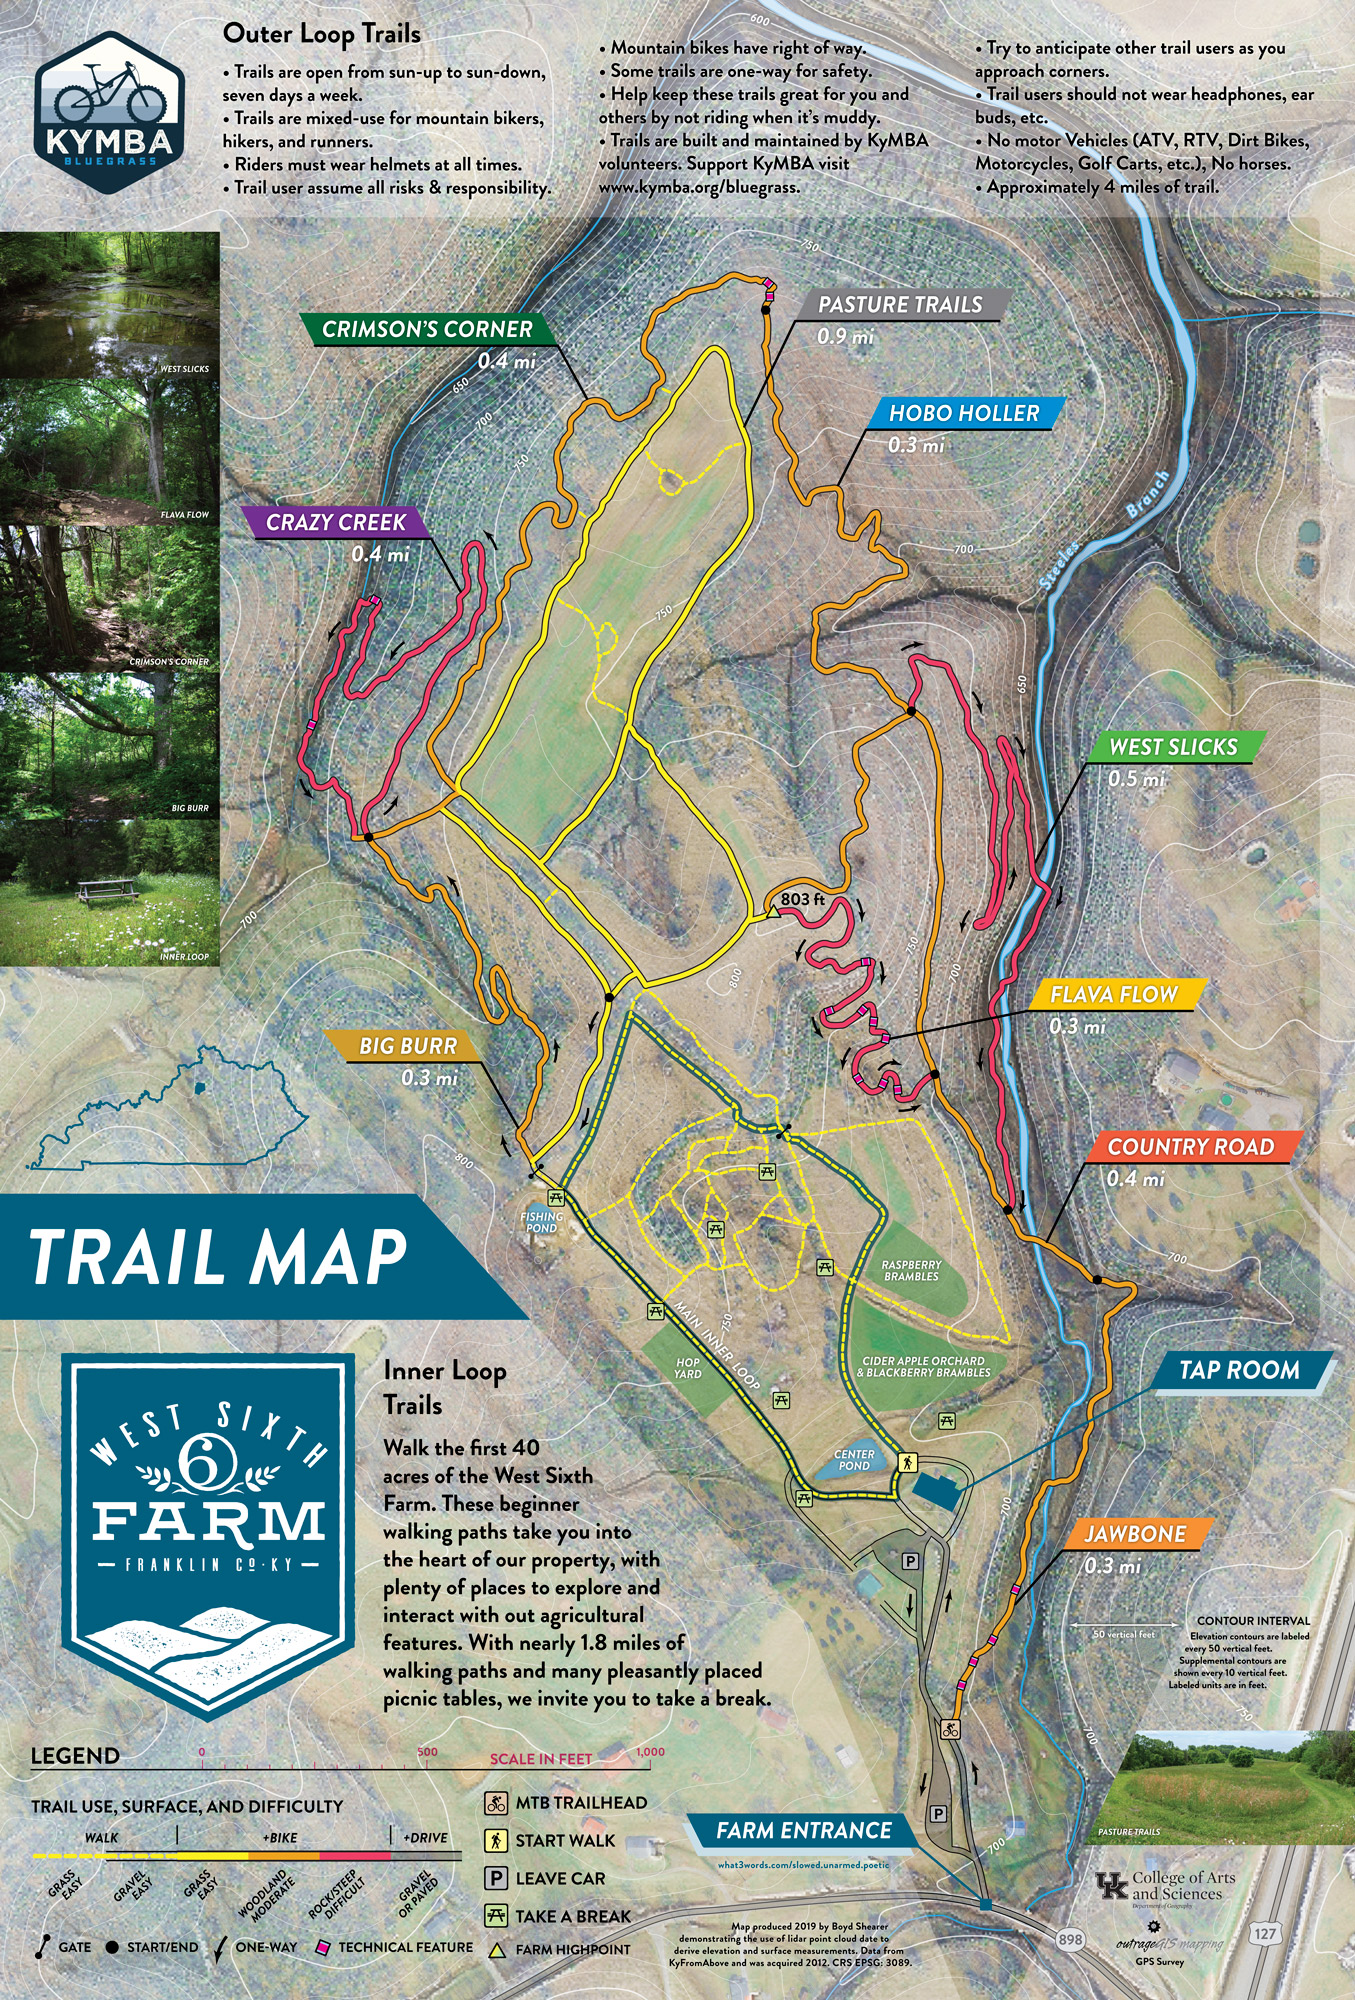
The farm maintains a mountain bike trail with technical features and one-way trails. Enjoy a ride and then a brew.
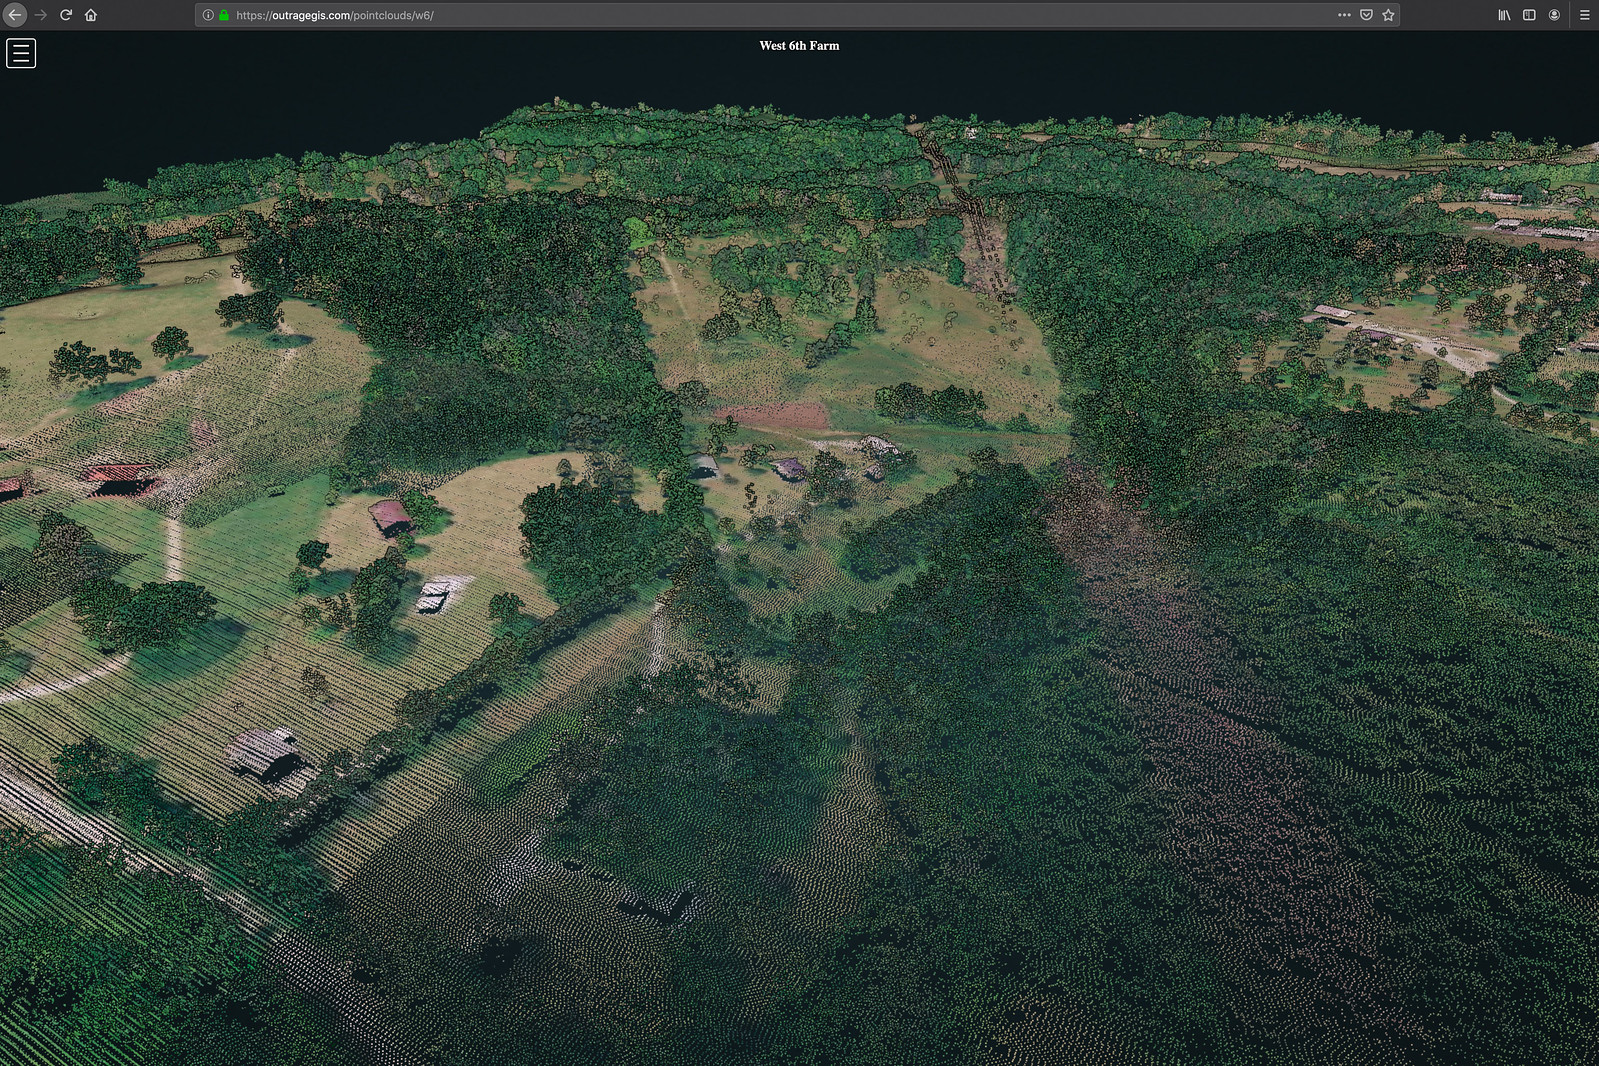
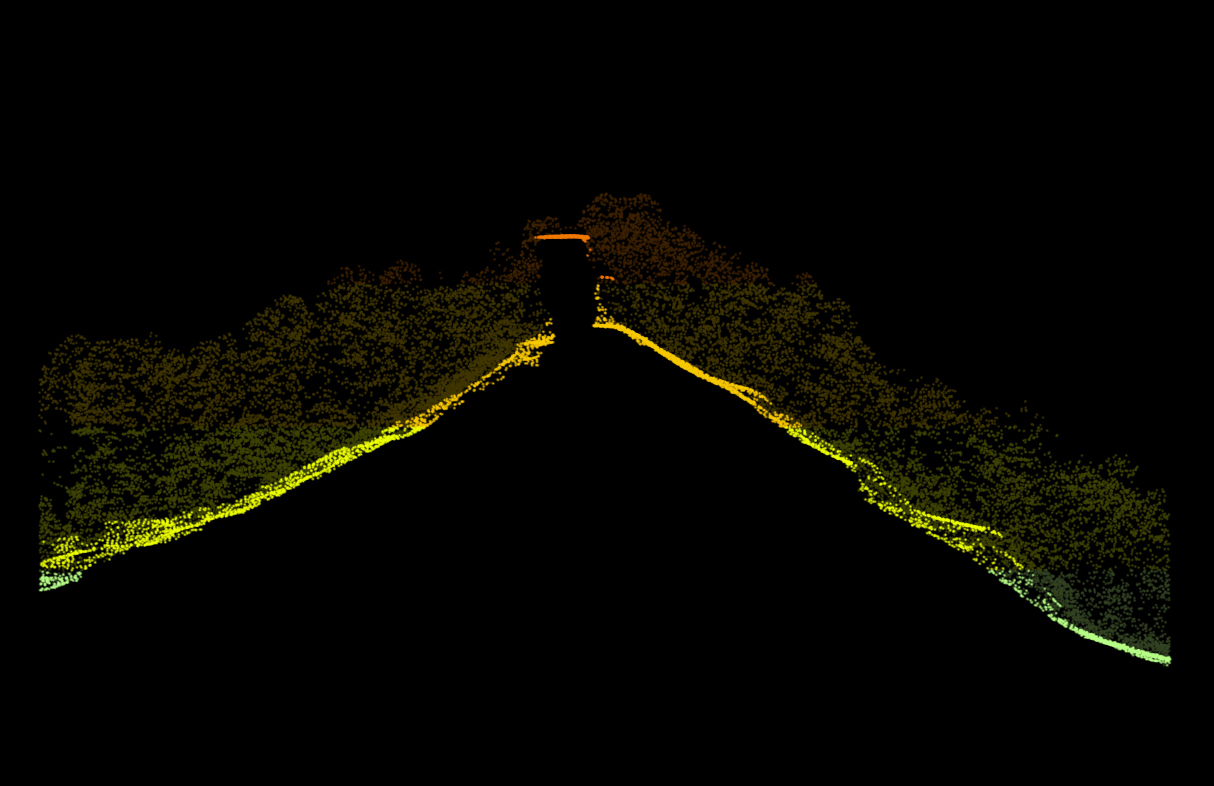
As an experiment, we added a 3D map from a lidar point cloud viewable here: https://outragegis.com/pointclouds/w6.