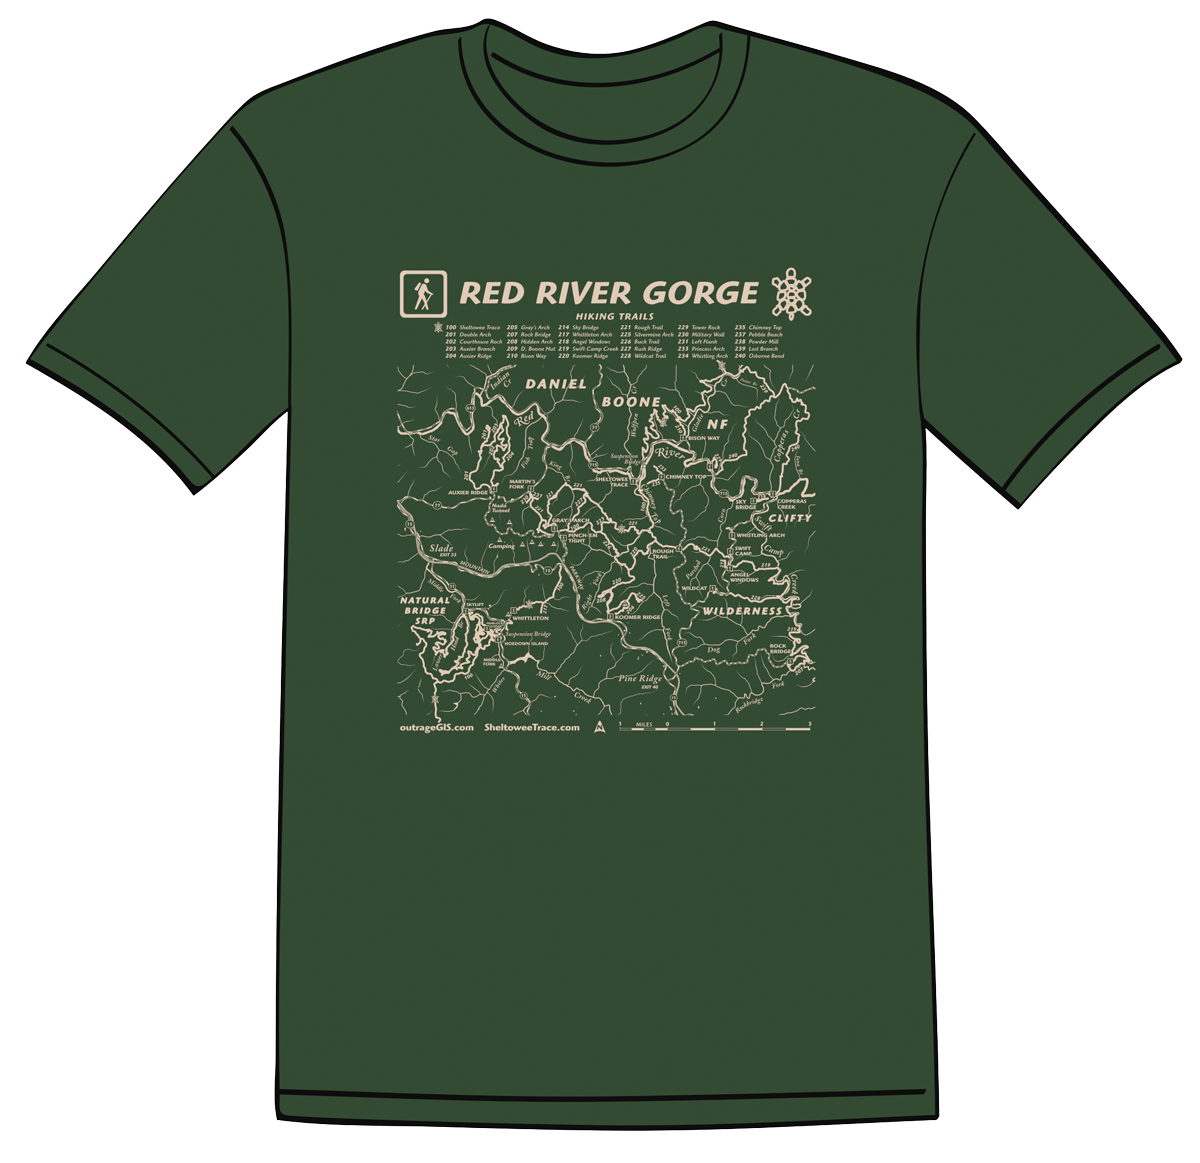
Sheltowee Trace South map
Size: medium
Fee: yes
Accommodations: 45 sites
Amenities: Bath house, electricity, potable water, waste disposal
Open April through November
Ownership: National Park Service, BSFRRA
Buy Sheltowee Trace South Trail Map
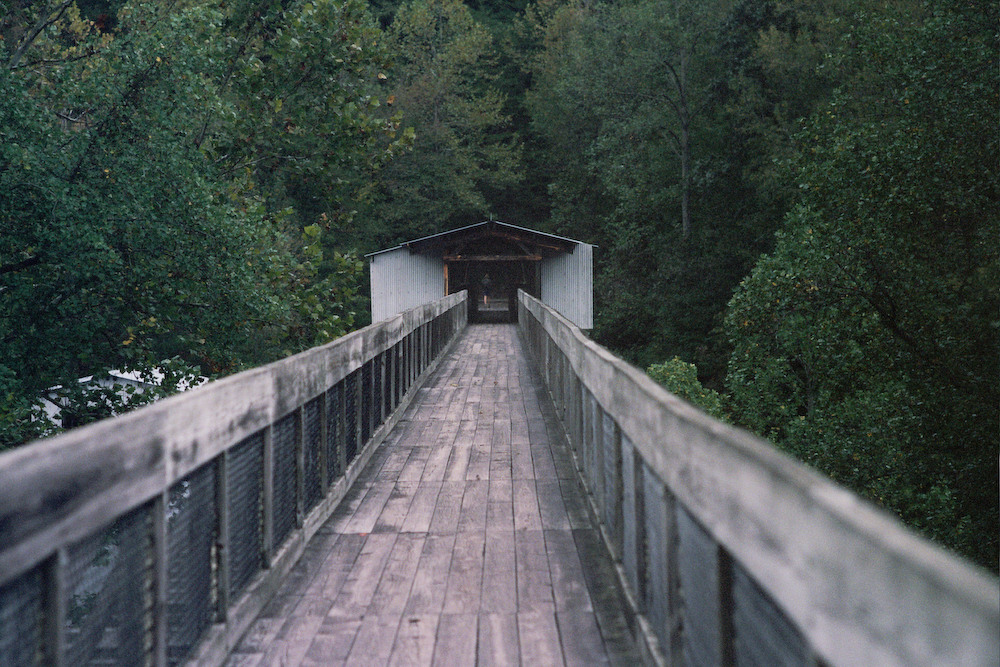
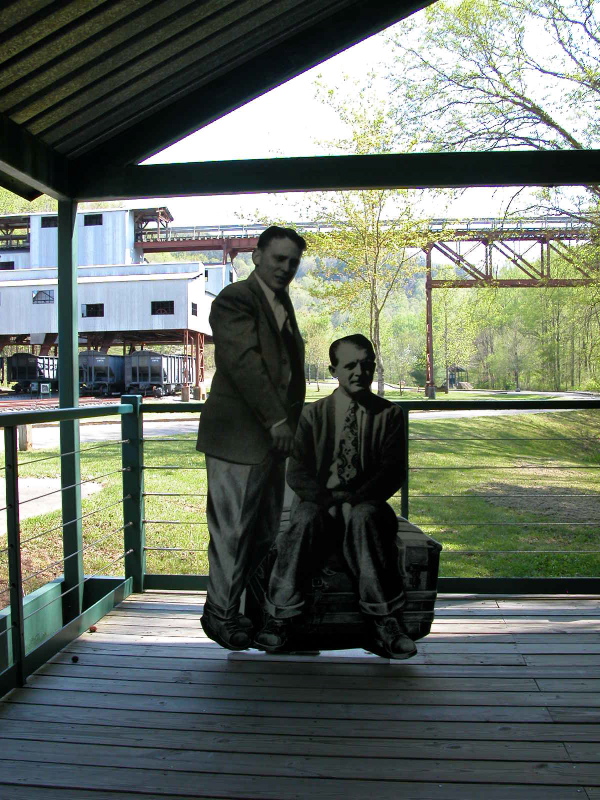
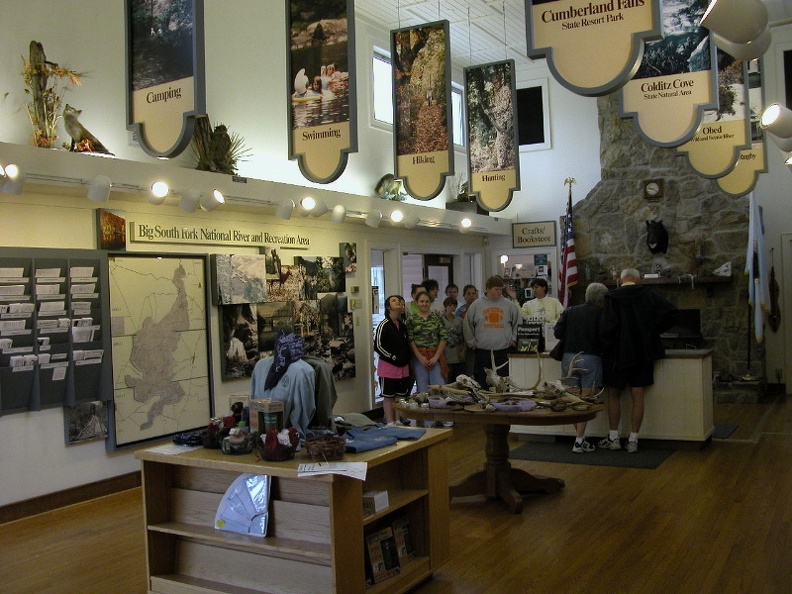
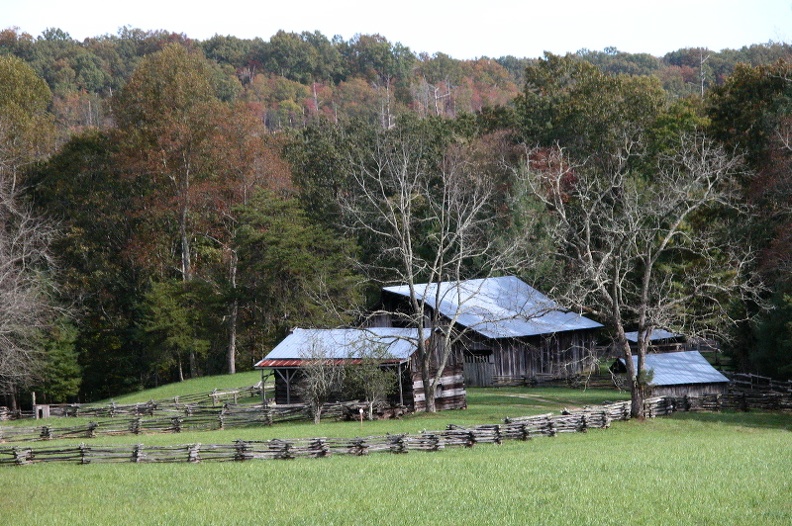
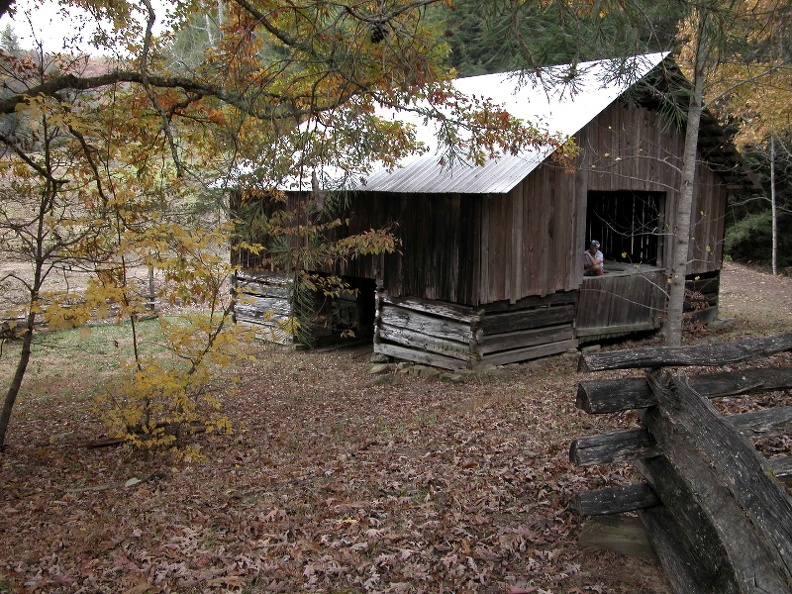
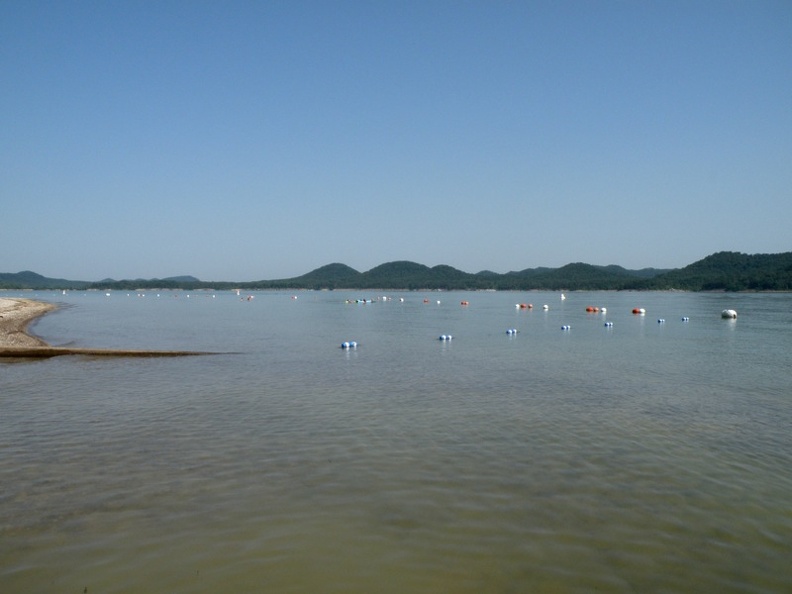
The quiet, shady Blue Heron Campground is a short hike or drive from an open-air museum, the Blue Heron Mining Community. The exhibits bring to life the community that operated a coal mine along the river from 1937 until 1962. A restored bridge crosses the Big South Fork and gives hikers wonderful overlooks along the river. A six-mile hiking loop begins near the campground to access the museum. During summer weekends, a passenger does day excursion from the NPS Stearns visitor center to the museum.