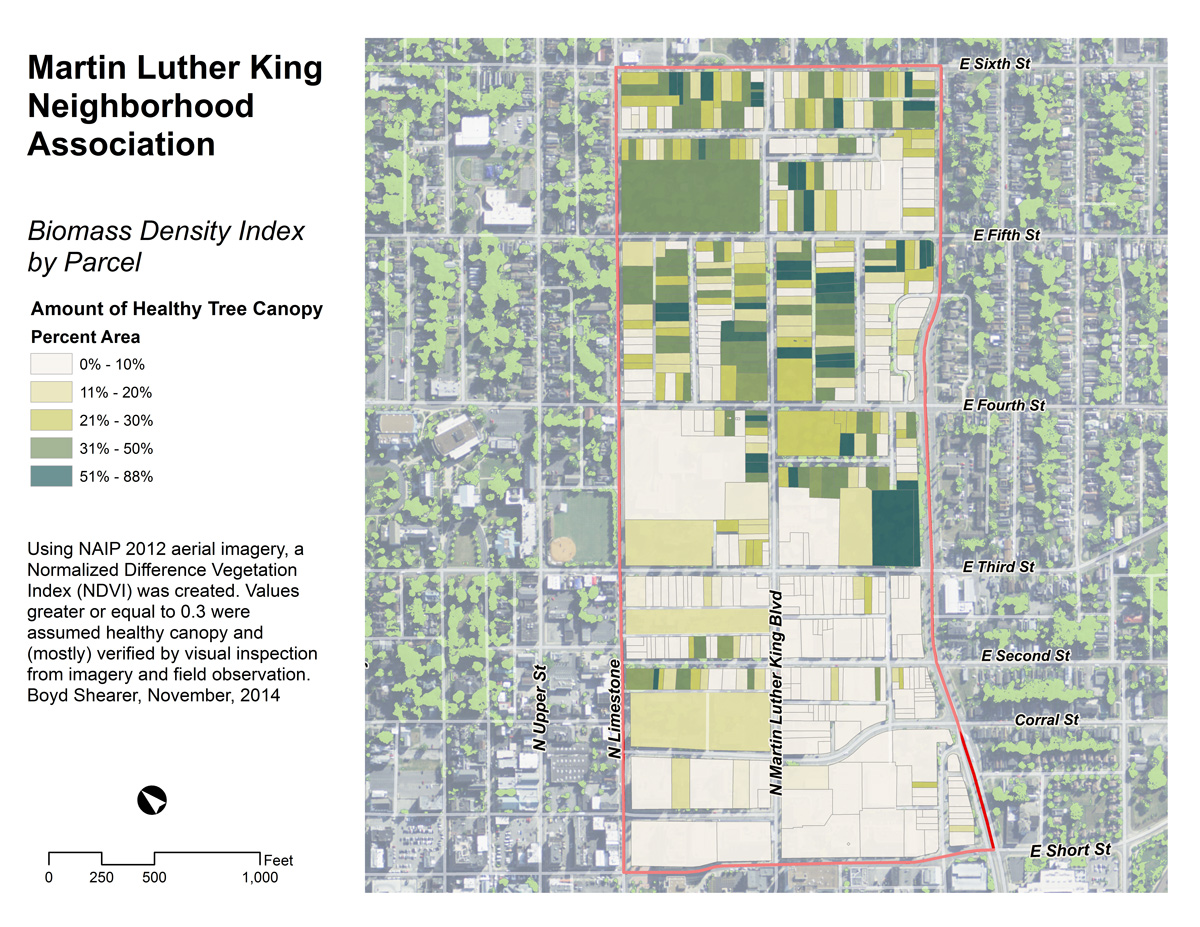
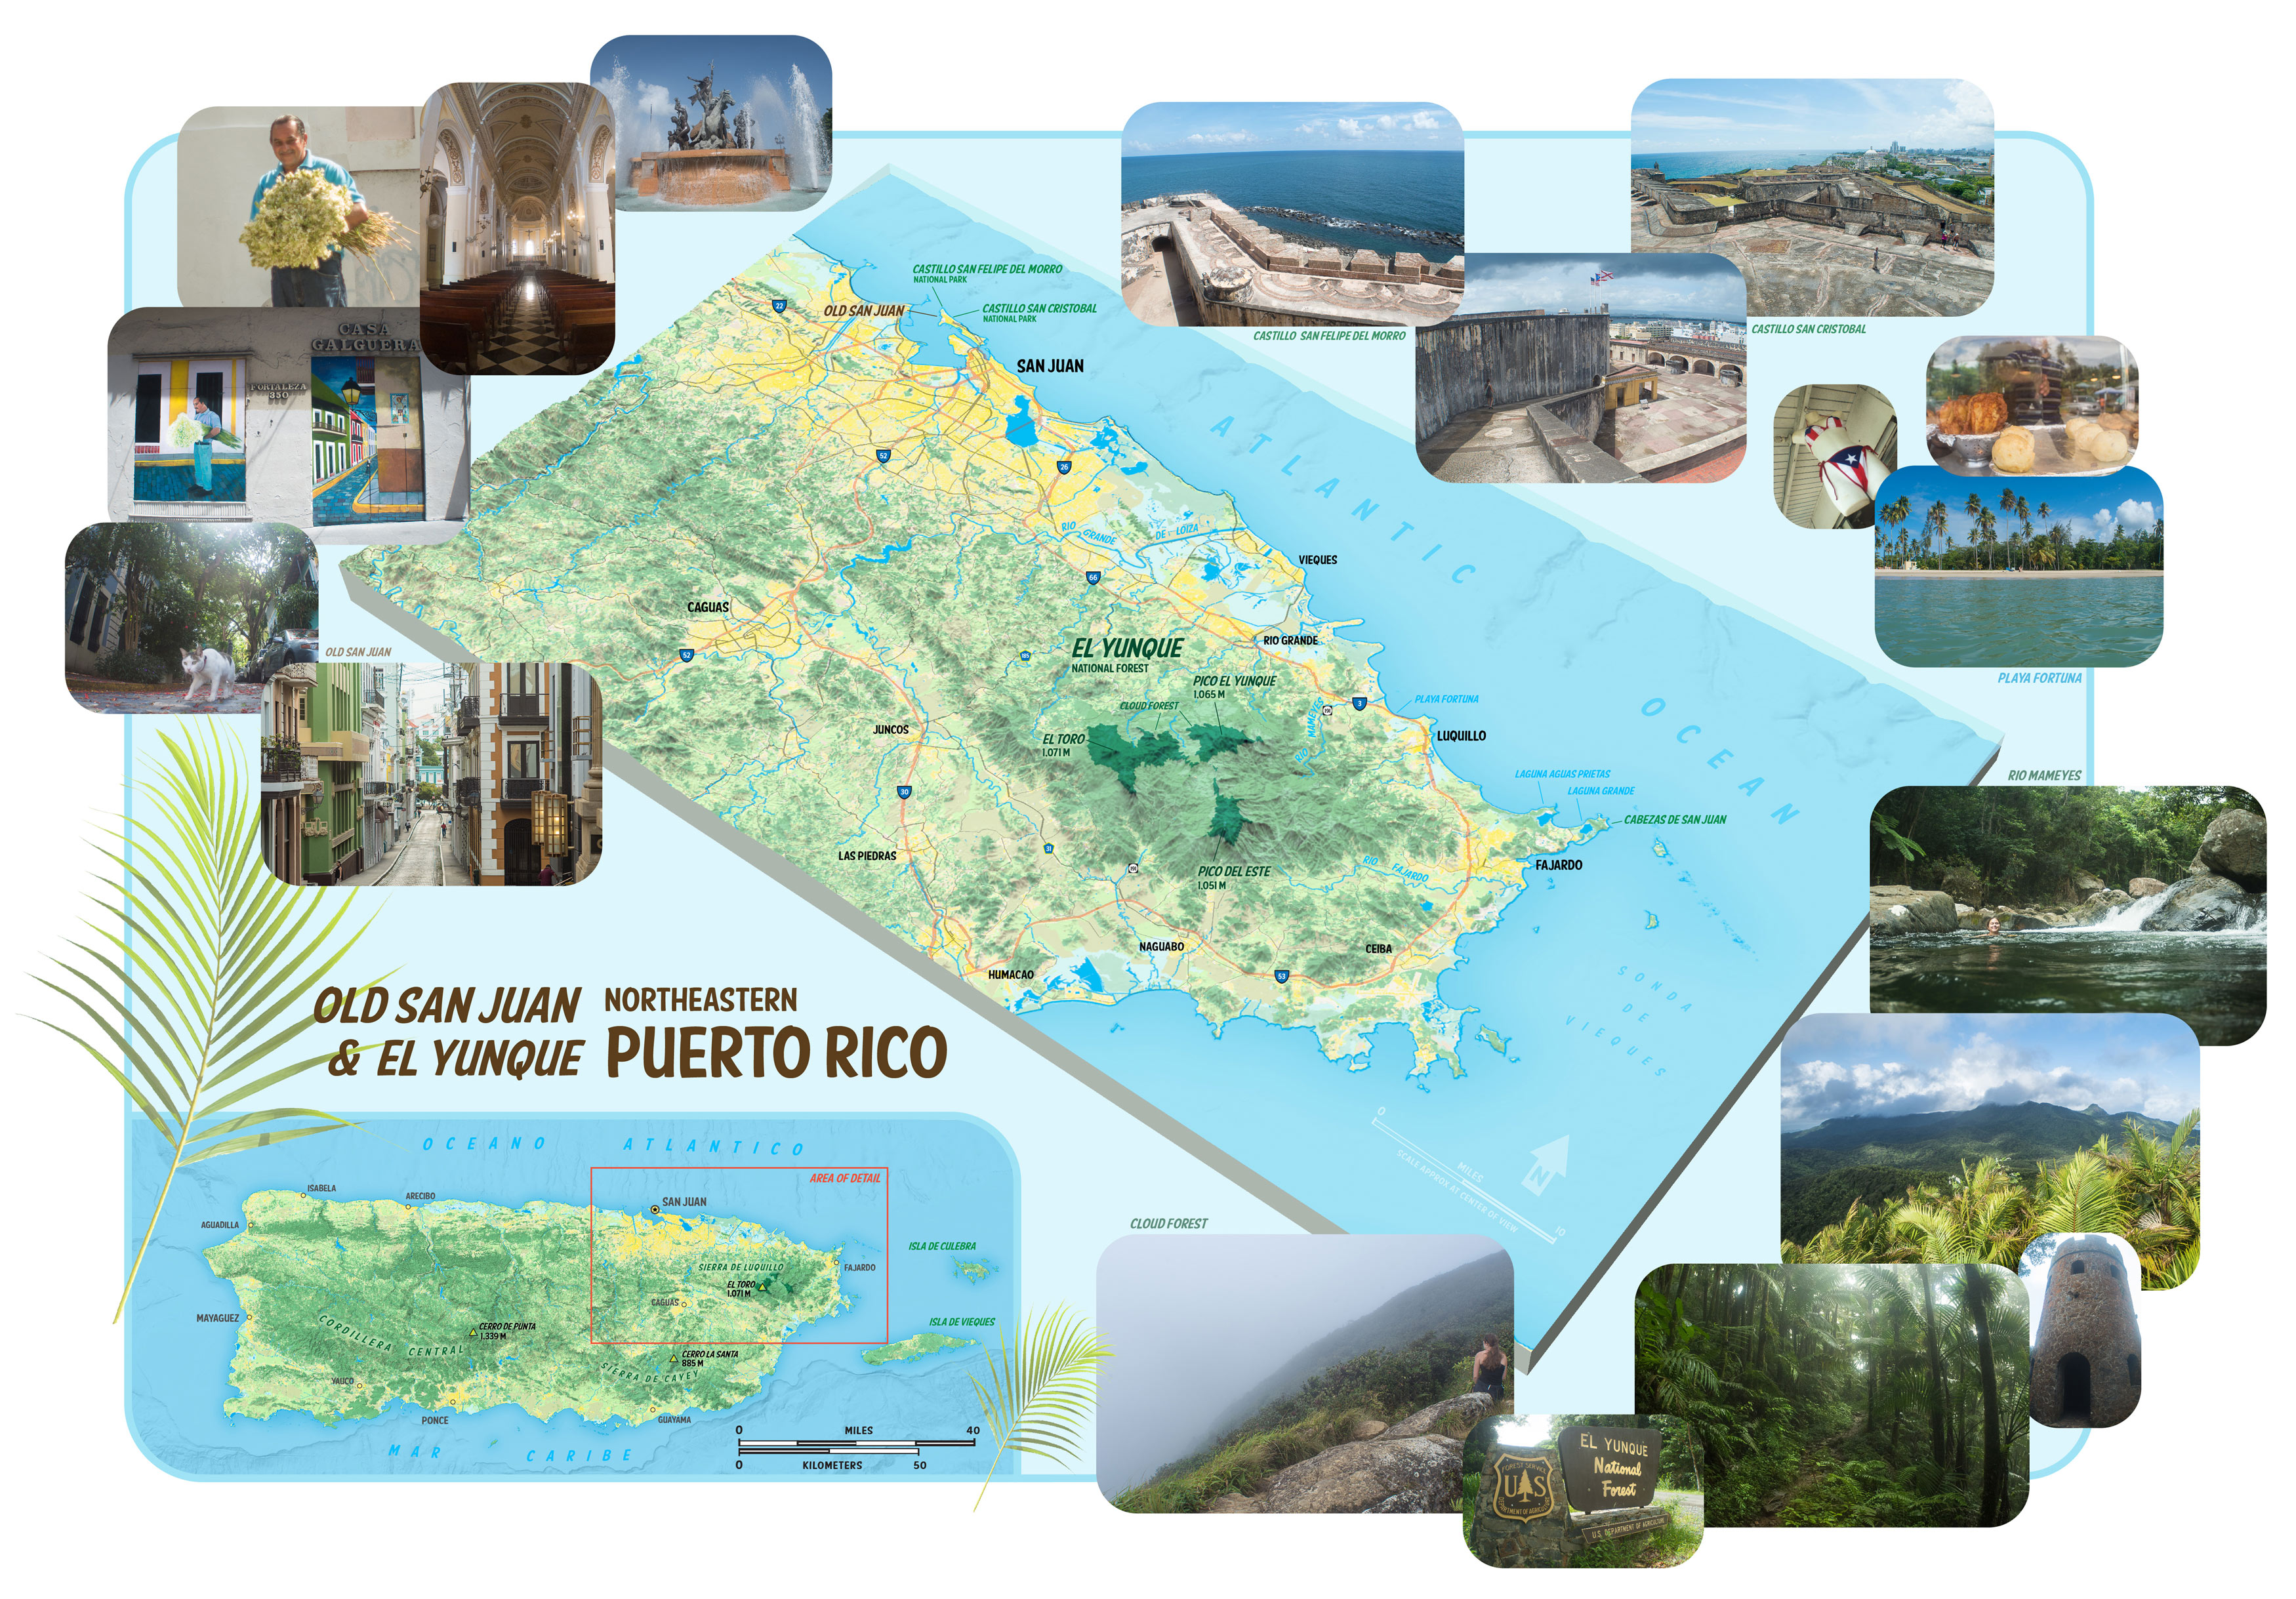
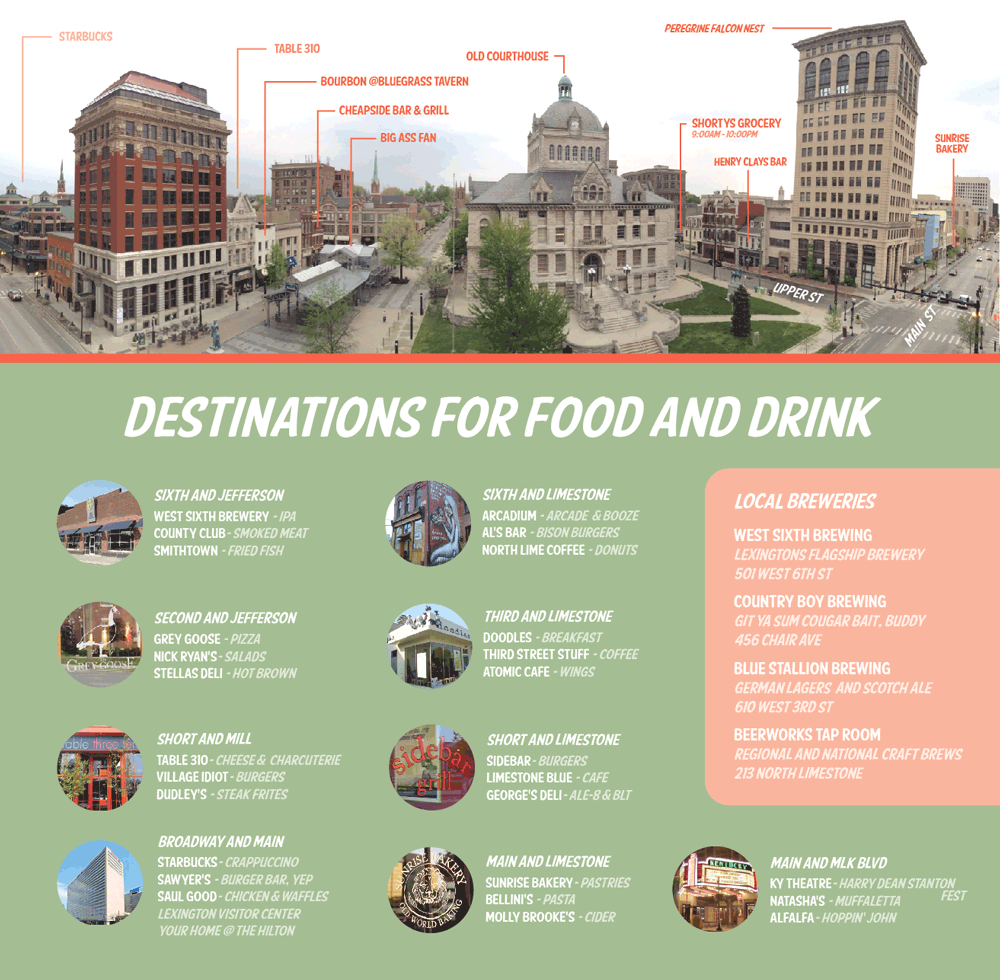
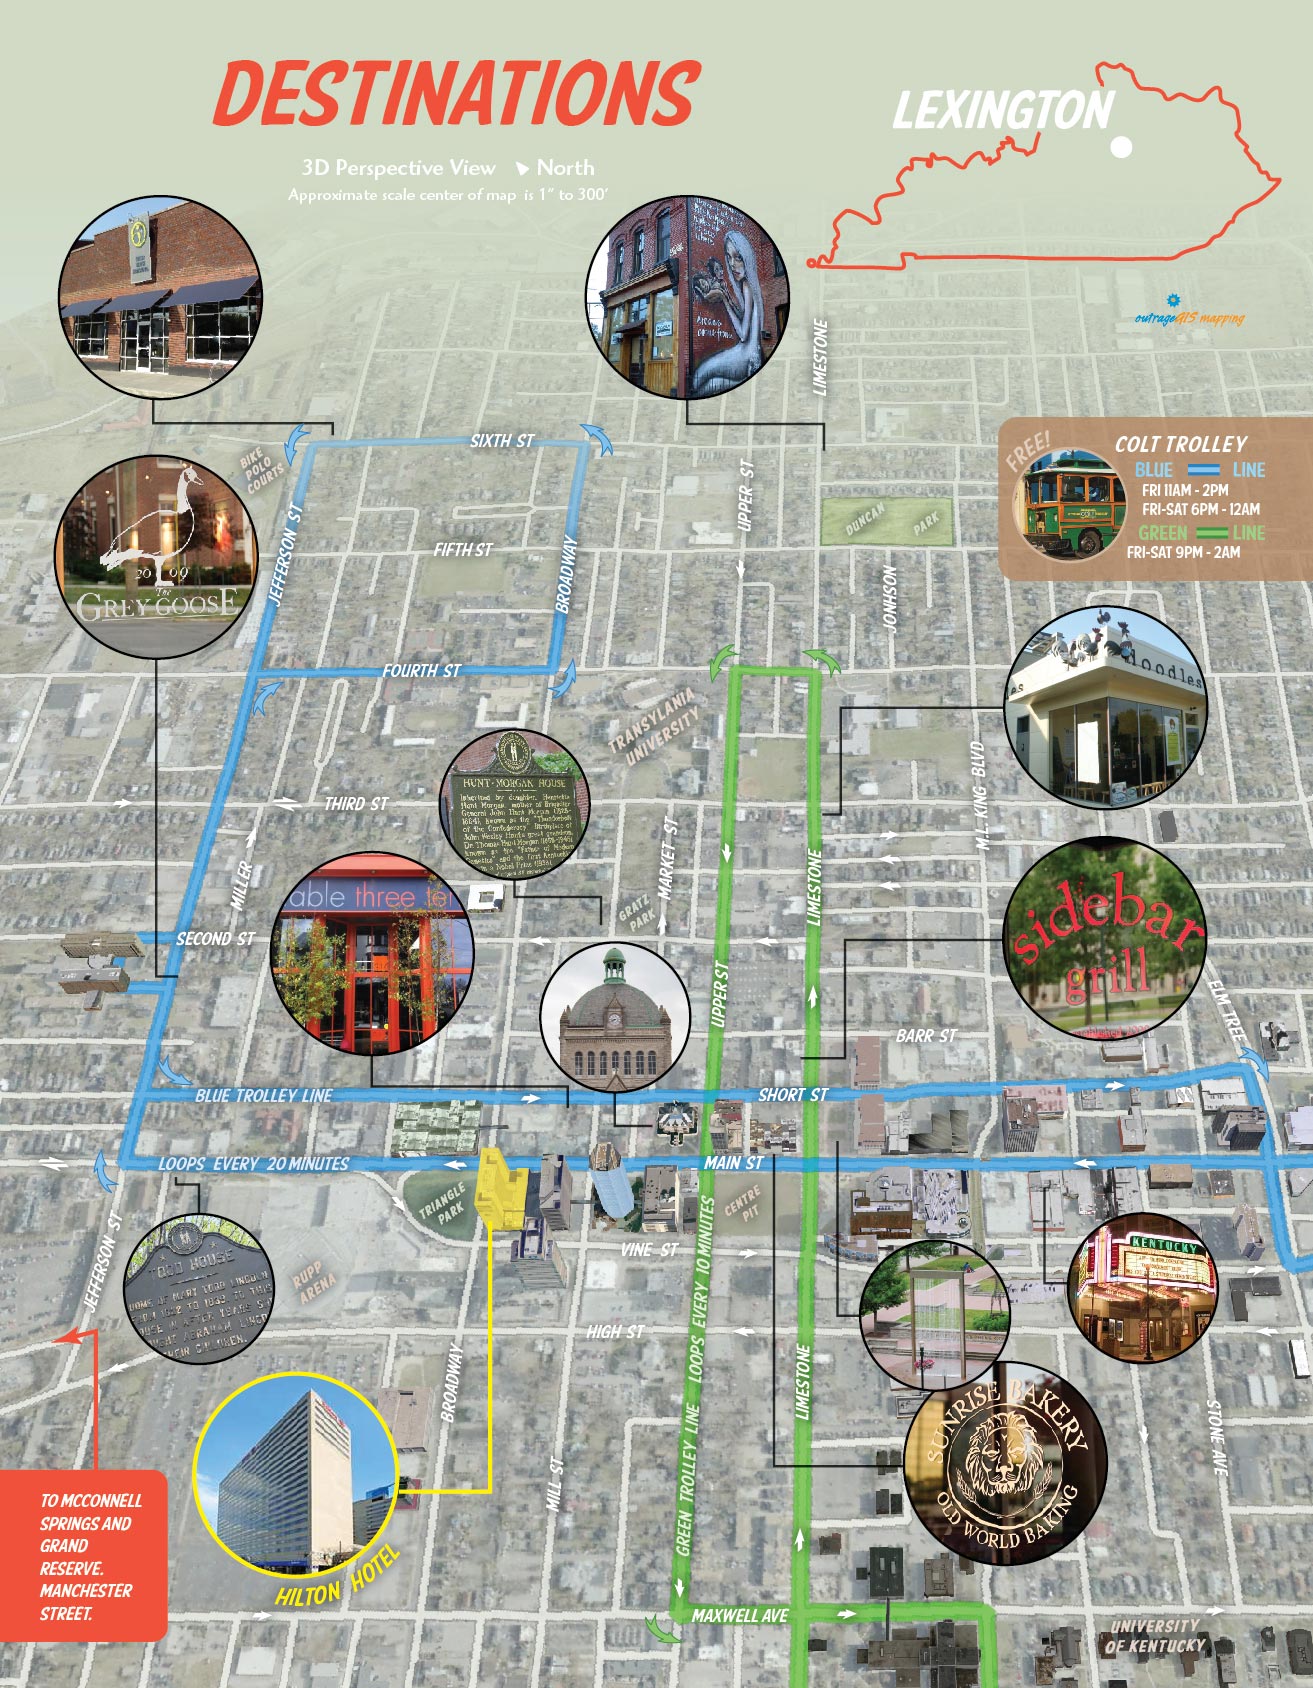
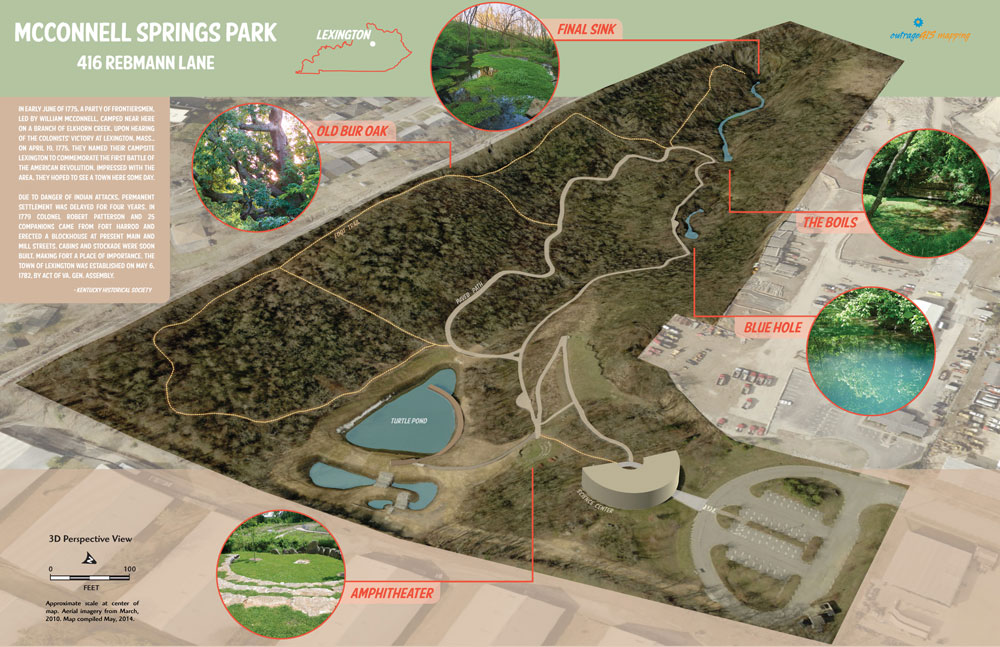
A selected gallery of student final posters from GIS courses at the University of Kentucky. Classes include, FOR 330, NRE 355, and LA 355.
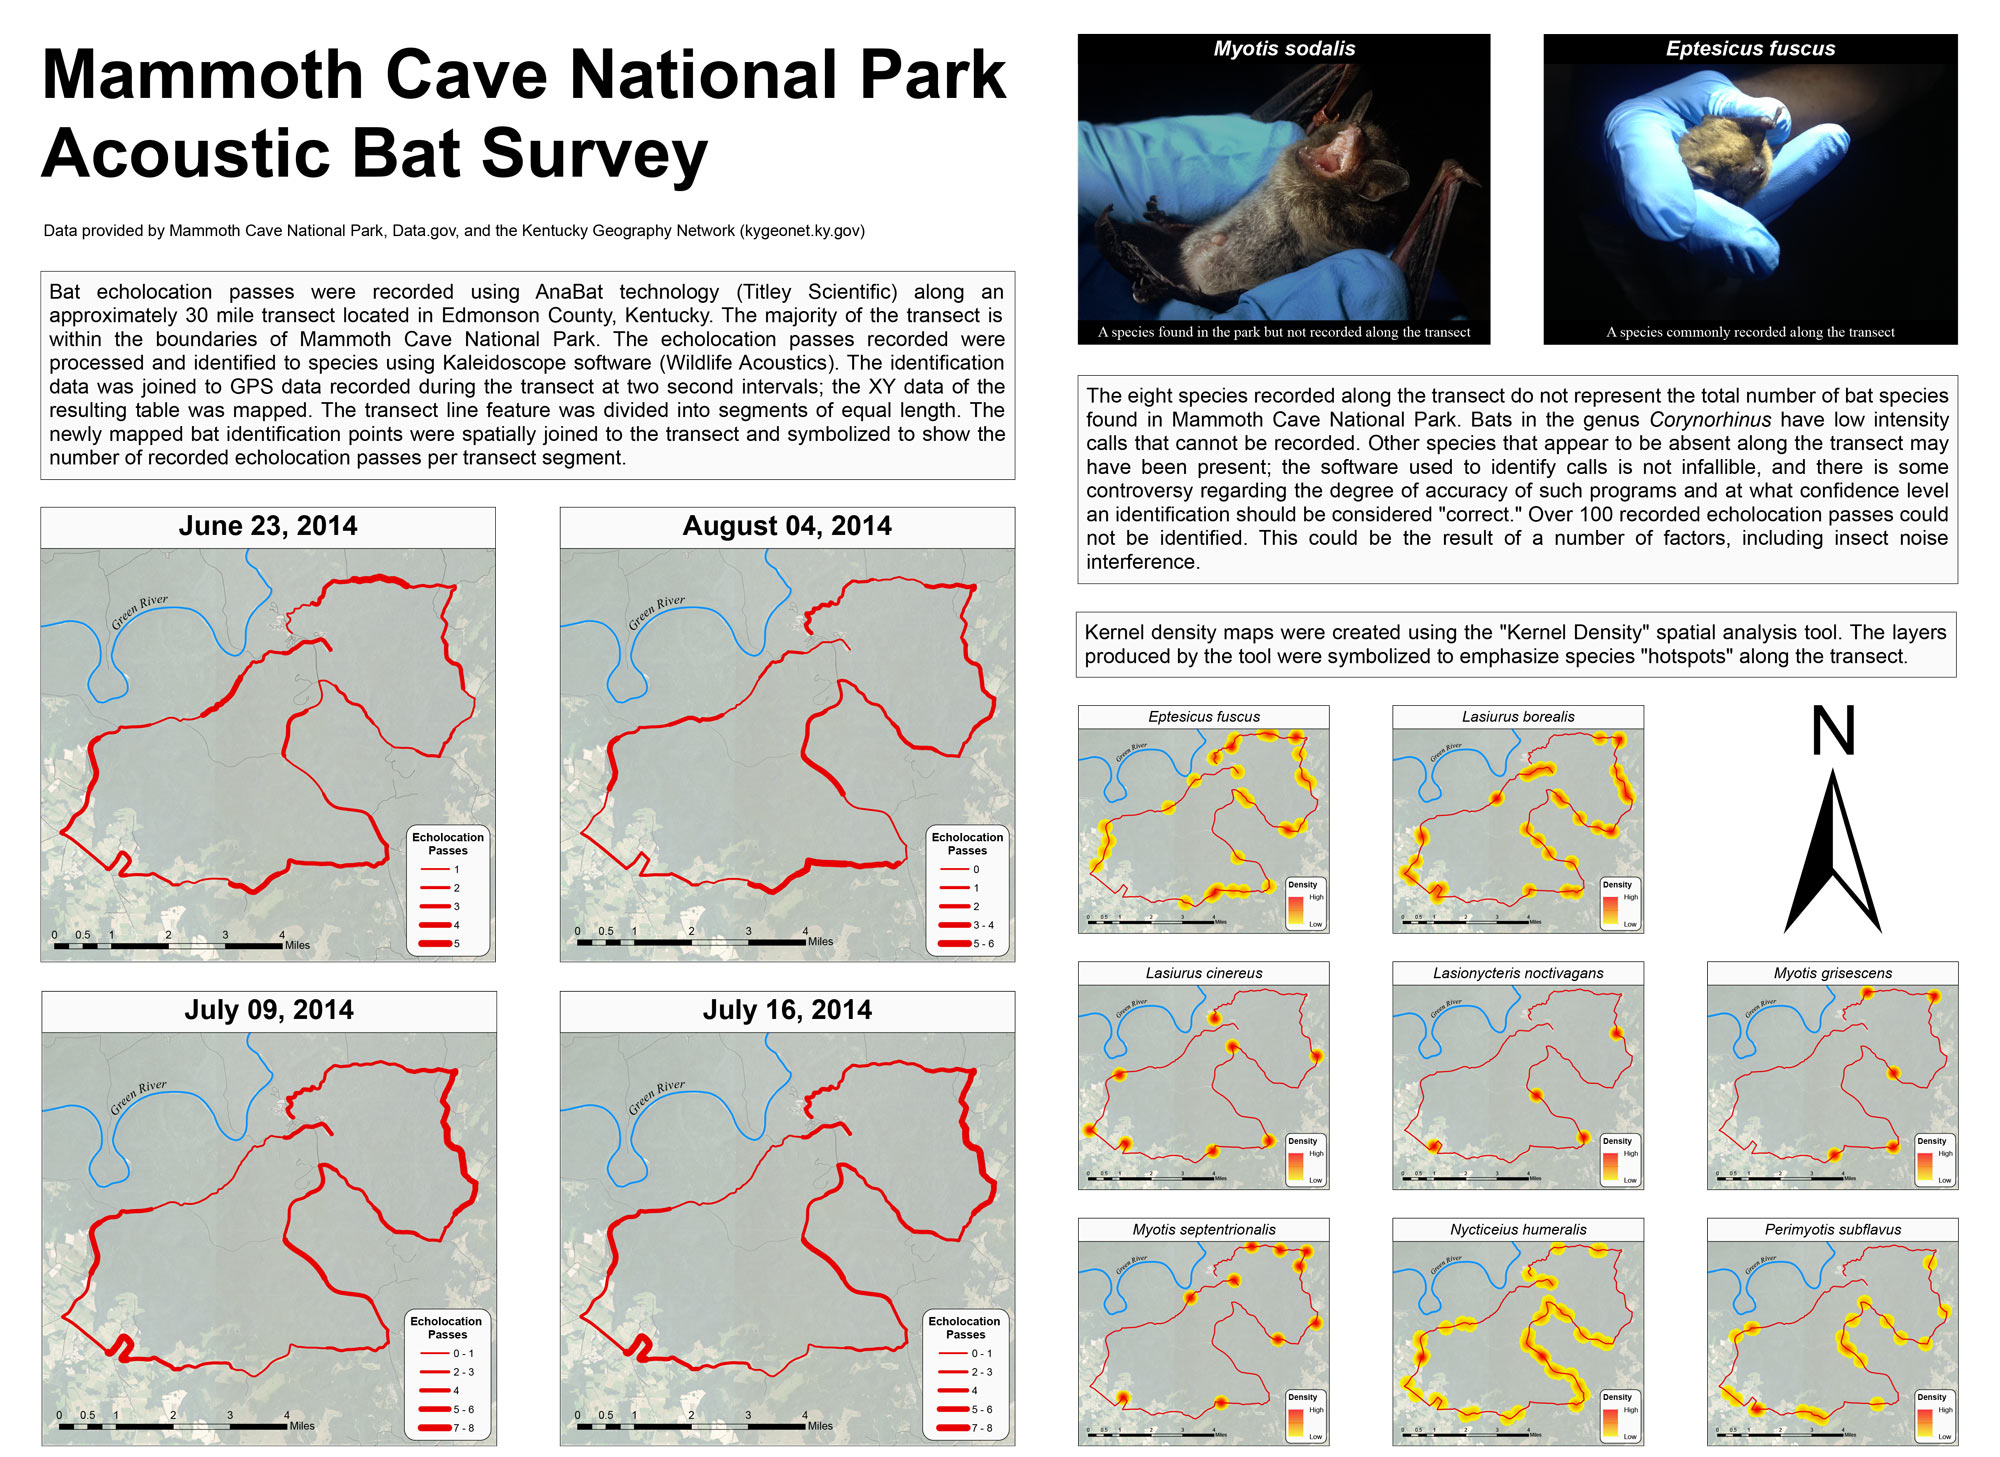
Mammoth Cave NP Acoustic Bat Survey, by Shelby Fulton

Kentucky’s Best Public Land Waterfowl Hunting Areas, by Zack Hackworth
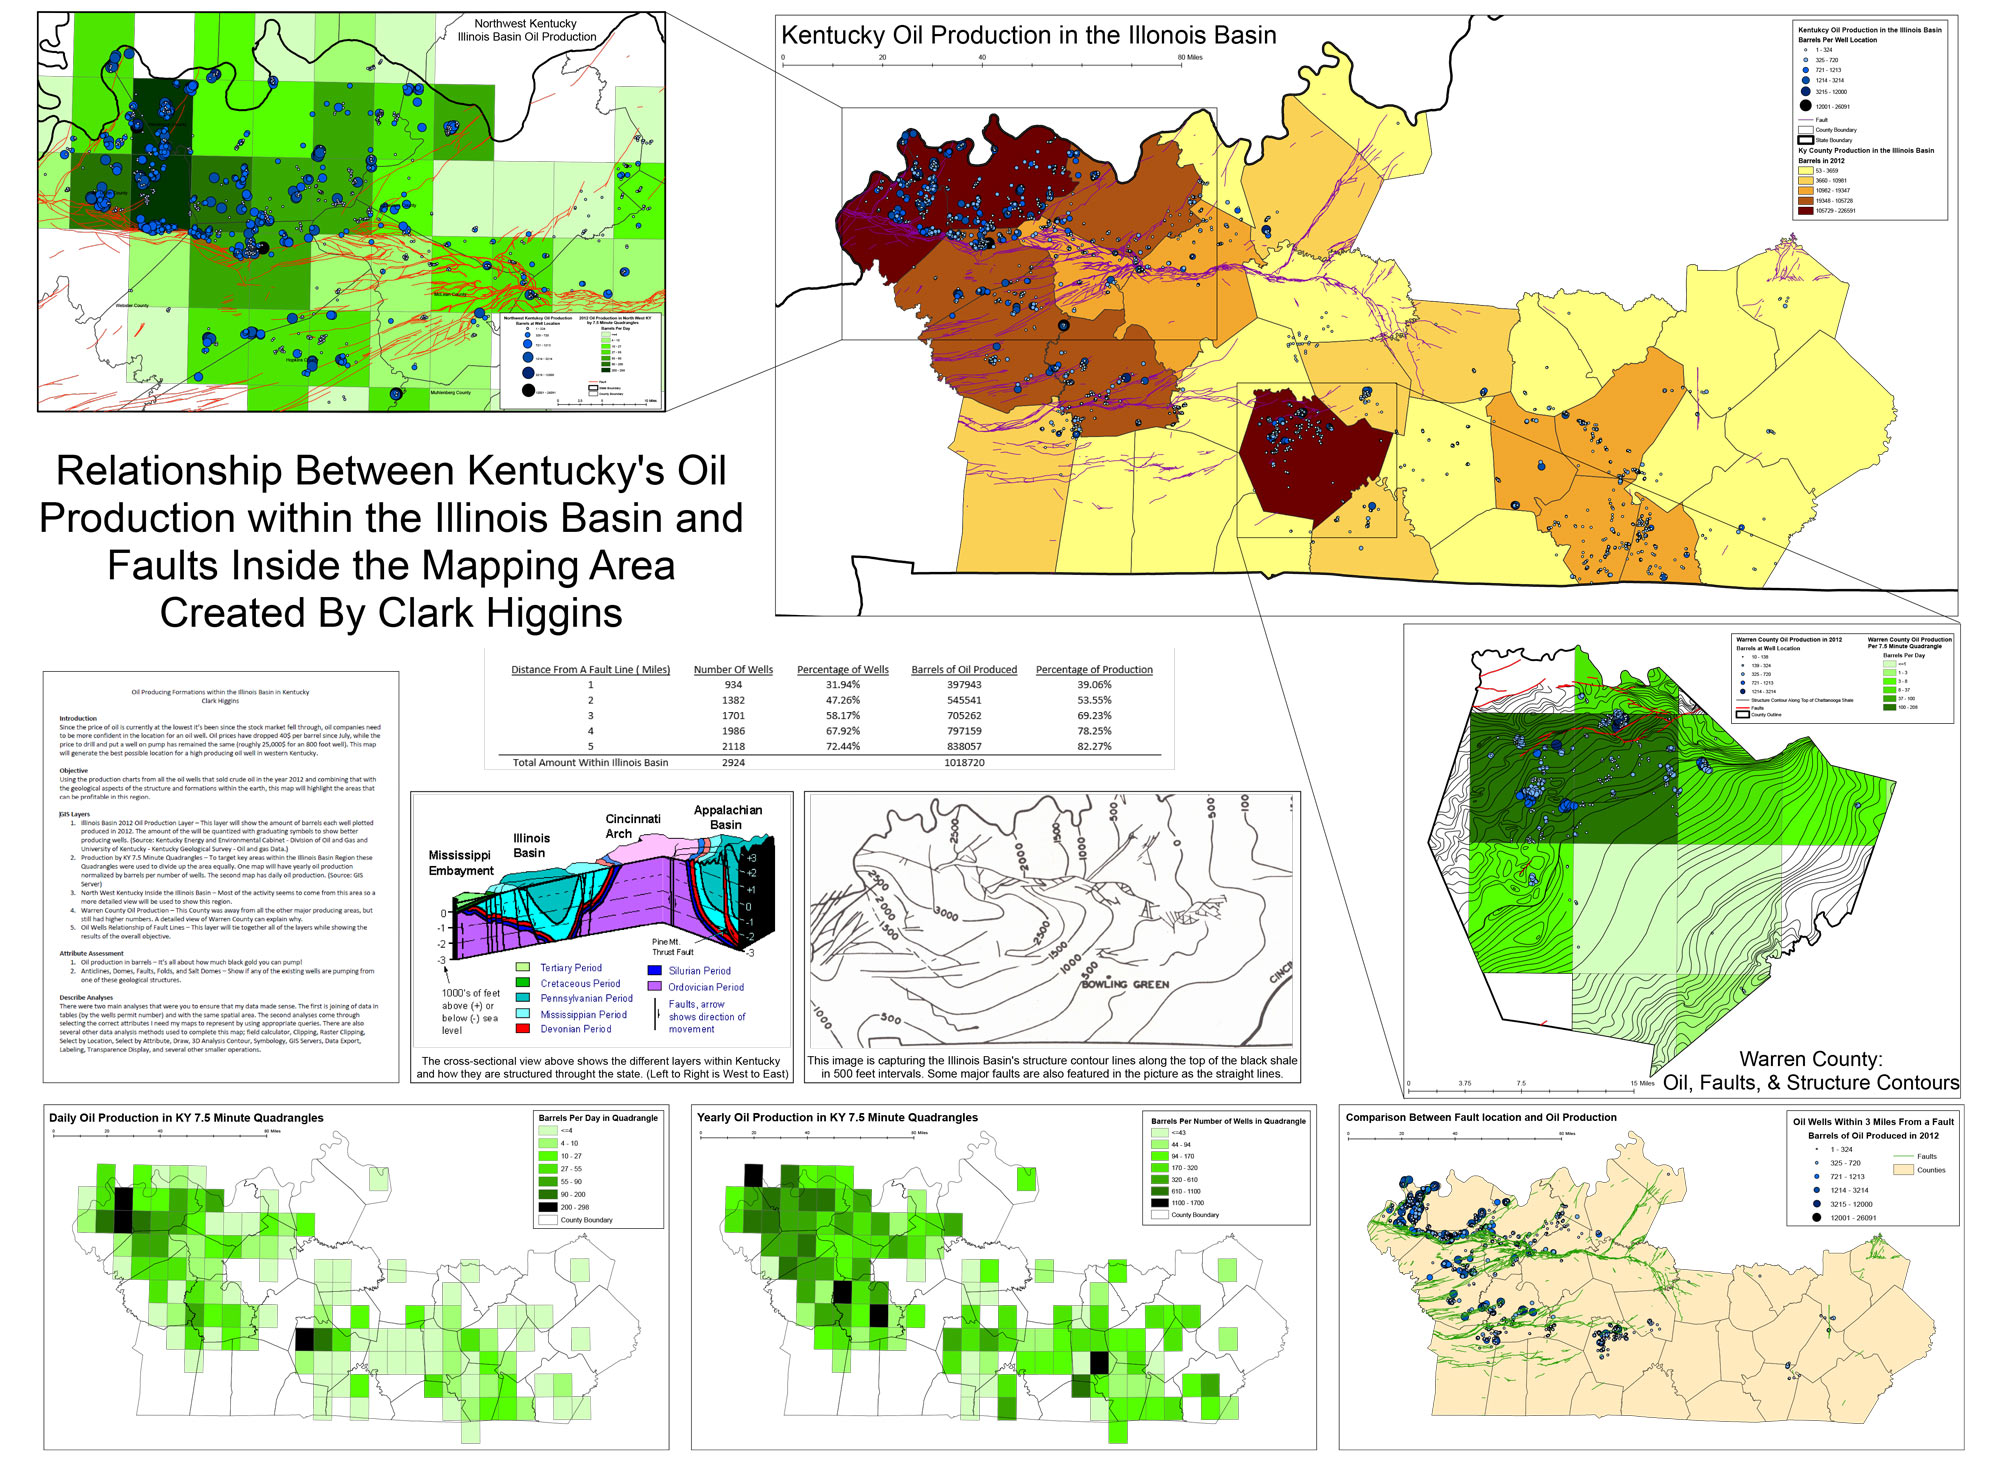
Kentucky’s Oil Production in the Illinois Basin, by Clark Higgins
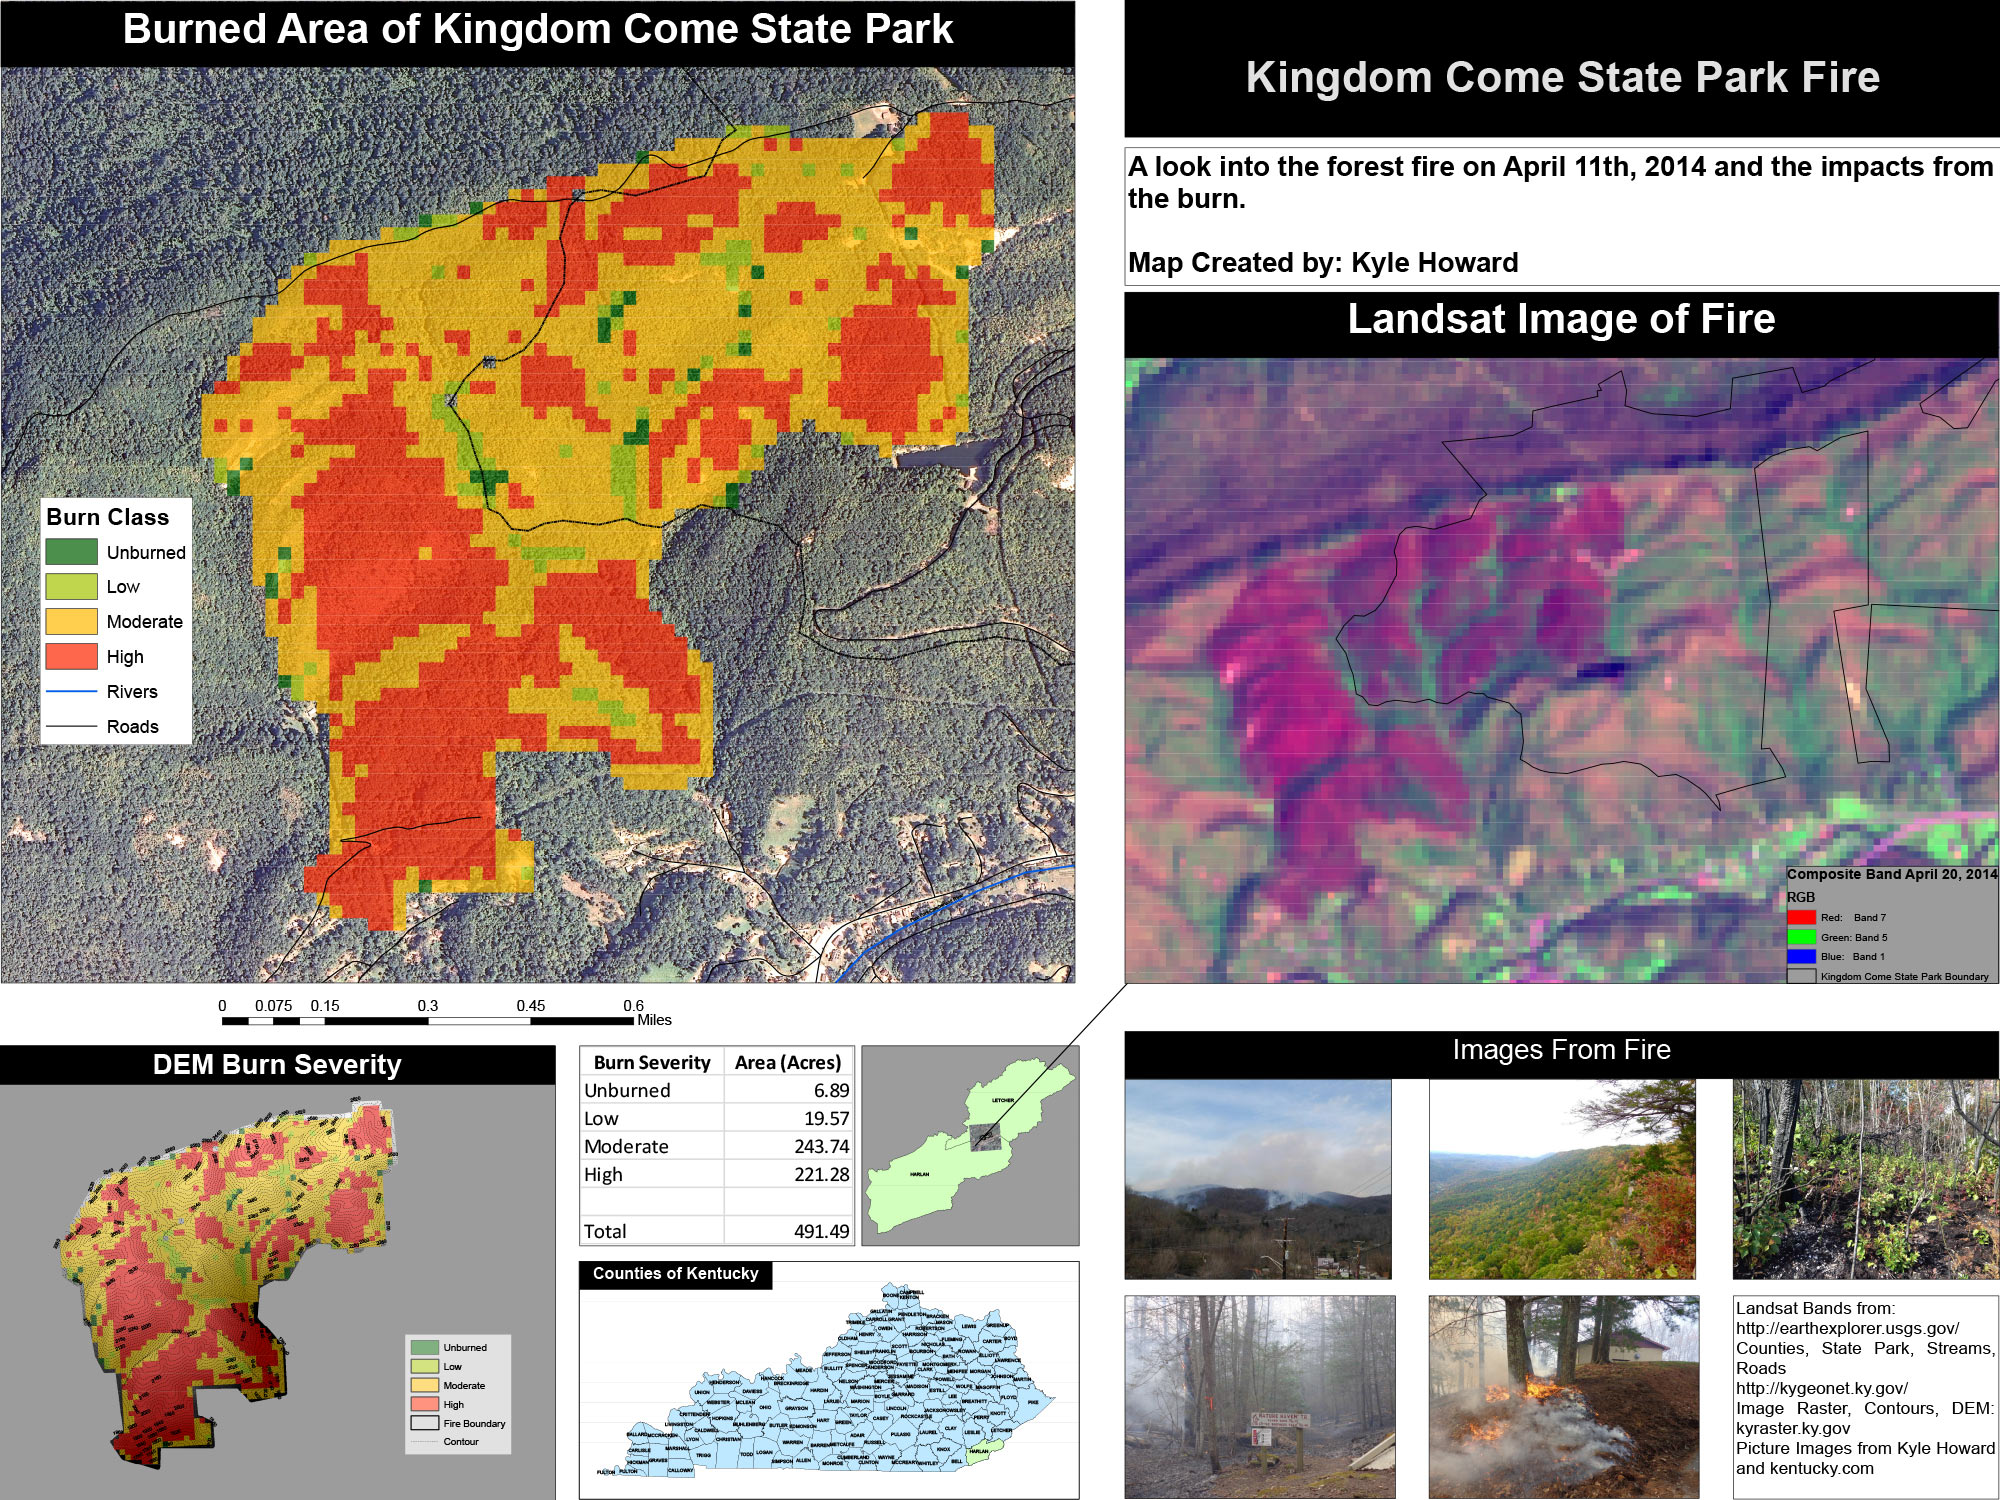
April, 2014 Kingdom Come State Park Wildfire Analysis, by Kyle Howard
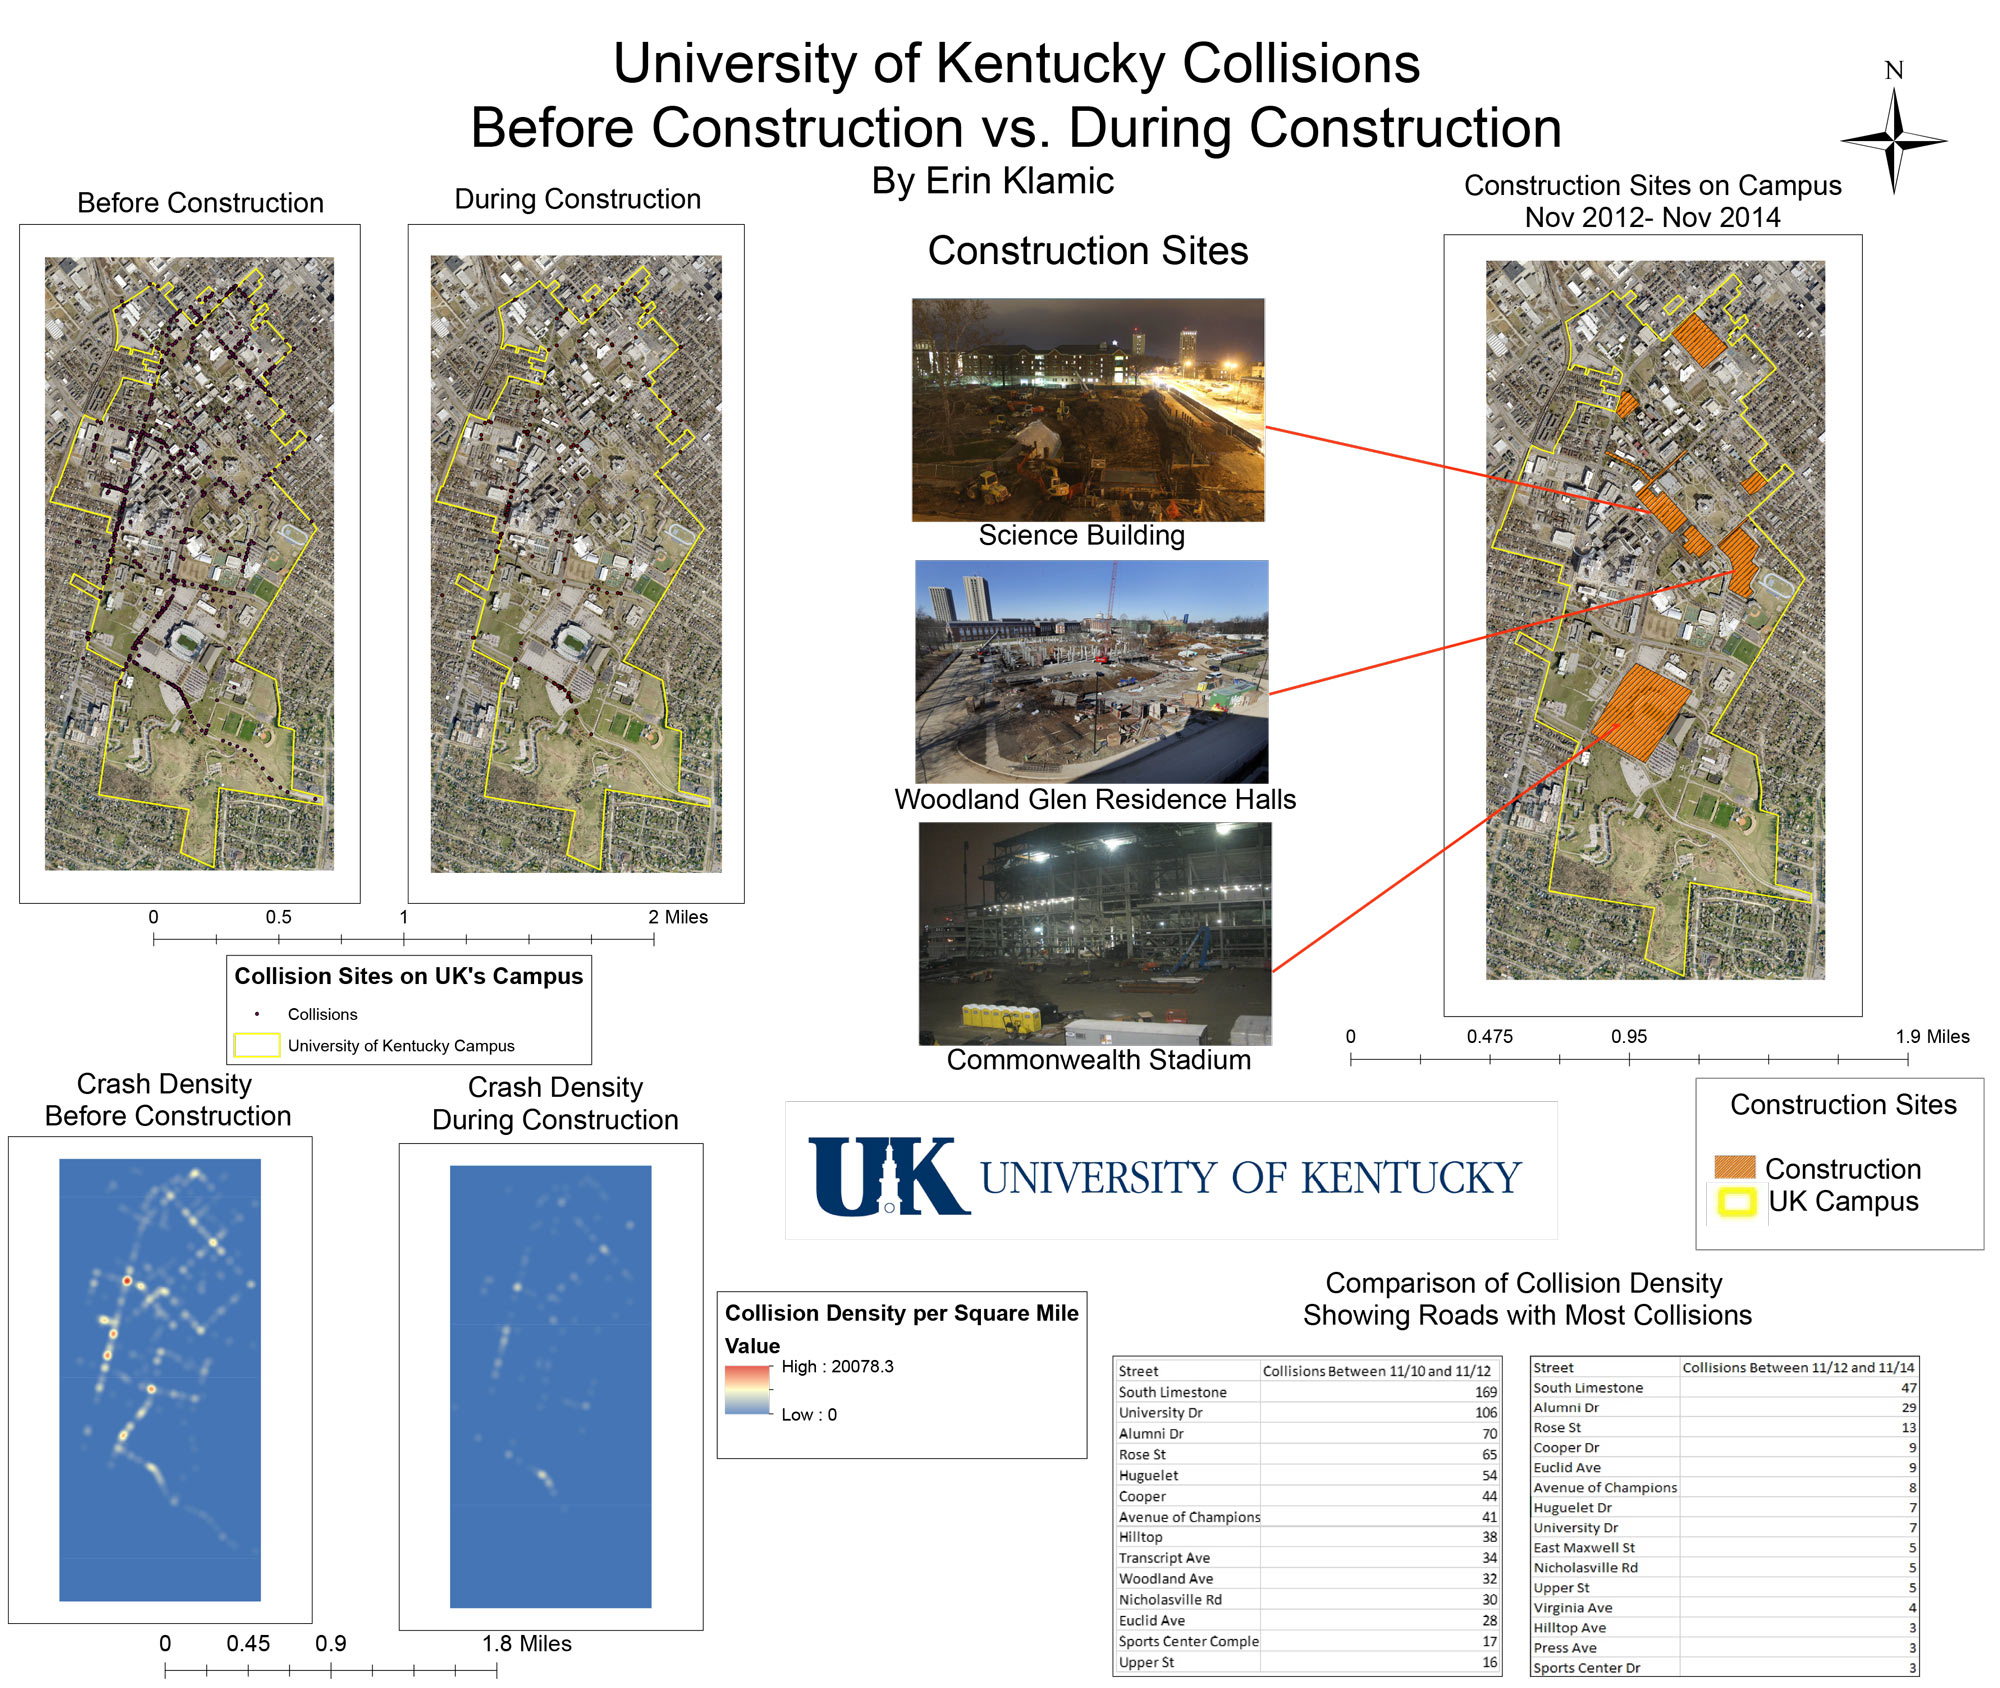
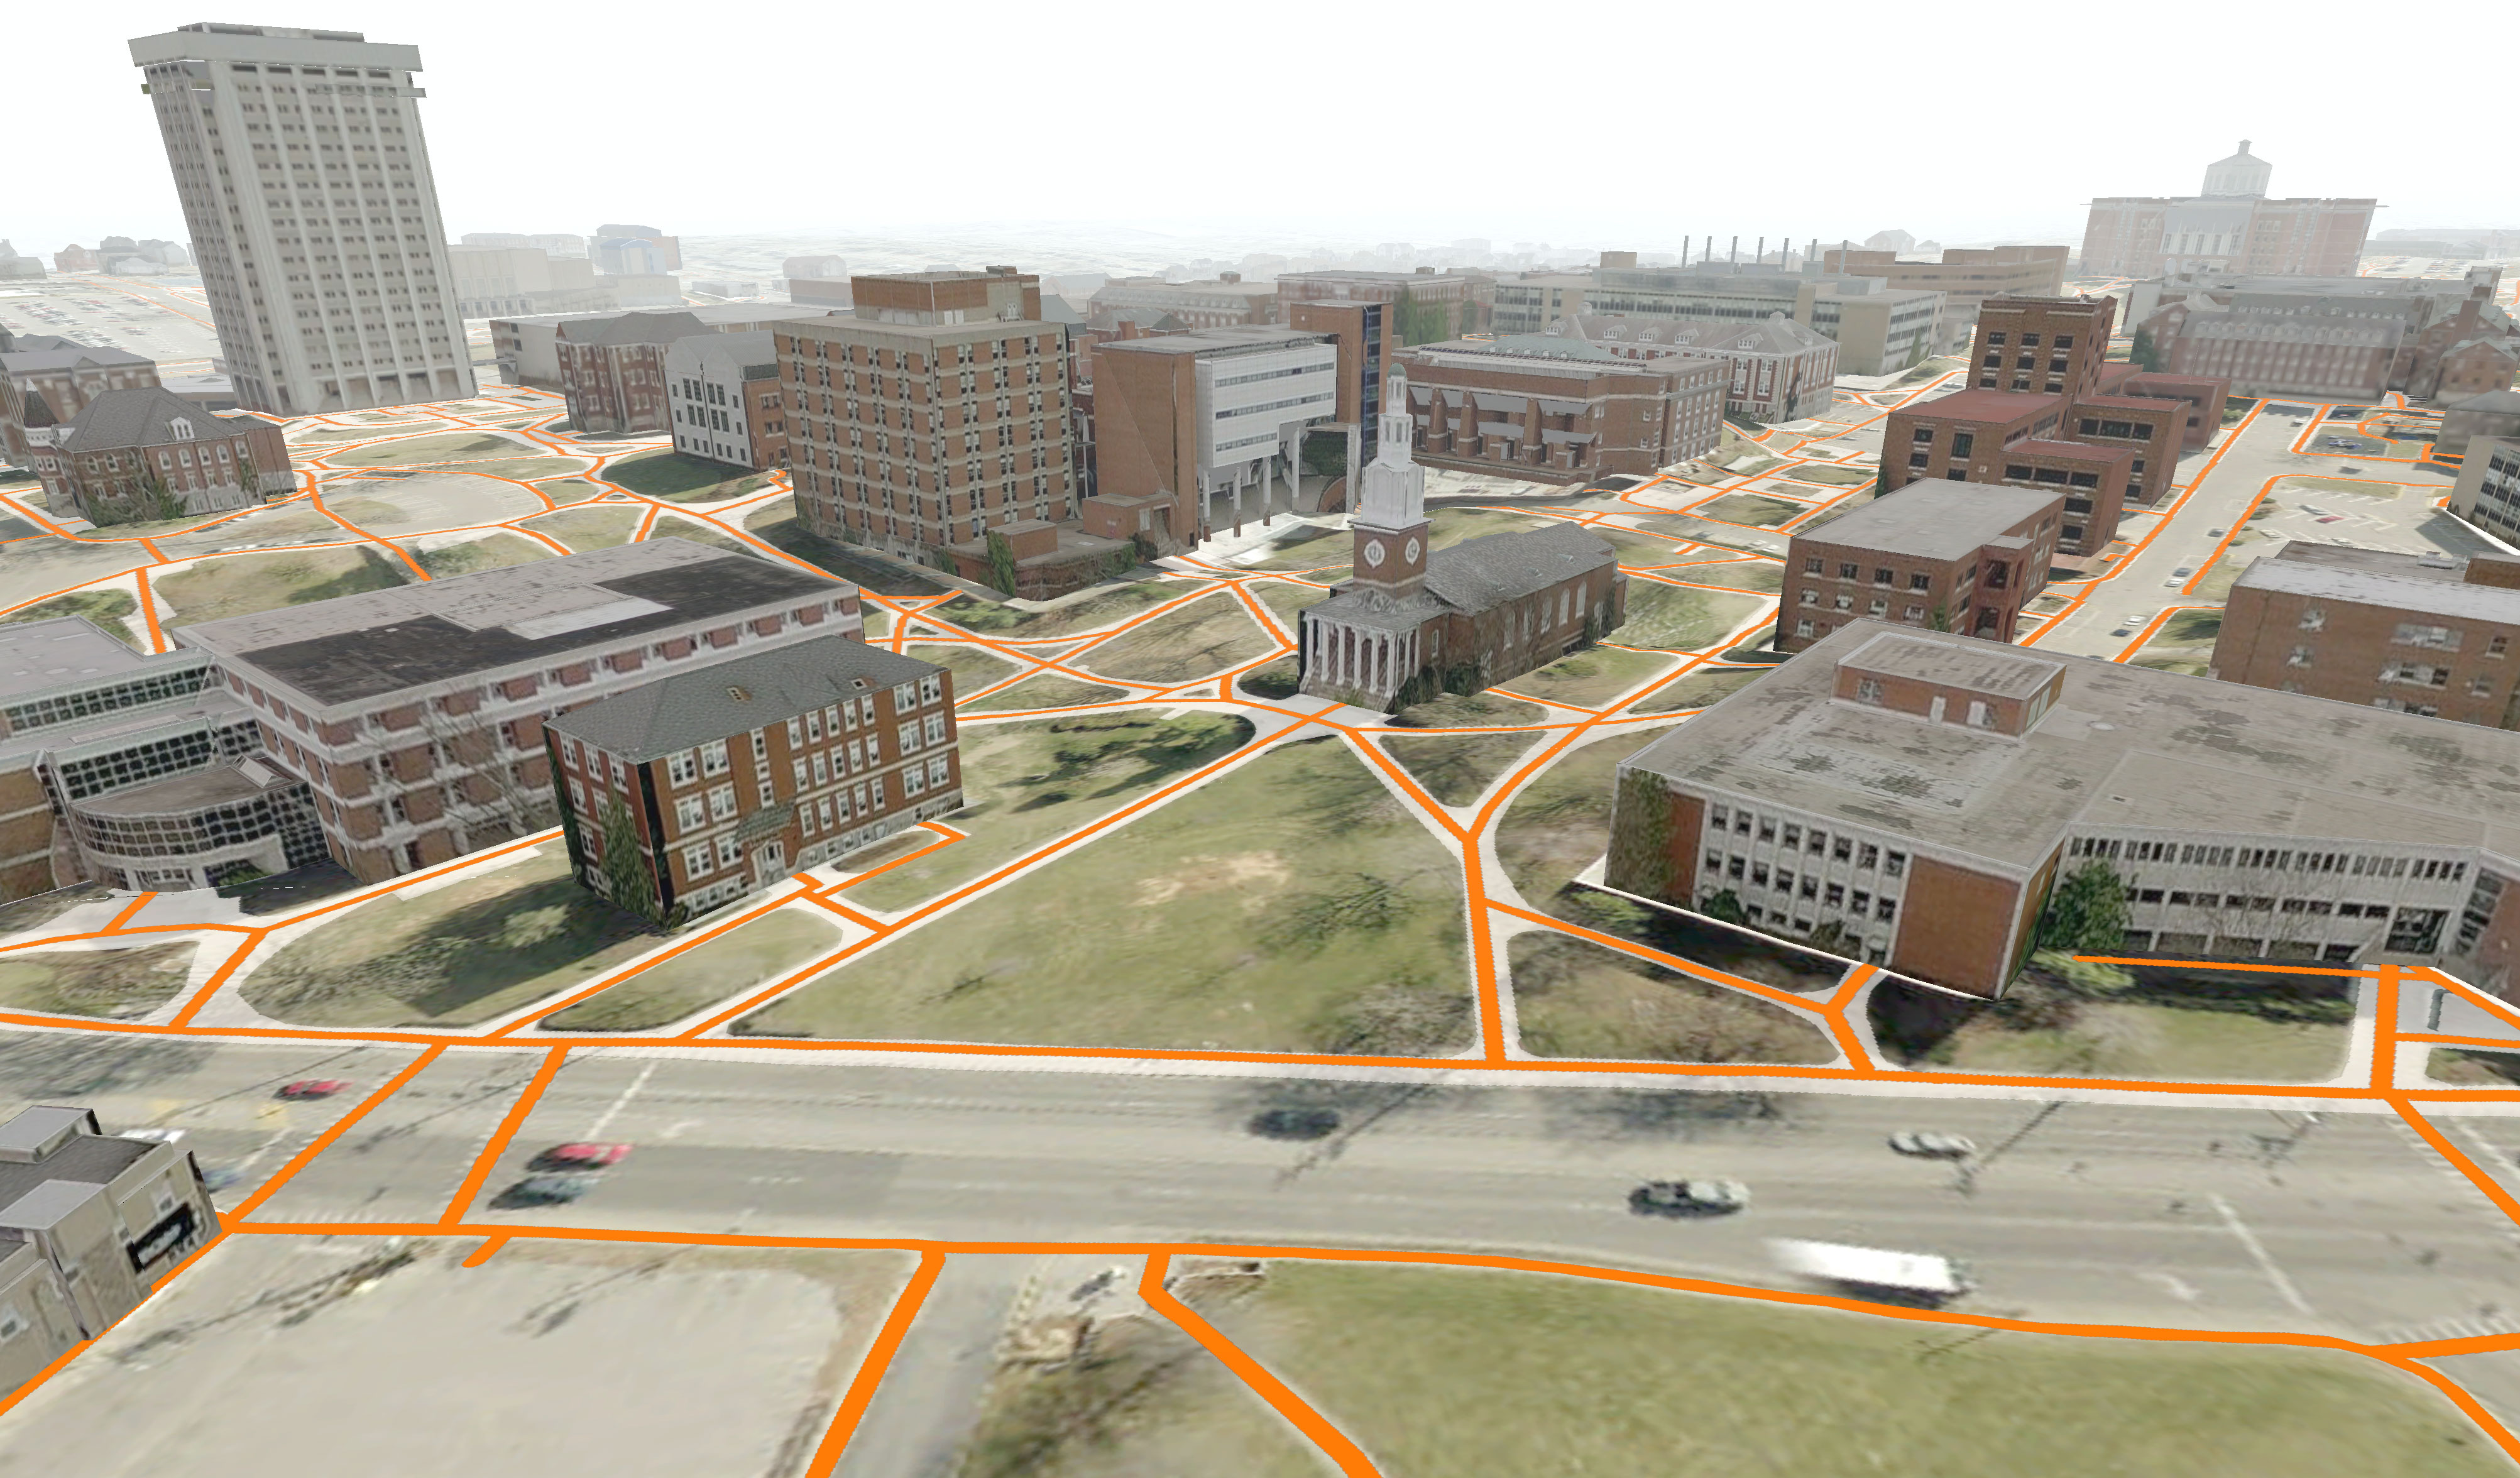
University of Kentucky Car Collision before and during Campus Contruction, by Erin Klamic
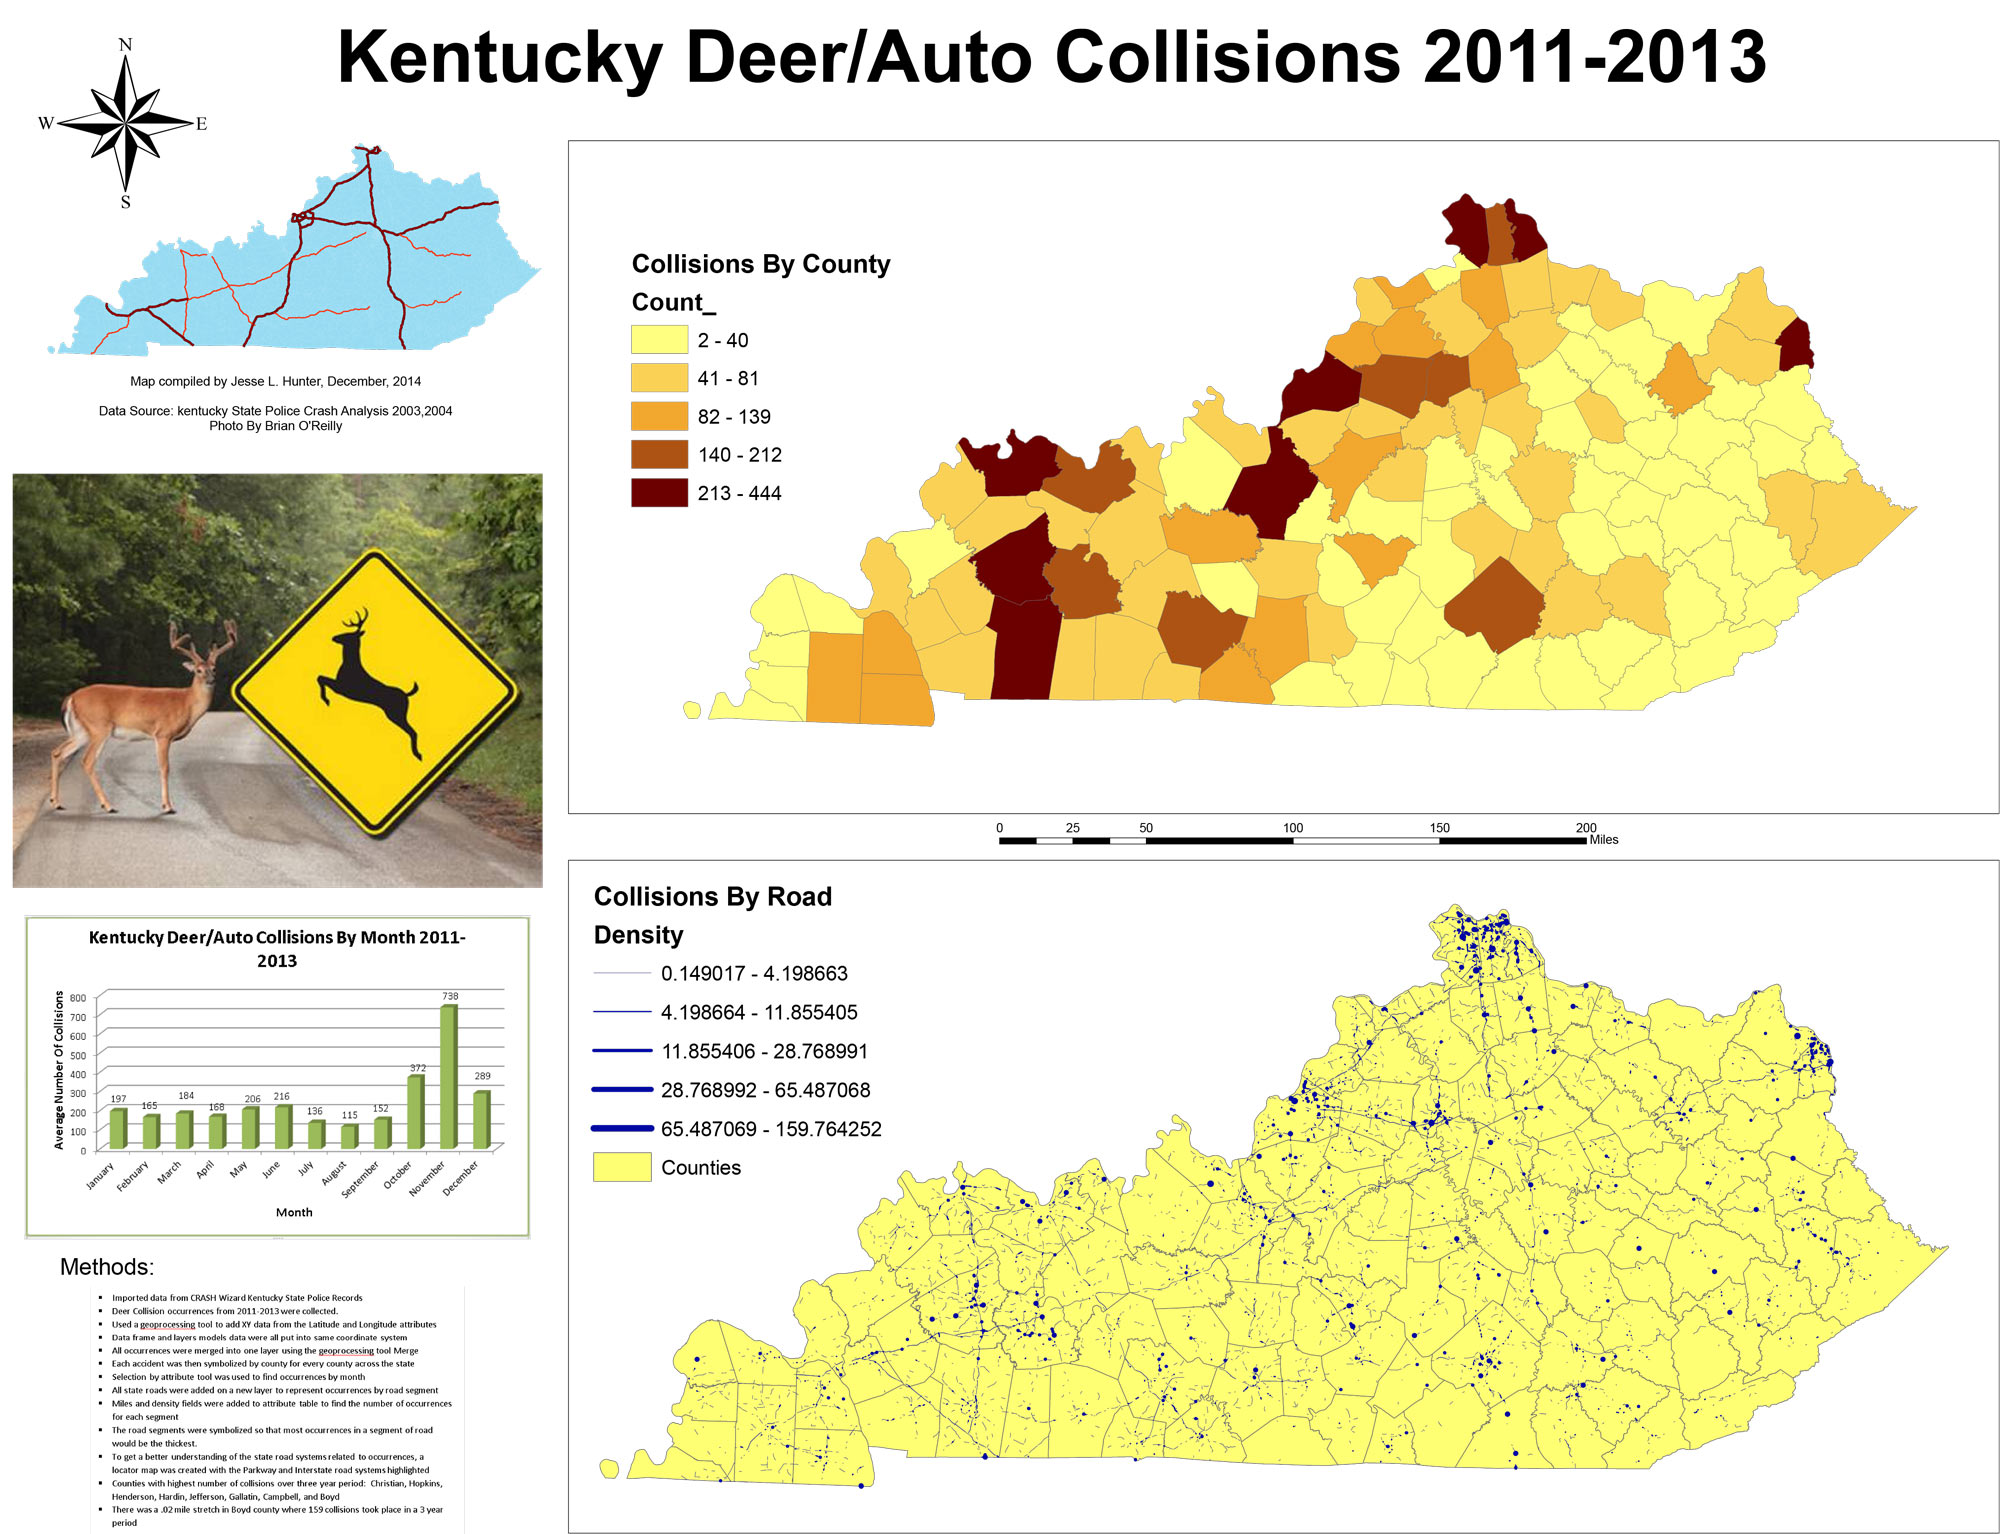
An Analysis of Kentucky’s Deer v. Car Collisions between 2011-2013, by Jesse Hunter

Analysis of Car Crashes in Bullitt County, by Austin Sauer
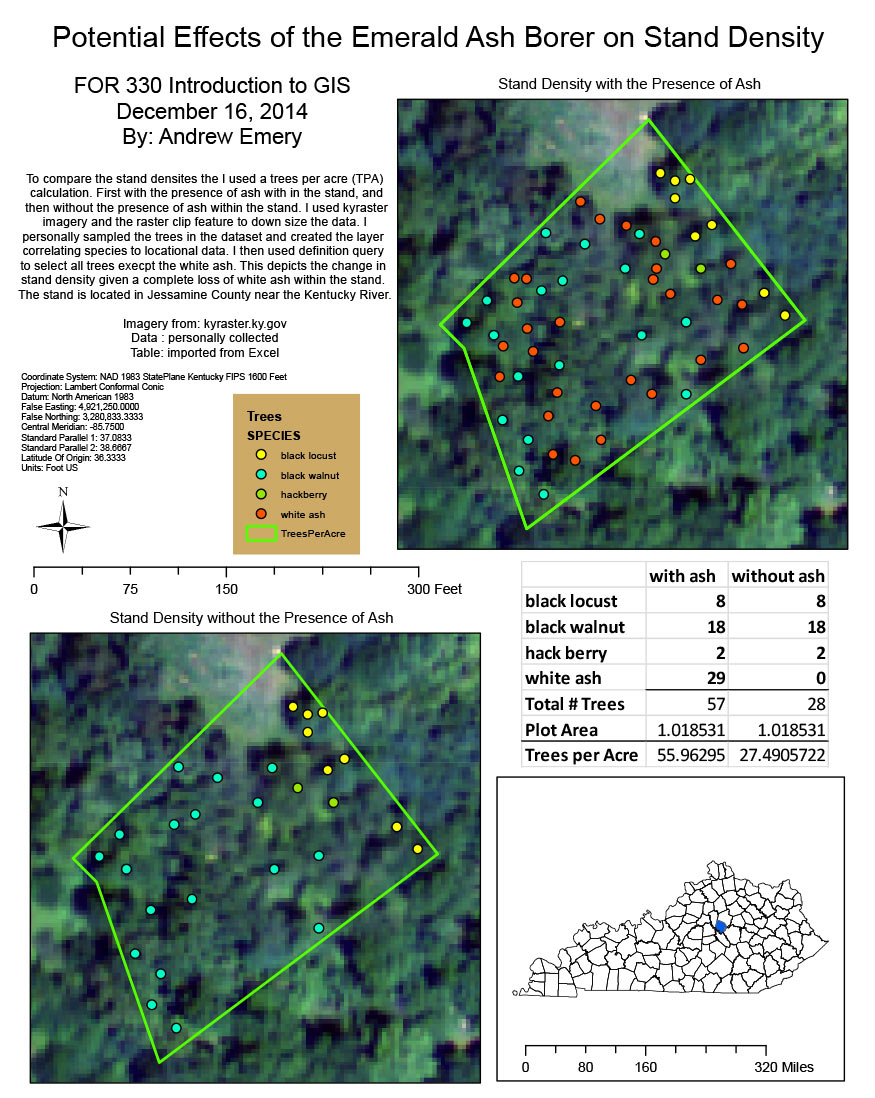
Potential Effects of the Emerald Ash Borer on Stand Density, by Andrew Emery