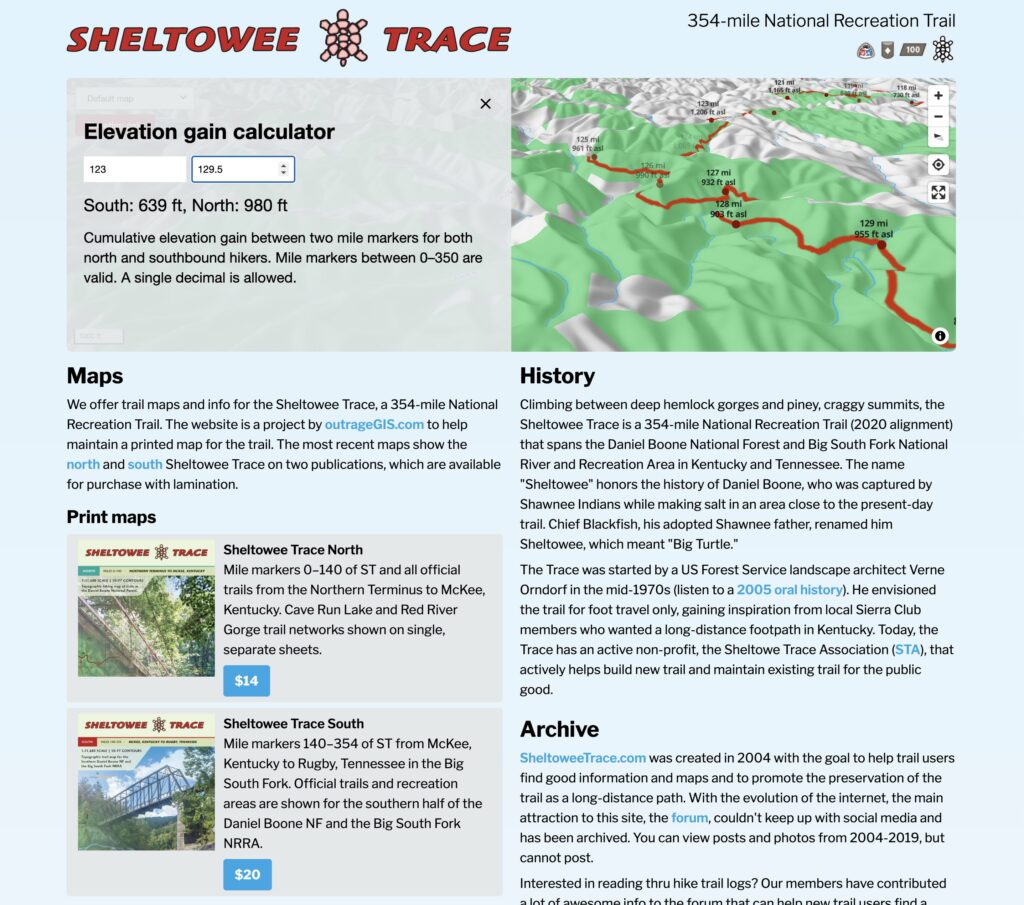
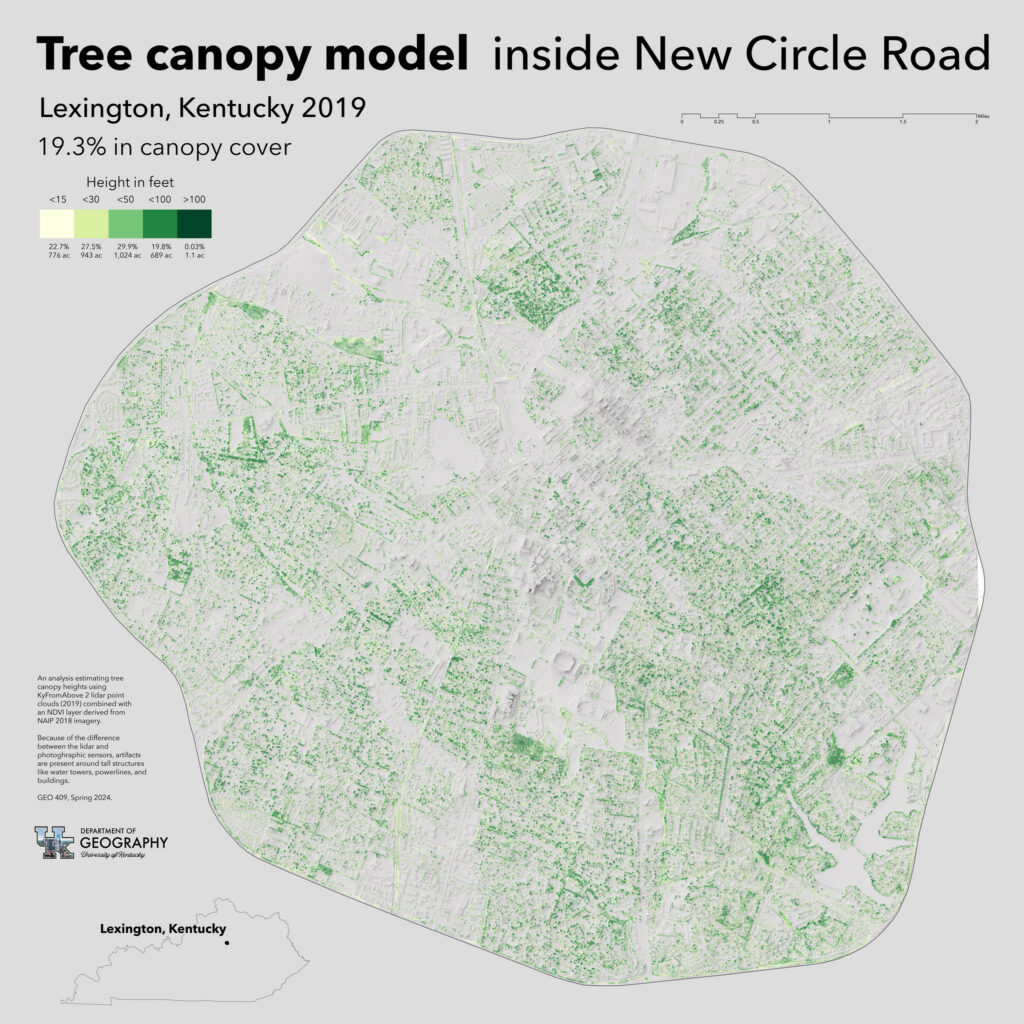
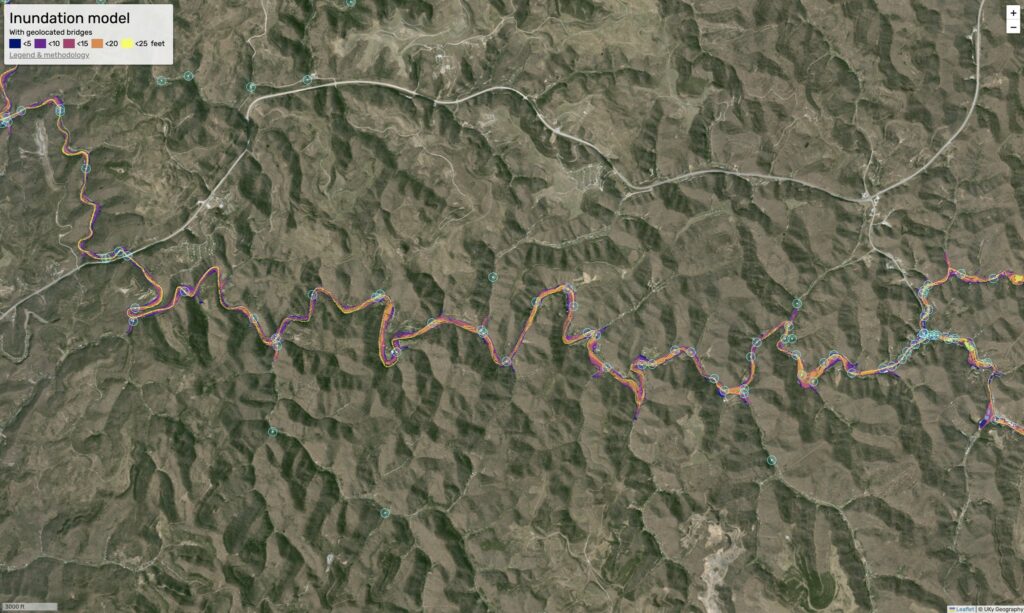
In this web map, we explore how to use different elevation models in 3D maps. The KyFromAbove project collects and maintains high-resolution elevation data and aerial imagery for Kentucky. The bare-earth Digital Elevation Model (DEM) was created from a lidar point cloud. This is the typical elevation model that we use. The same point cloud was then filtered to create a Digital Surface Model (DSM) showing above-ground elevations, like buildings and trees. Both of these elevation models were converted to terrain tiles to use in web mapping applications. MapLibre GL JS 3D features terrain rendering with RGB-encoded elevation raster tiles.
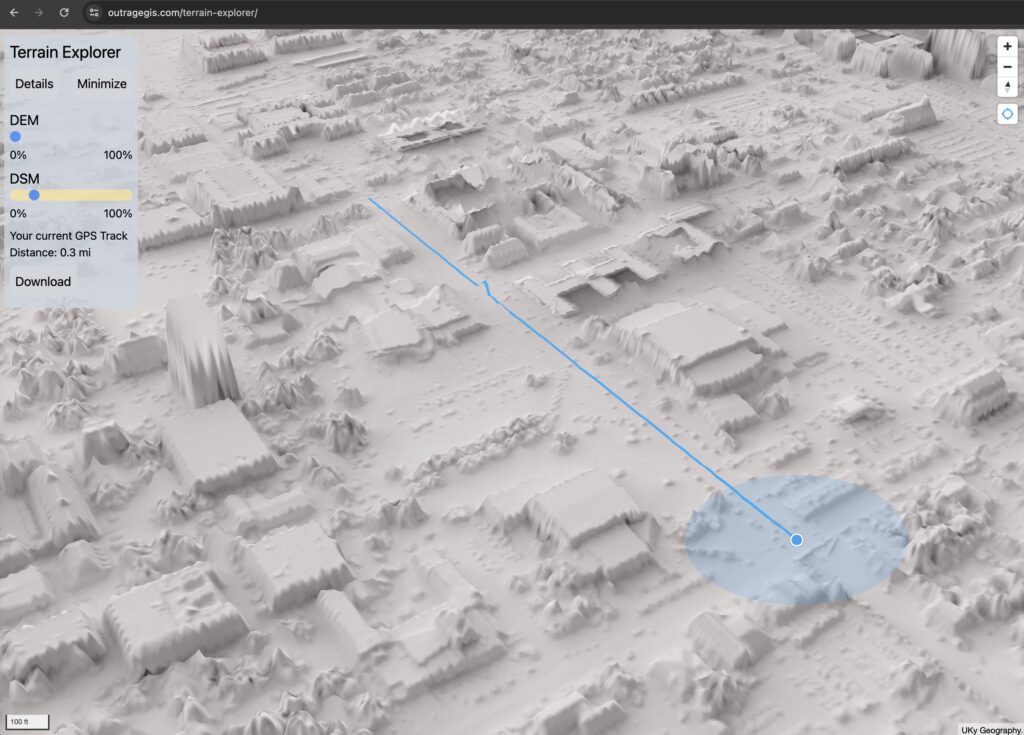
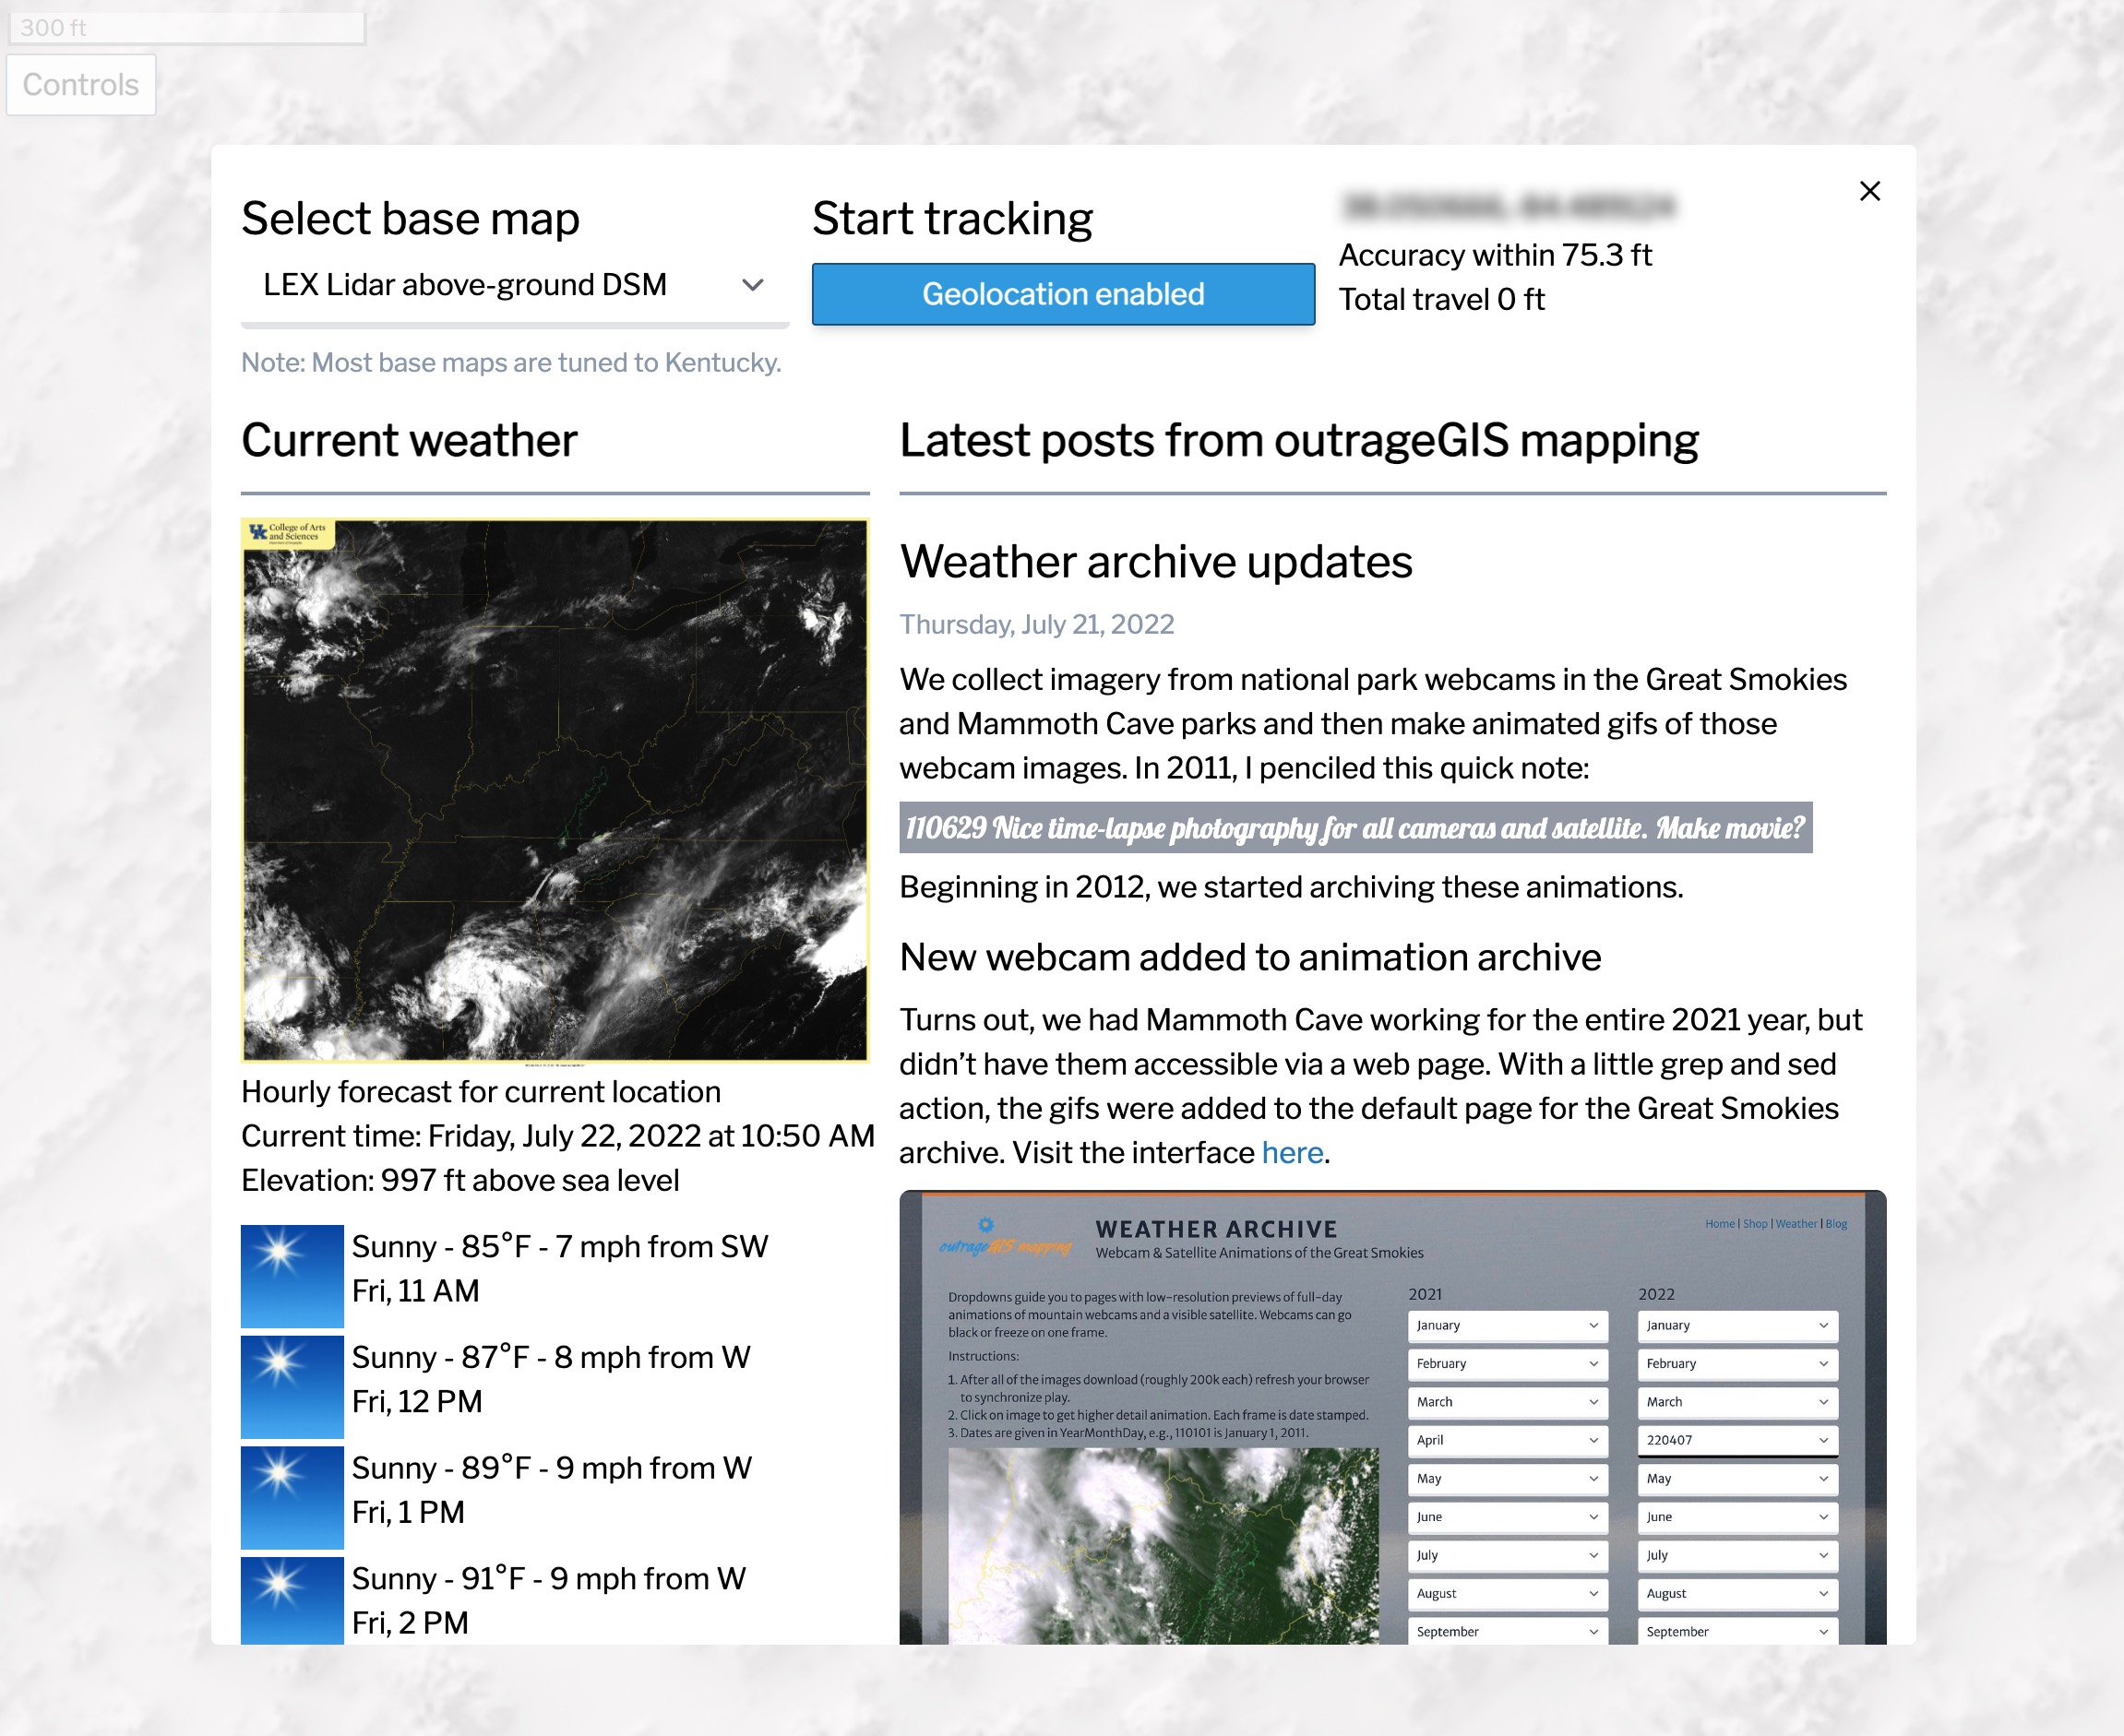
The sliders allow the viewer to change the vertical exaggeration of the DEM and DSM. If geolocation is enabled, a track will record the viewer’s location. That track can be downloaded as a GeoJSON (works in Chrome).
Visit the page: outragegis.com/terrain-explorer/
This was a project in the UKy Geography MAP 675, a course in the department’s Digital Mapping MS graduate program. The aerial imagery and elevation data are from 2019.


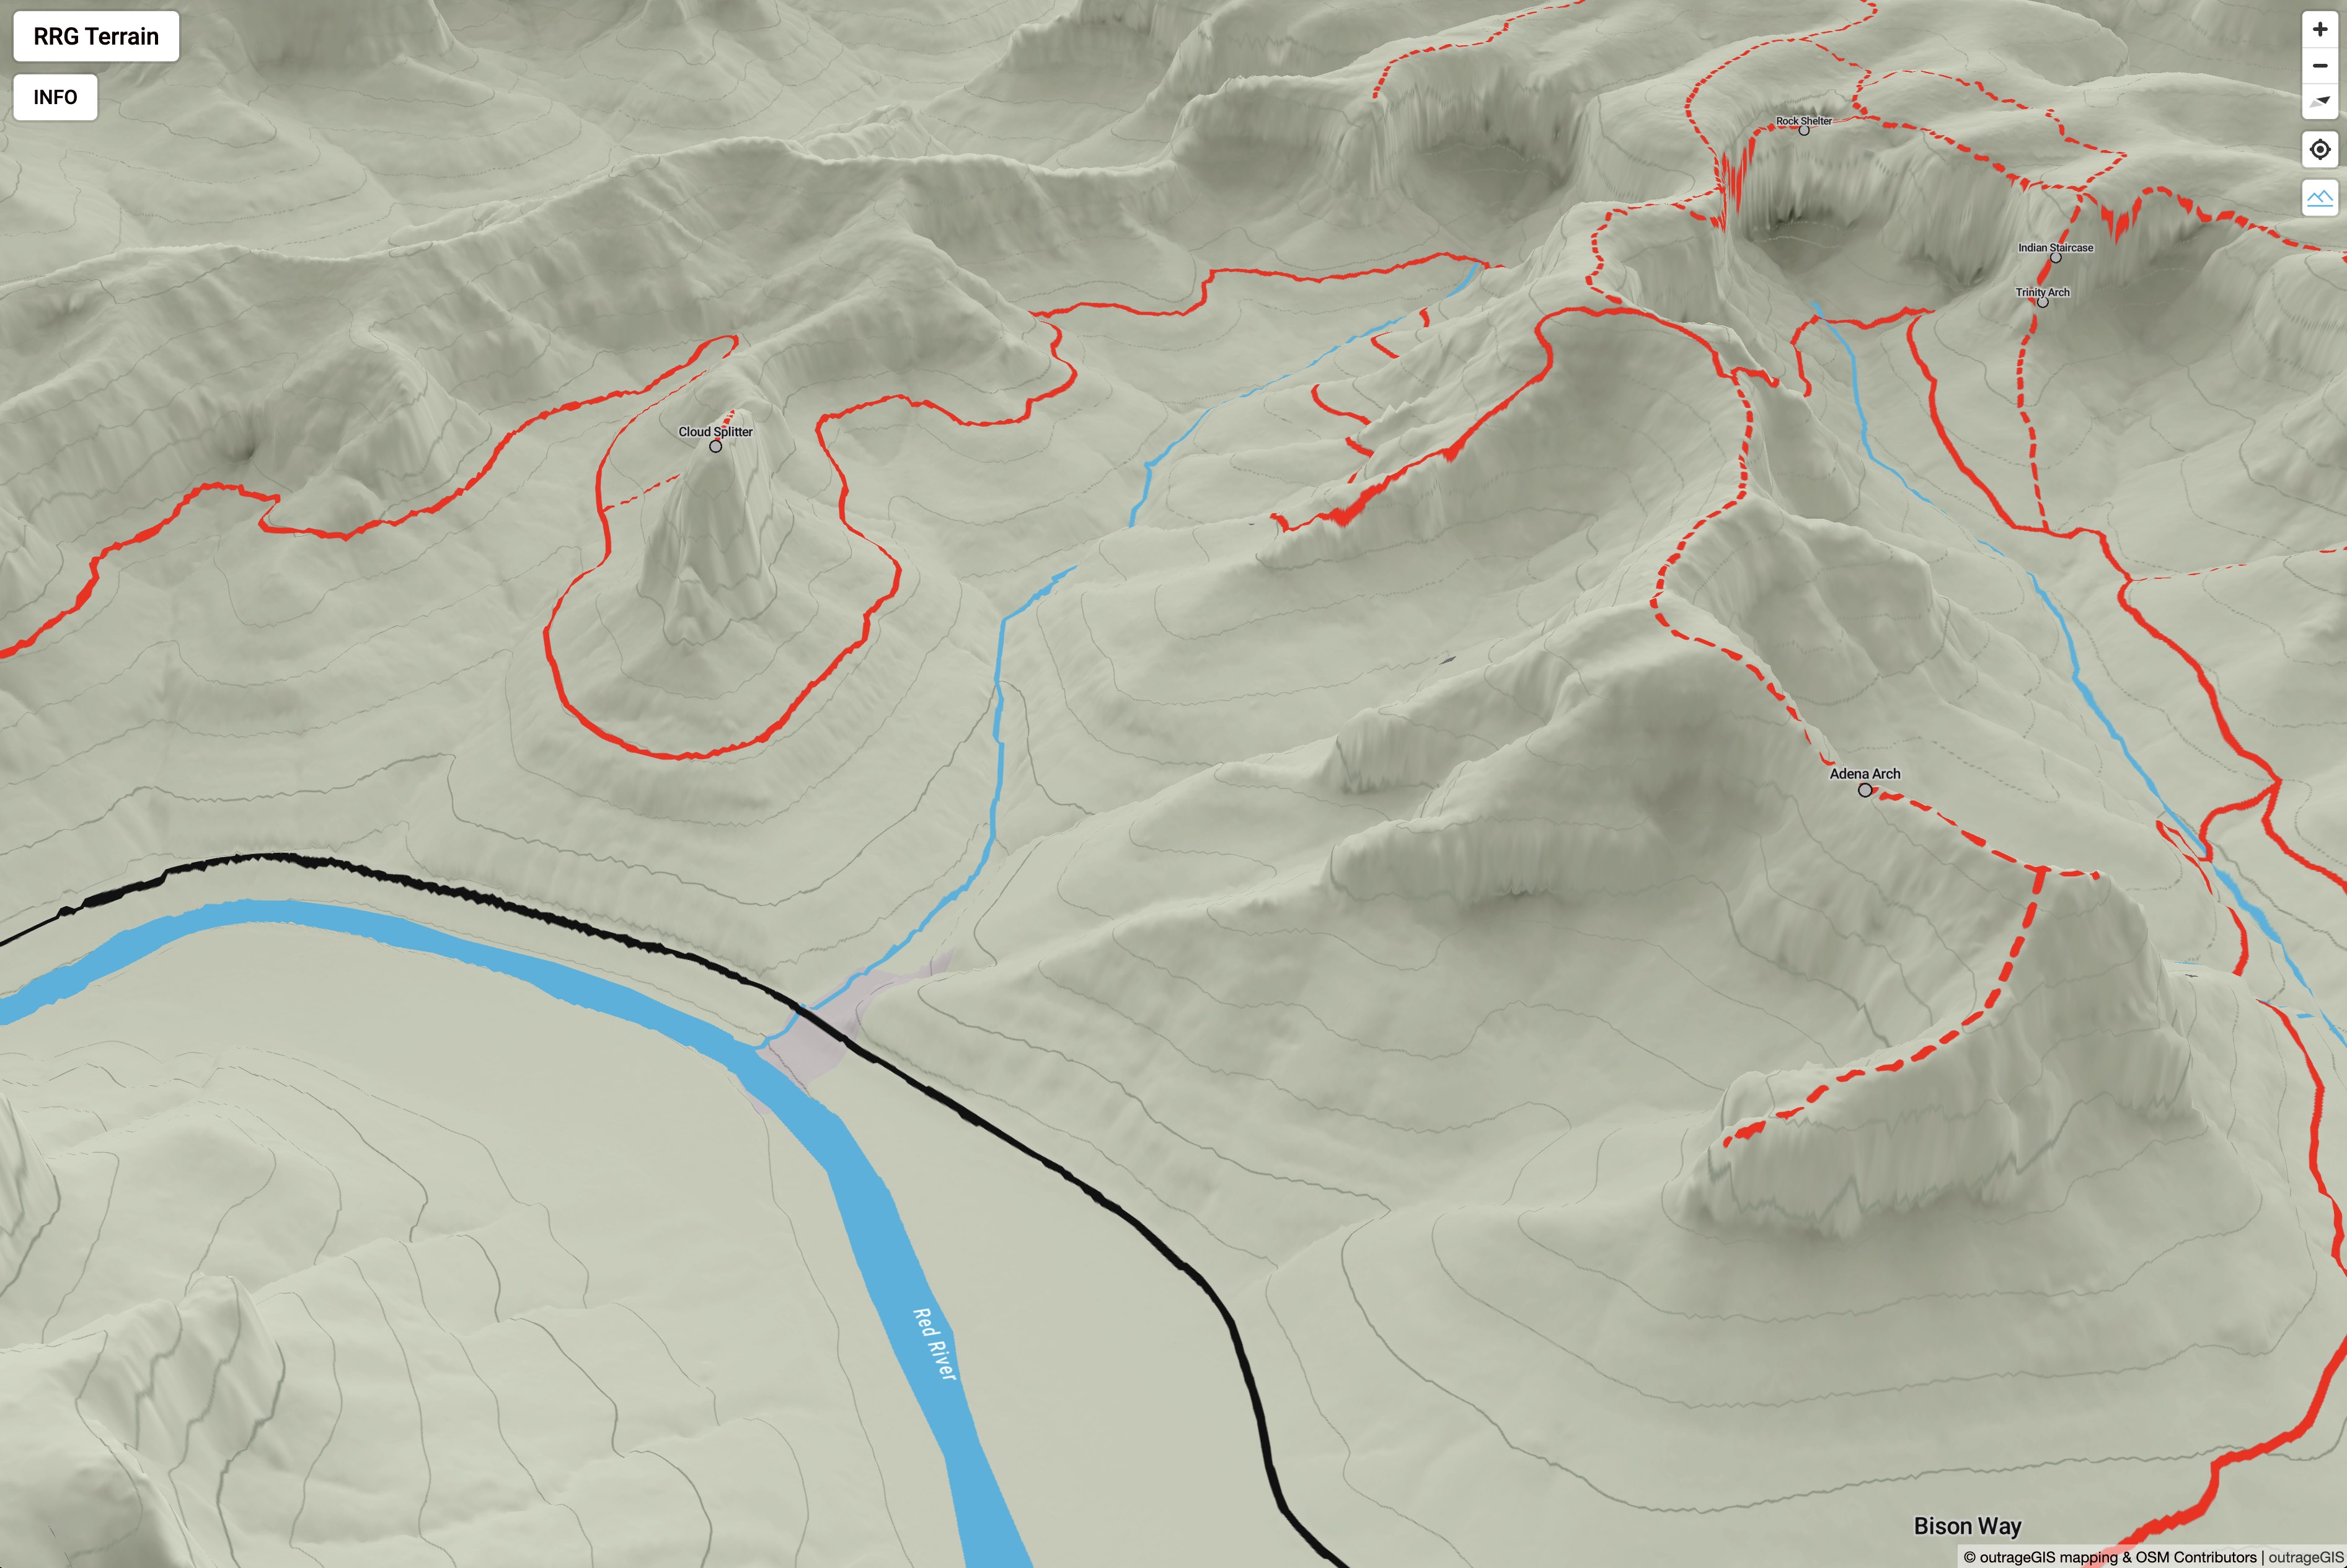
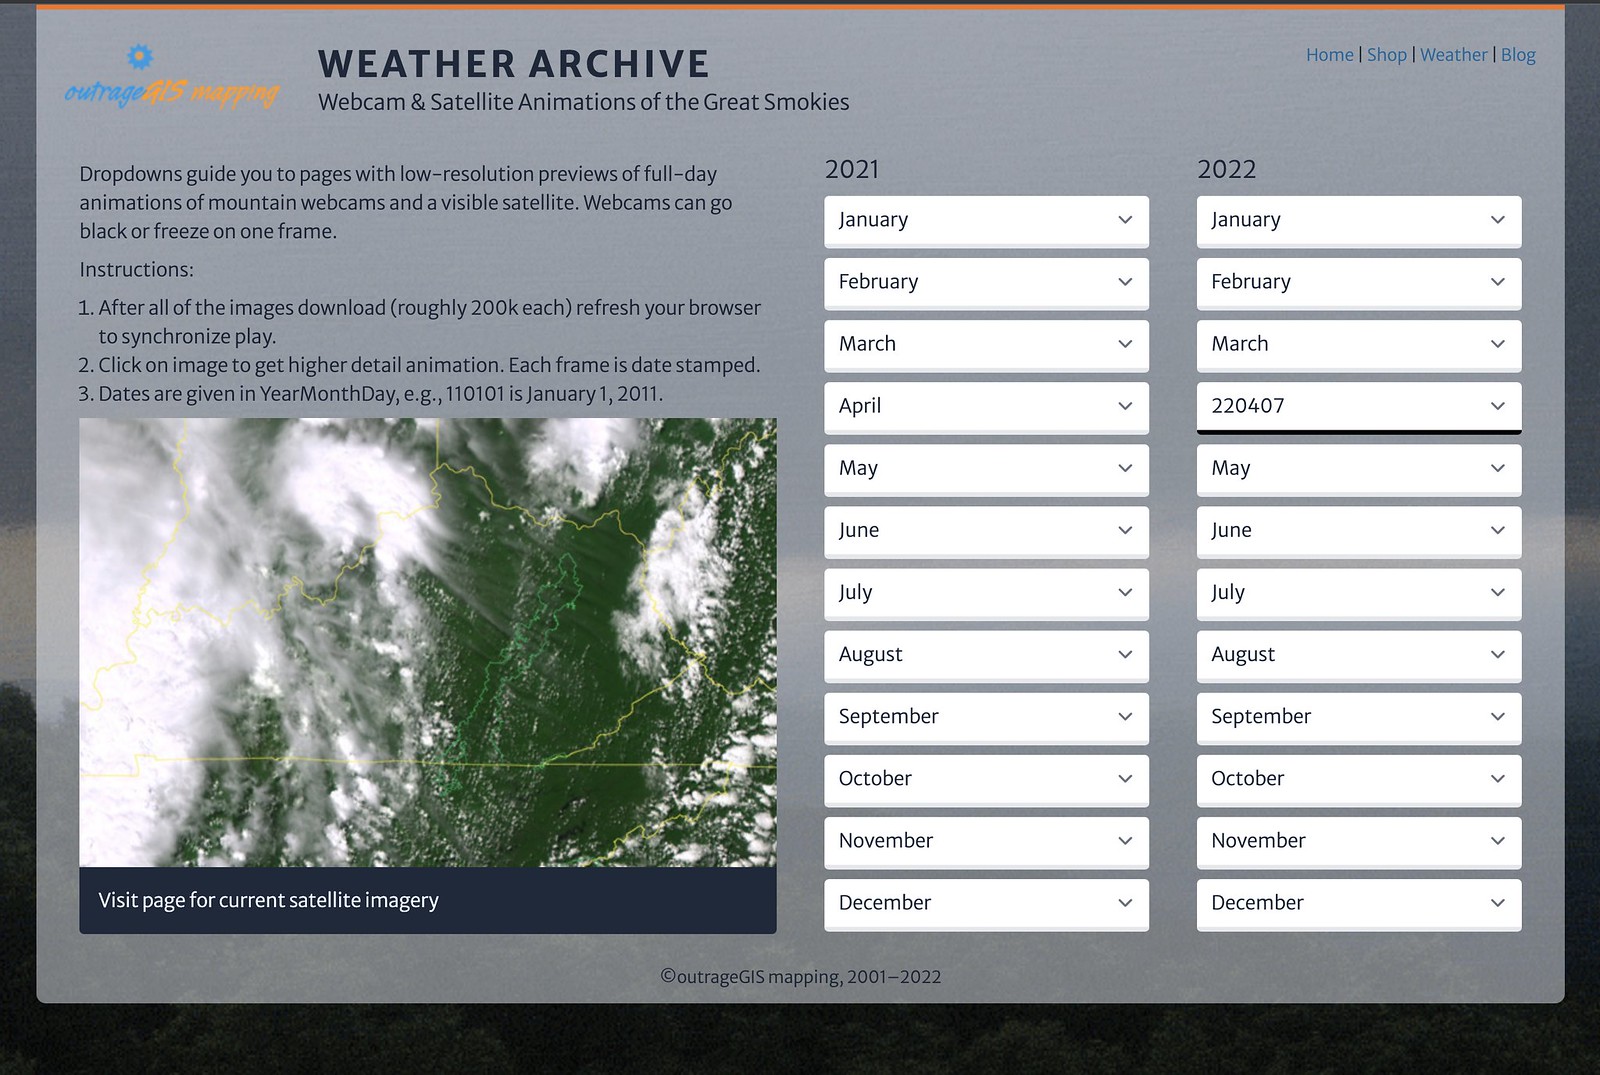
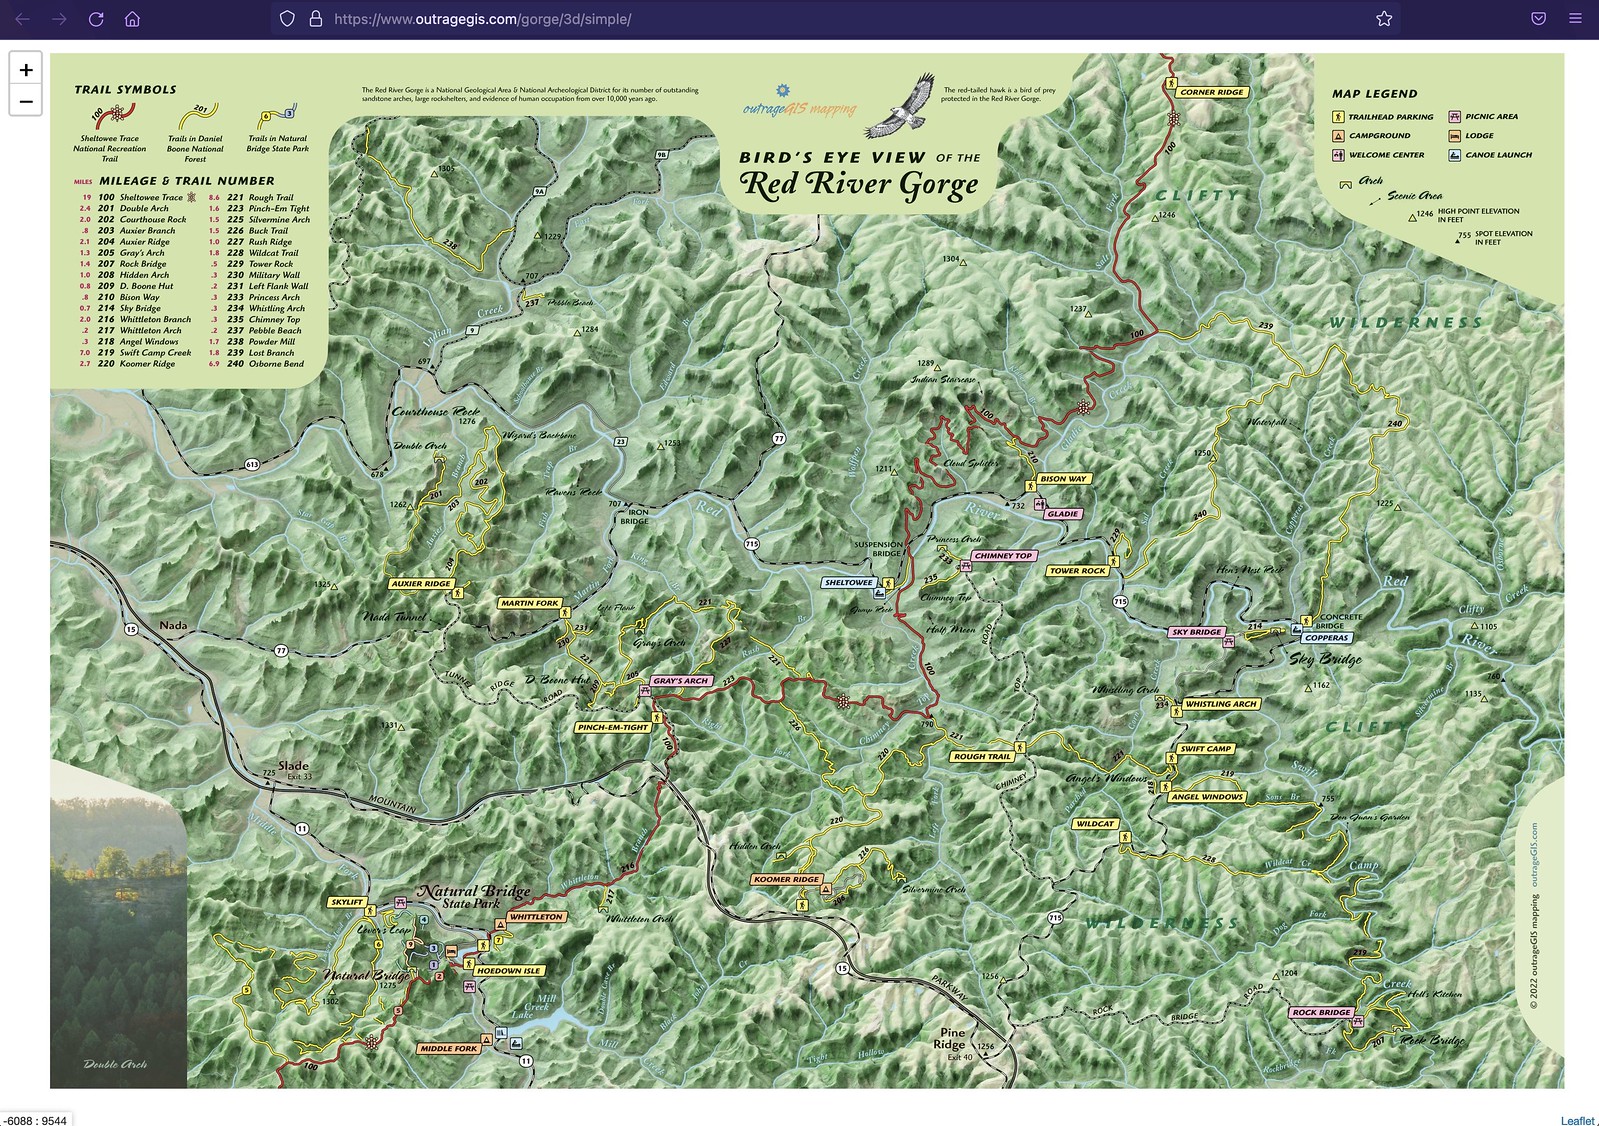
 Above is an screen capture of the Kentucky Topo map for the state. Other base maps include, lidar-derived surface models and current GOES-16 imagery.
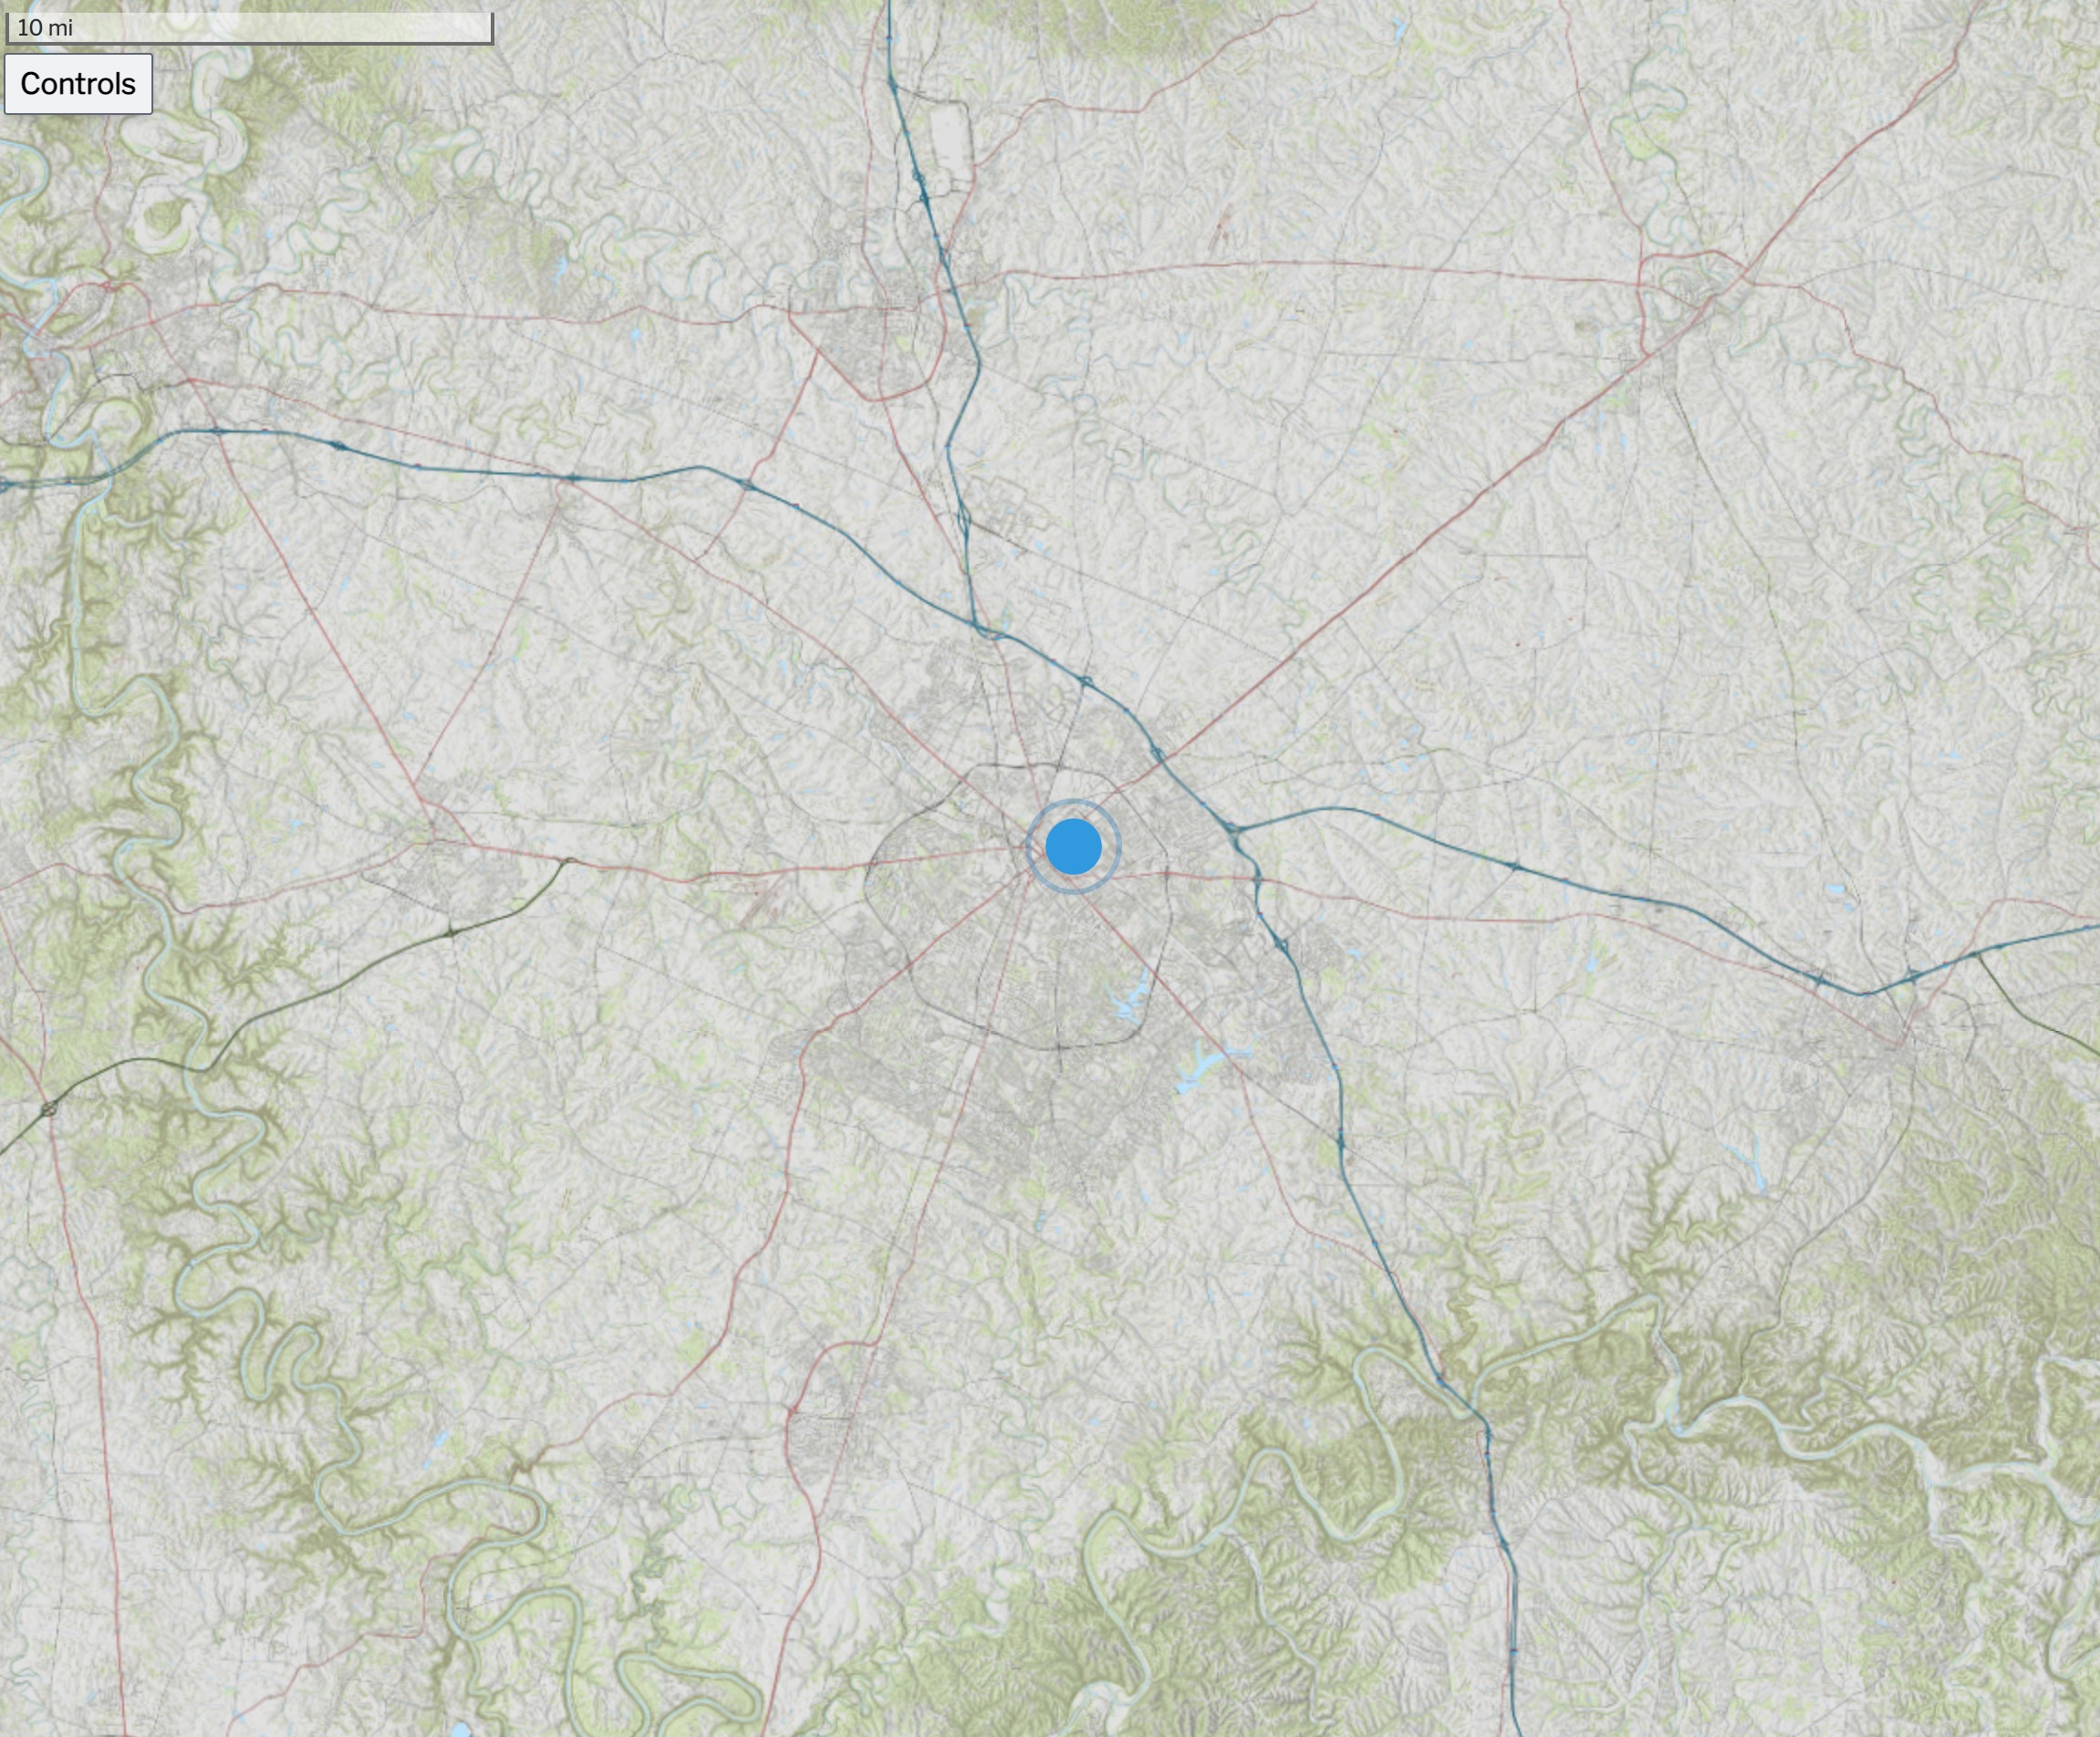
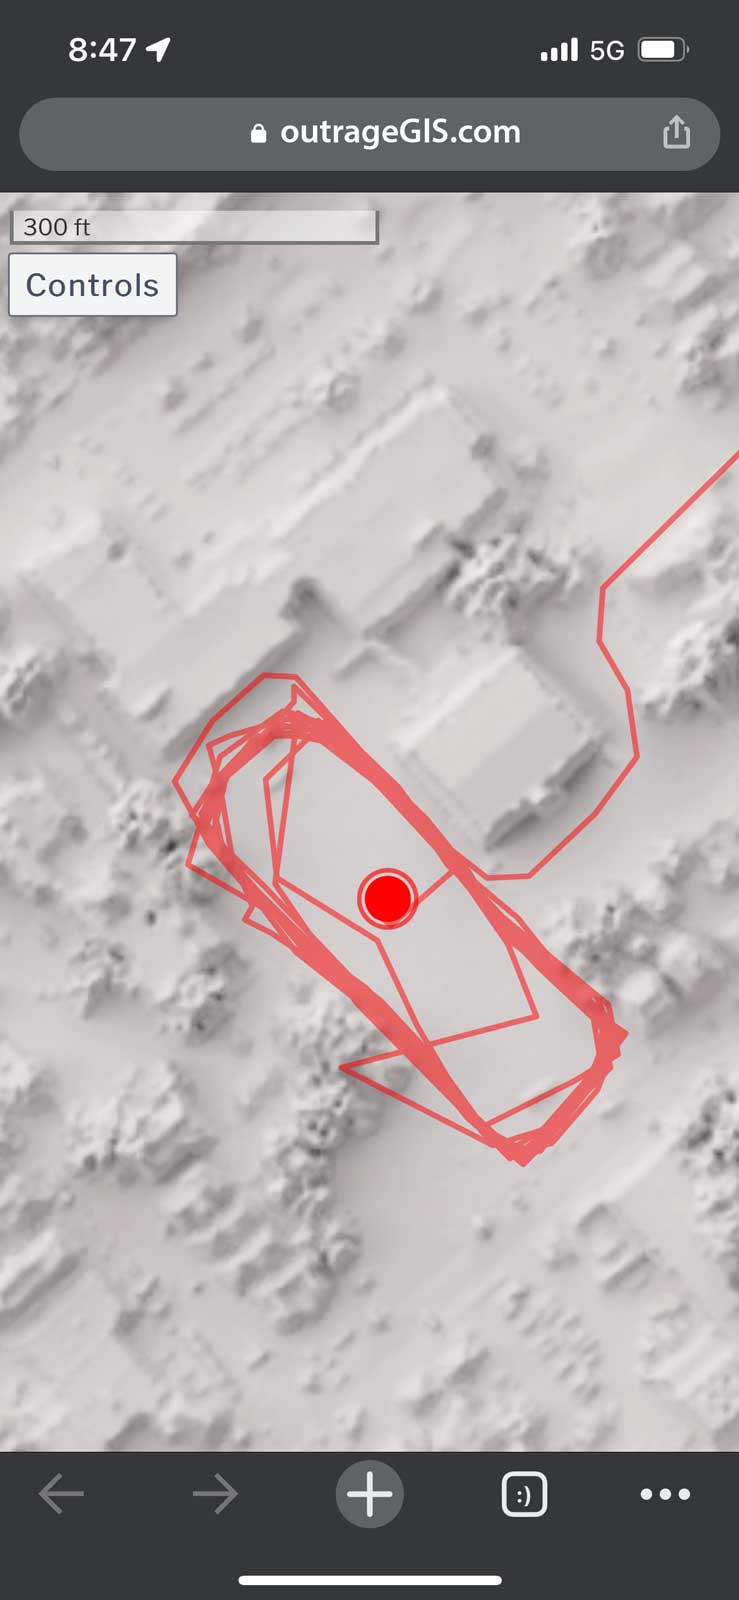 Screen capture of track mapping on a mobile device