outrageGIS.com started in 1999 and has been continuously online since then. The first version of the website had this animated GIF. Check out the evolution of the site on the Wayback Machine.

While we are known for trail maps, we started mapping for video animation and broadcast graphics. You might remember your nightly local news in Kentucky and seeing maps—we might have contributed to that graphic.
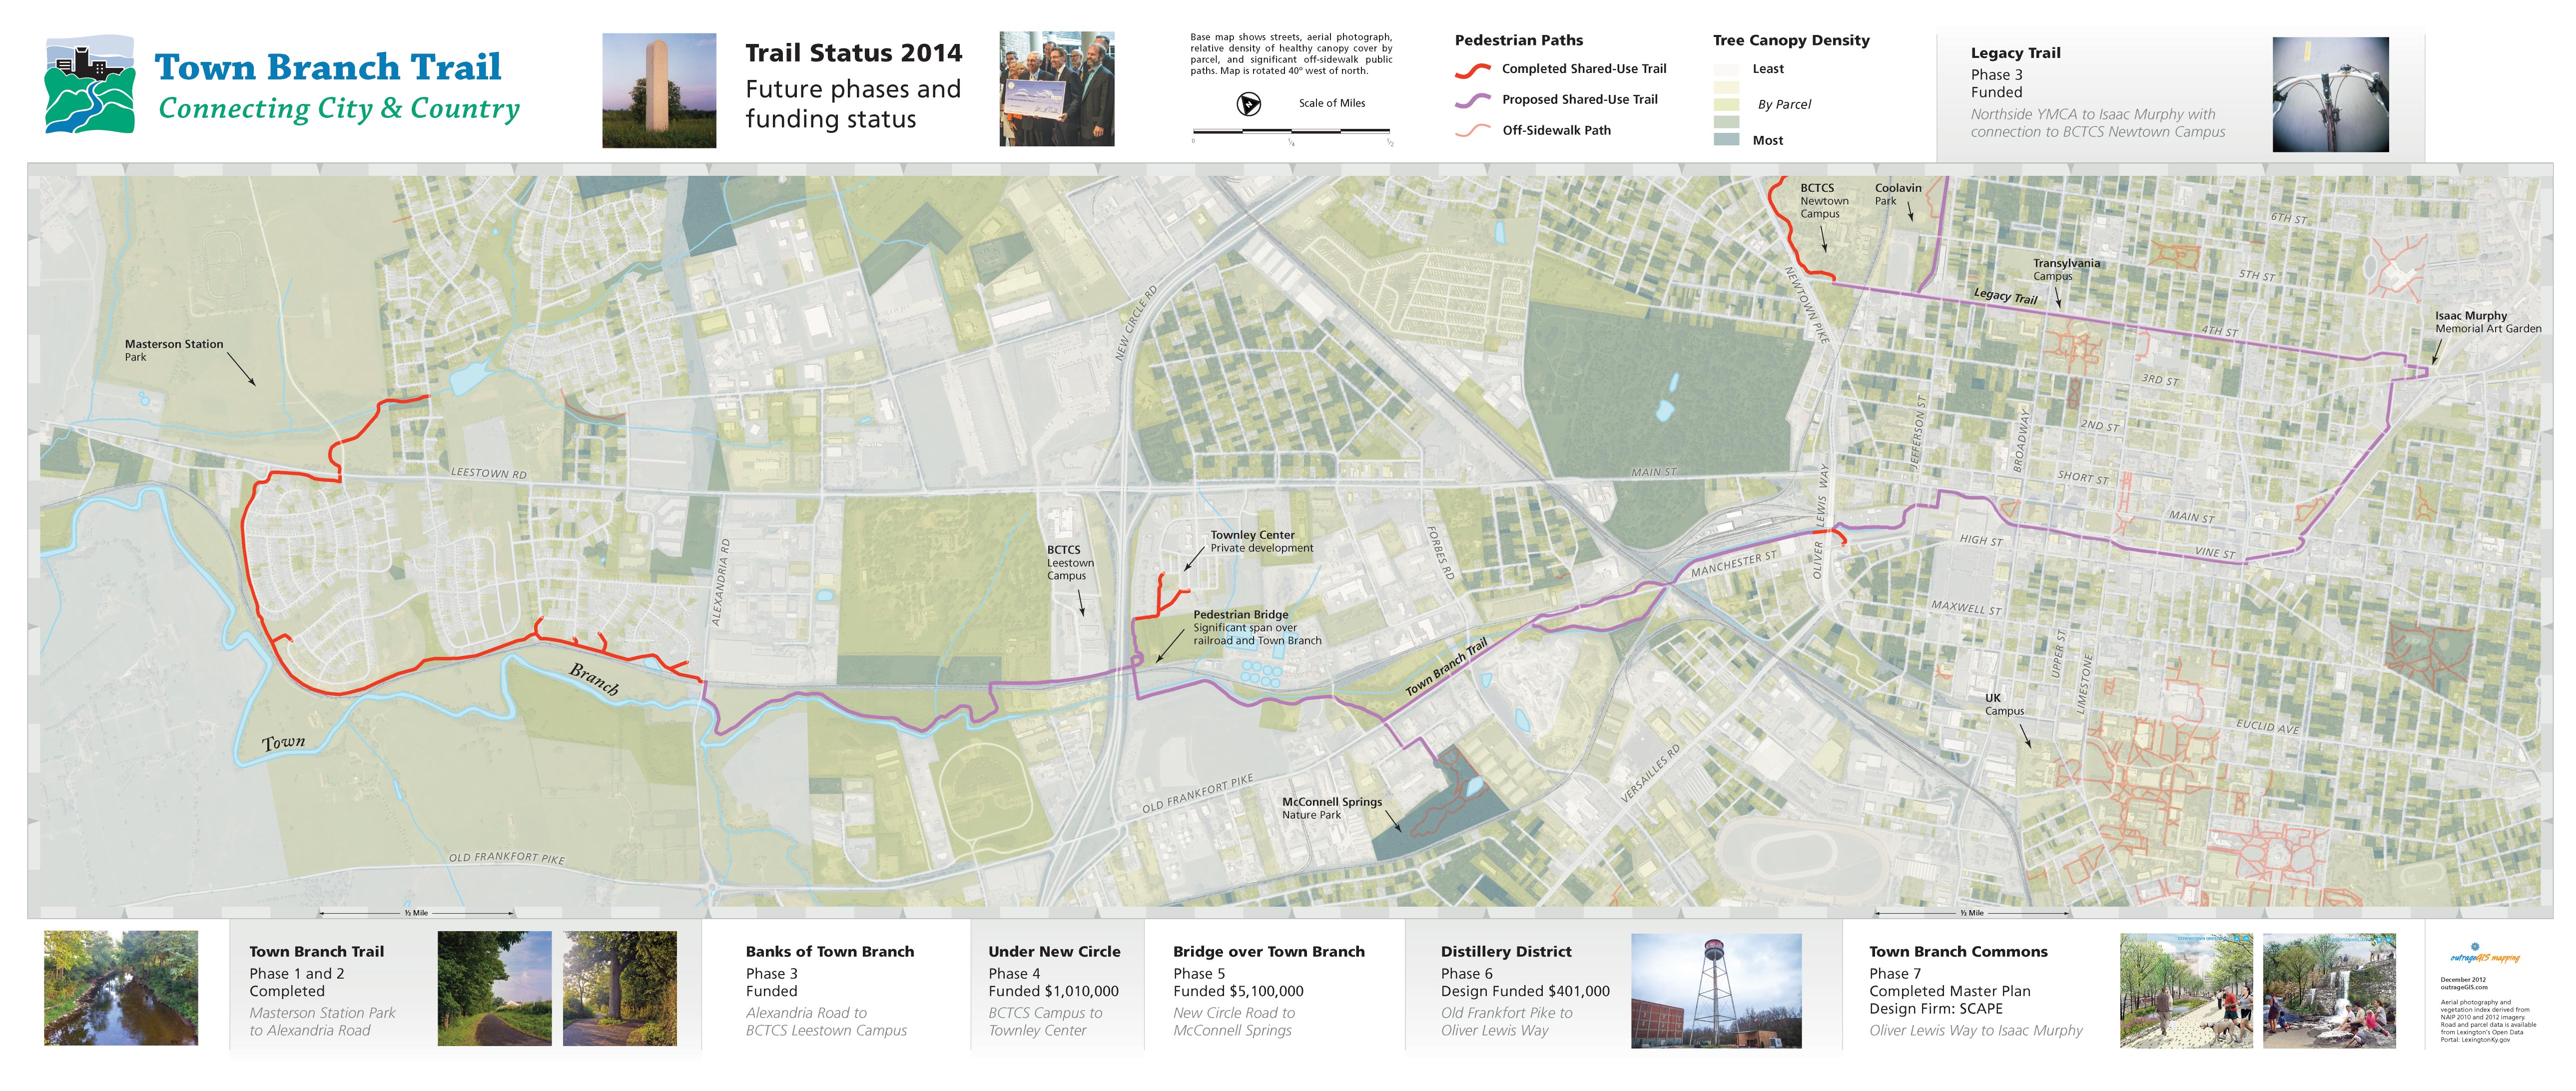
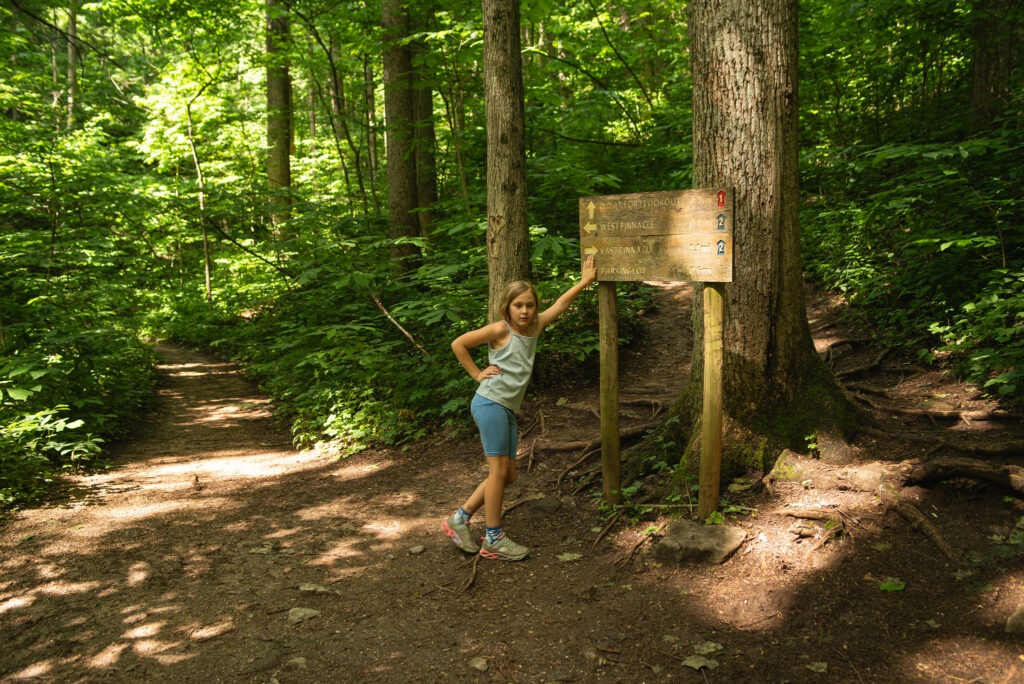
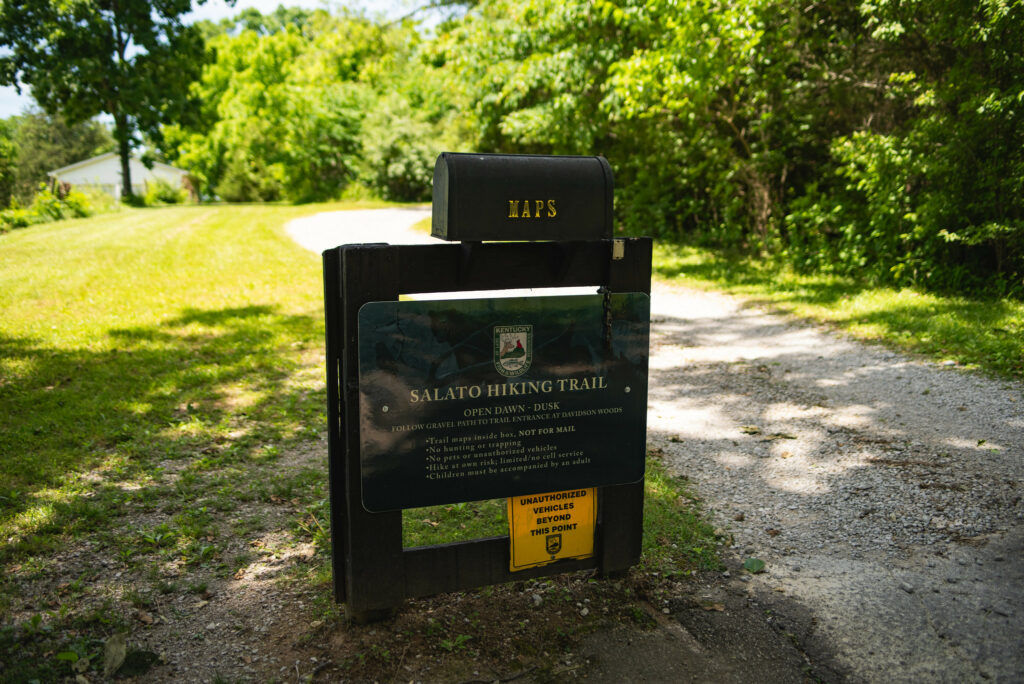
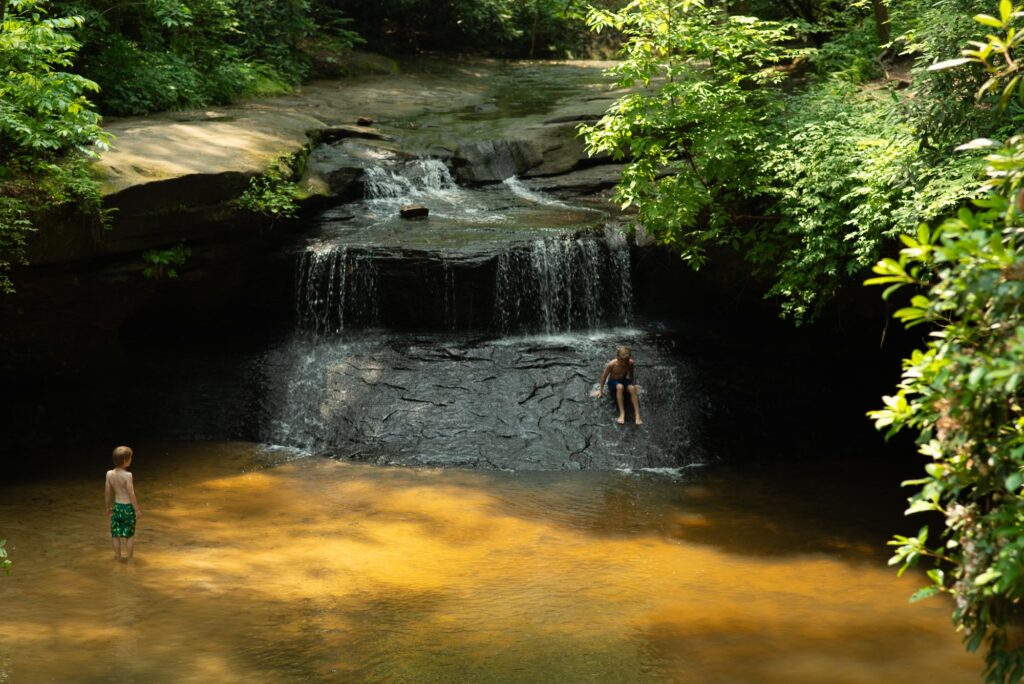
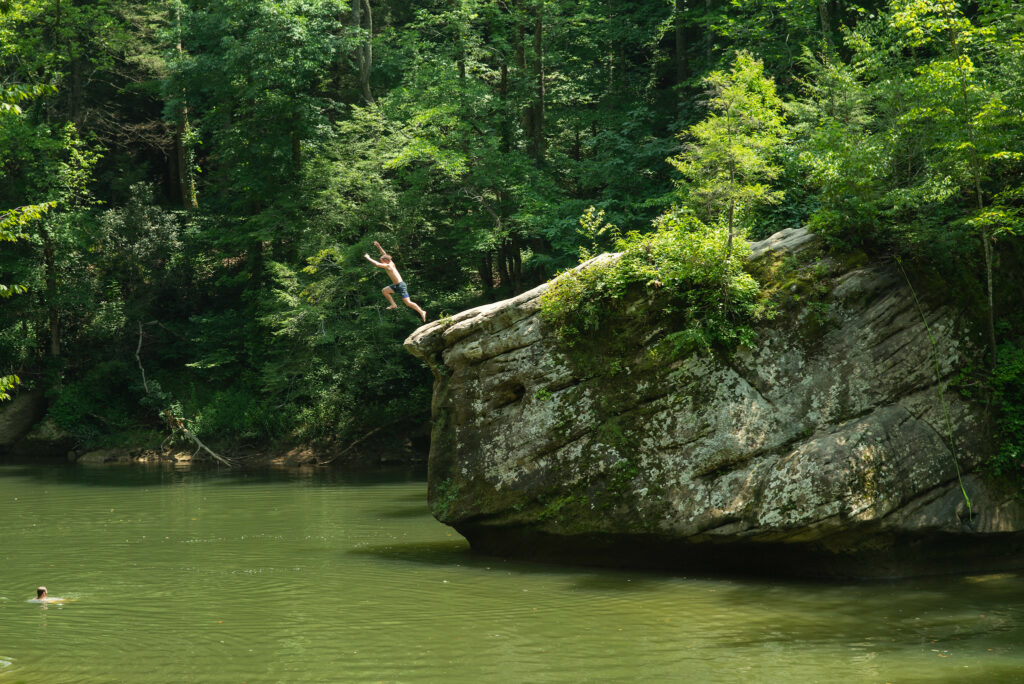
In the early 2000s, we slung on a Trimble Pro XRS backpack GPS unit, outfitted a one-color offset press studio, and began printing spot and process color maps. Our first title was the Red River Gorge trail, a two-color map that we sold in local gas stations. We then printed titles for the Big South Fork, Great Smokies, Cumberland Gap, and the Daniel Boone National Forest. We did numerous contract maps for state parks and non-profits, and even an audio driving tour, The First Frontier Audio Driving Tour.
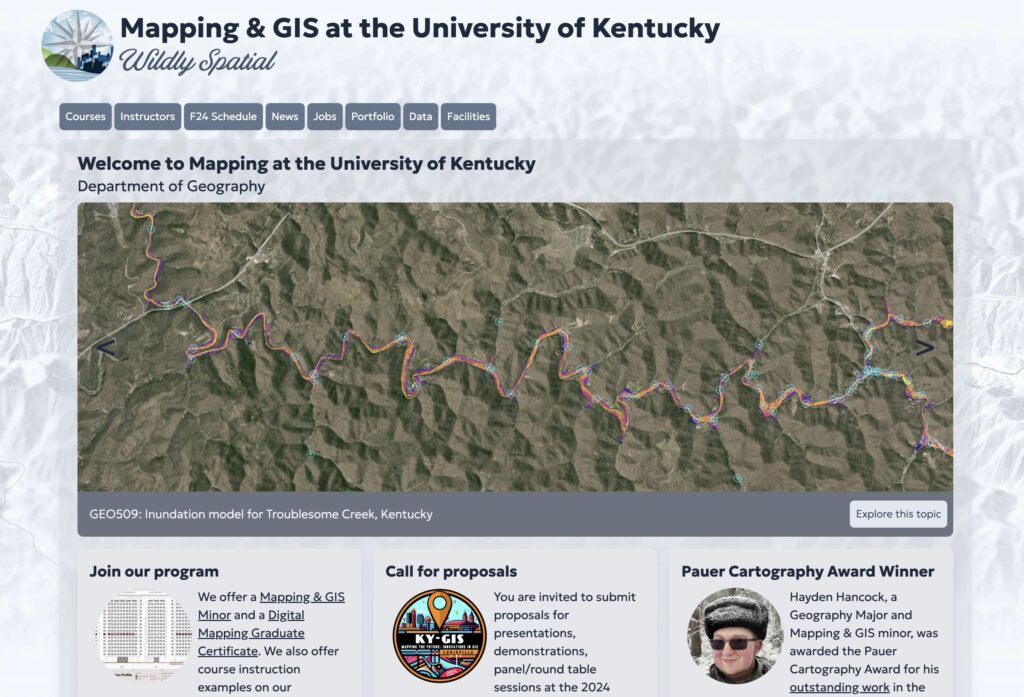
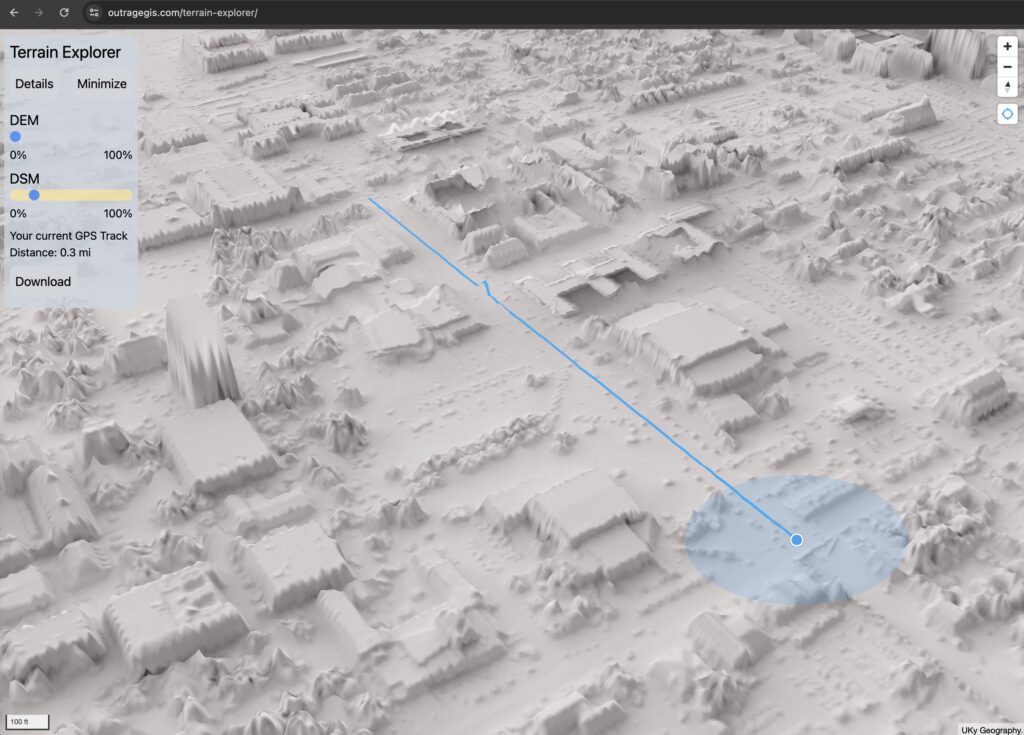
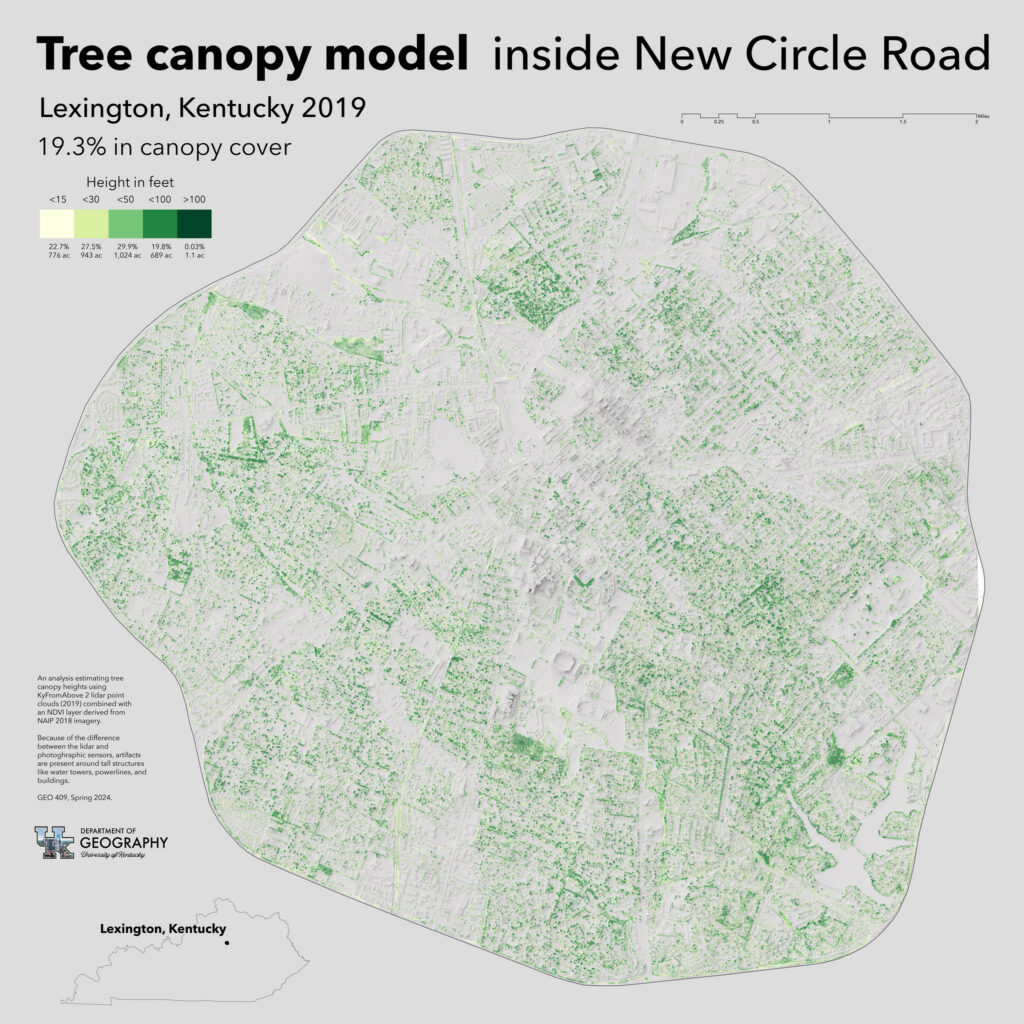
In 2008, Boyd started teaching at the UKy Department of Geography and accepted a faculty position in 2018. His work focuses on terrain modeling and topographic mapping using lidar data. Periodically, outrageGIS mapping is brought into the classroom to demonstrate web and digital media technologies.