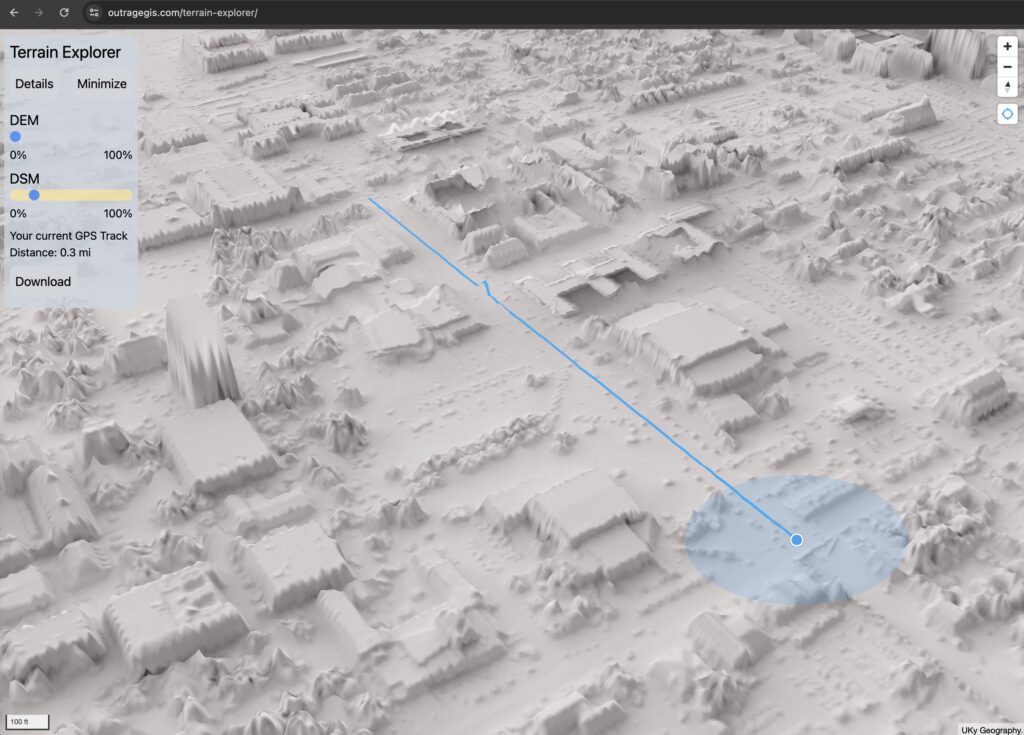
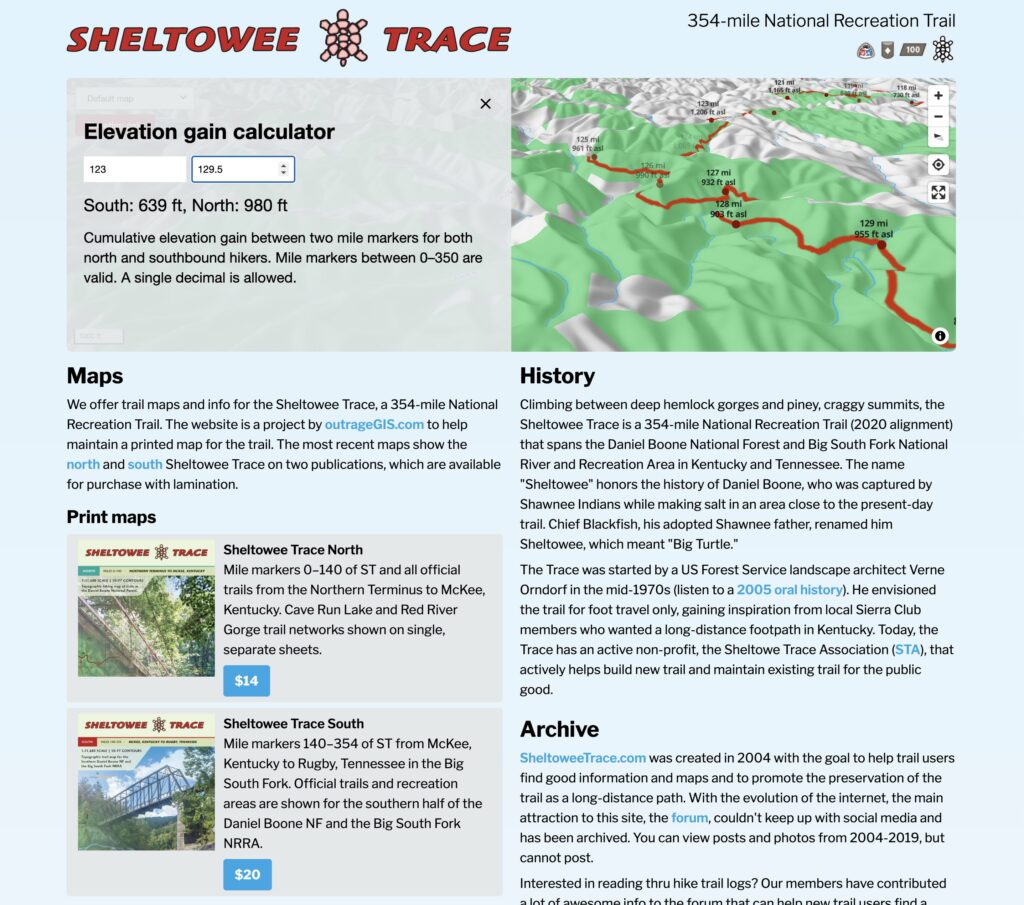
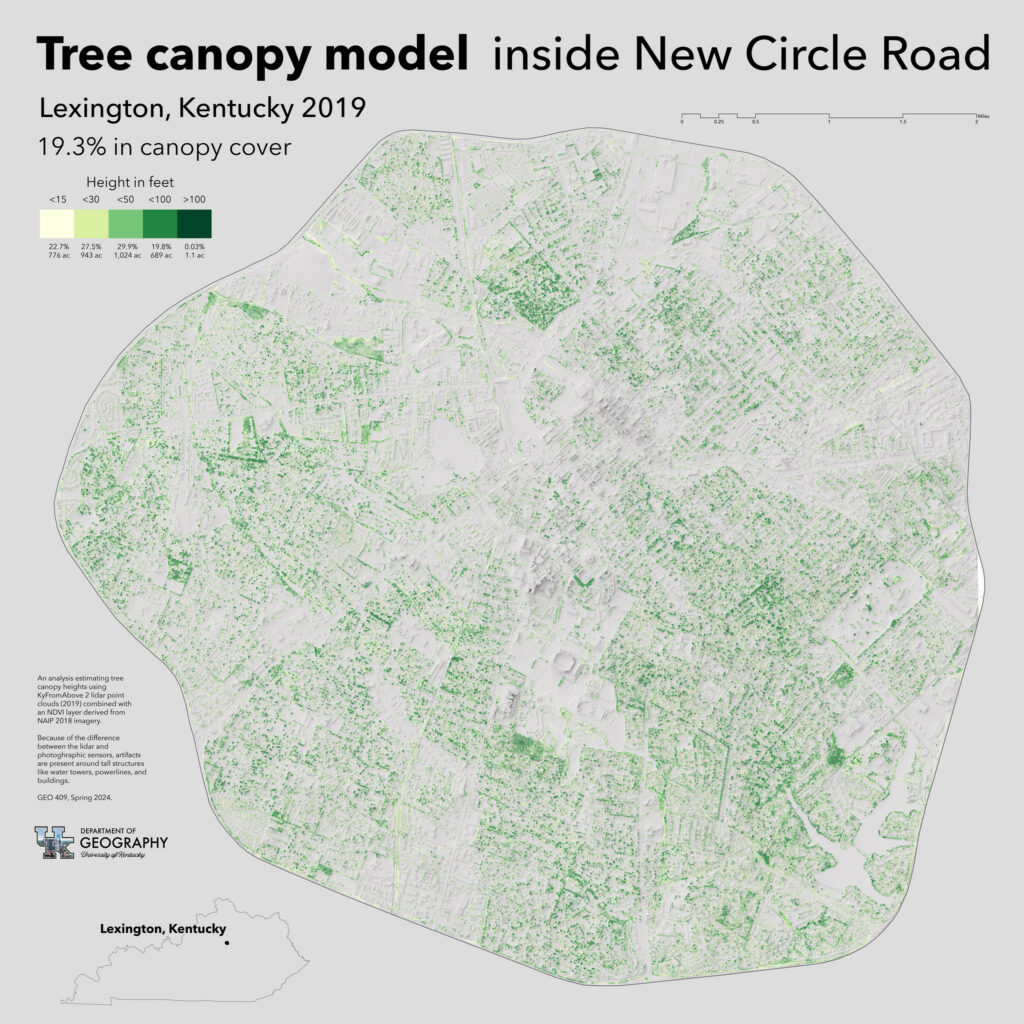
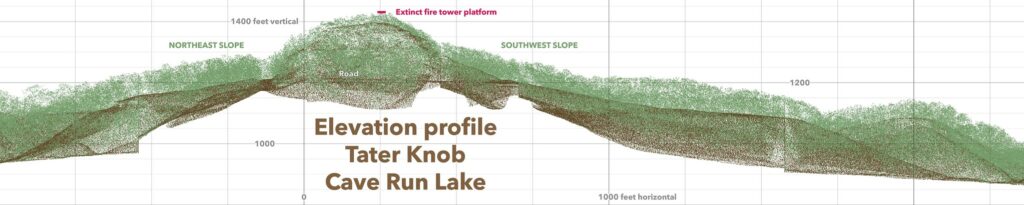
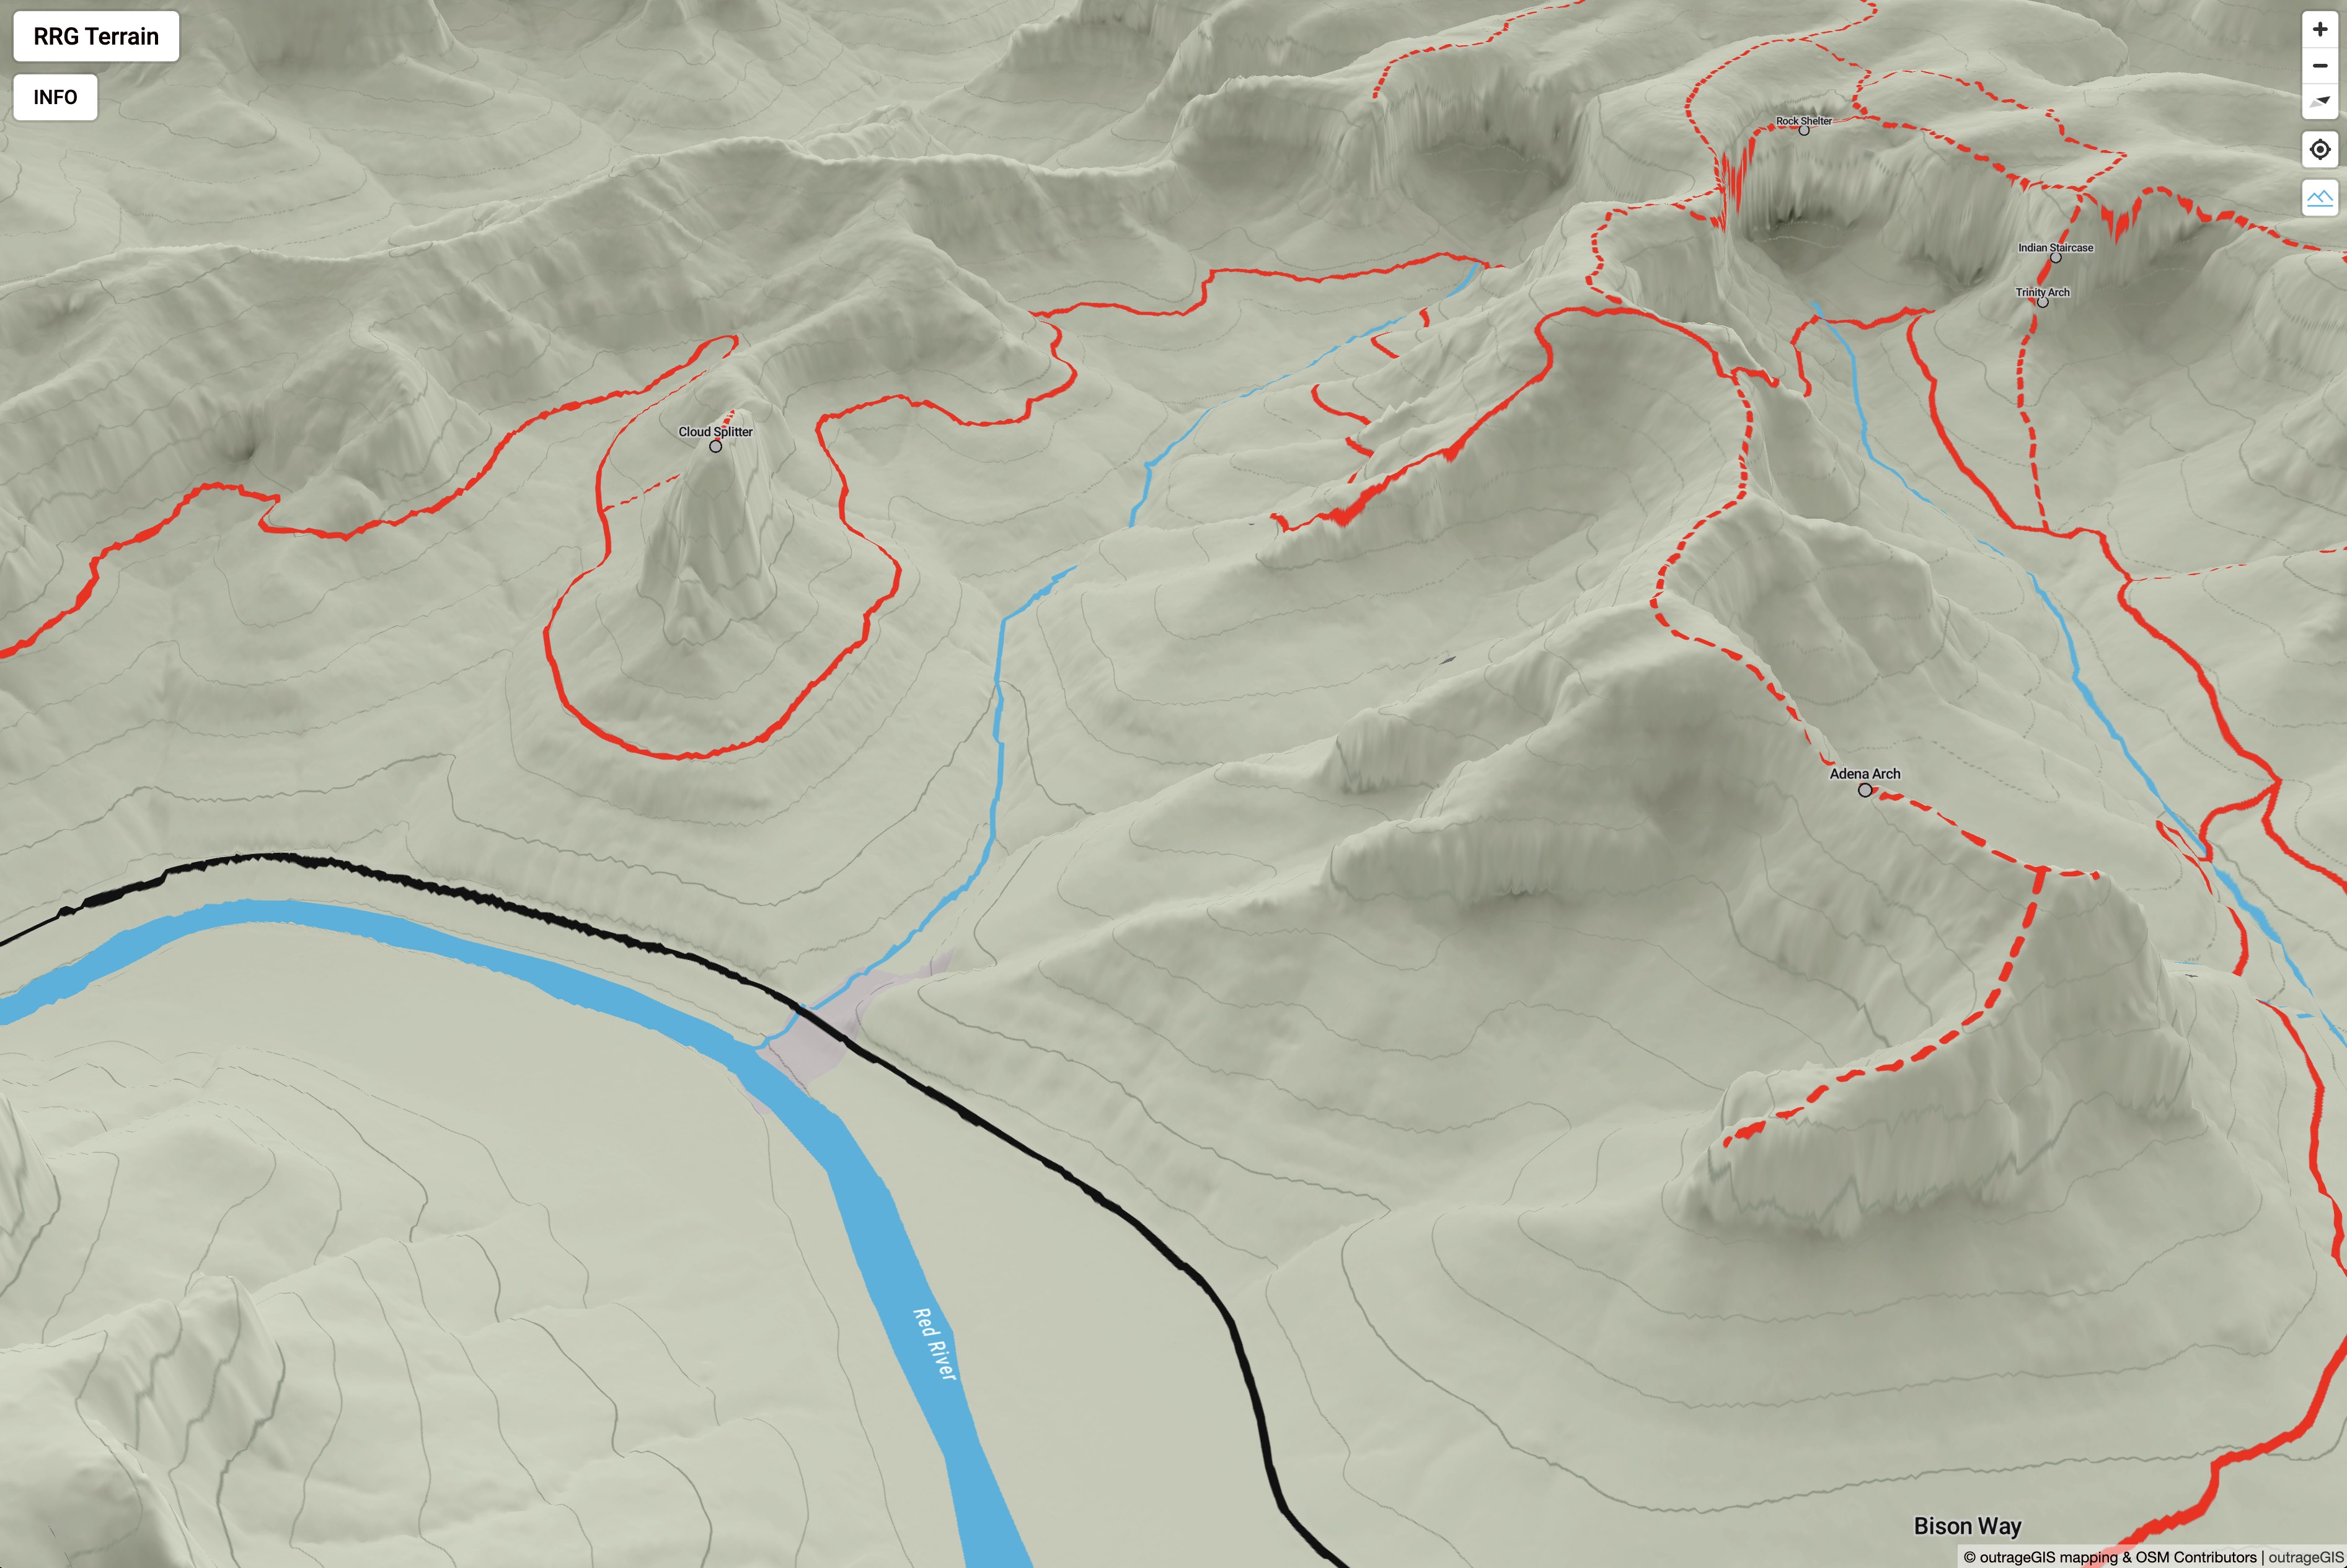
How much elevation gain did you have on your last Sheltowee Trace hike? We built a calculator and elevation profile on SheltoweeTrace.com.
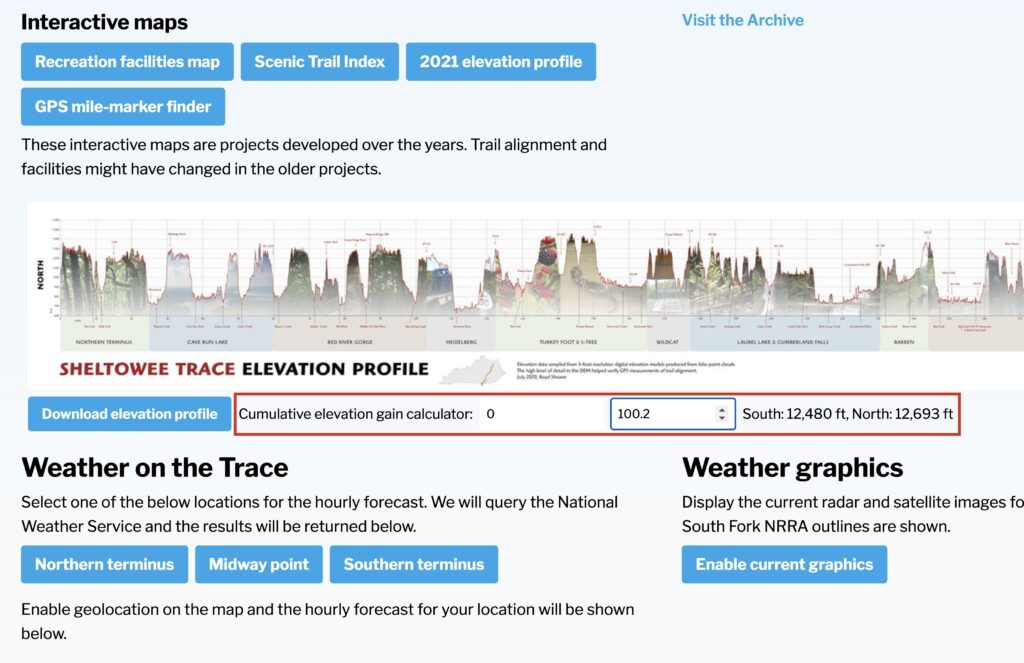
The data used in the calculator is pulled from lidar point cloud elevations created in the mid-2010s. Digital elevation models (DEM) derived from these point clouds have a 5-ft spatial resolution and are detailed enough to show wider trails in shaded relief rendering of the DEM. The point elevations for the Sheltowee Trace are sampled every 1/10th of a mile and allow for calculating gains between mile markers with a single decimal place. The result shows both southbound and northbound gains.


You must be logged in to post a comment.