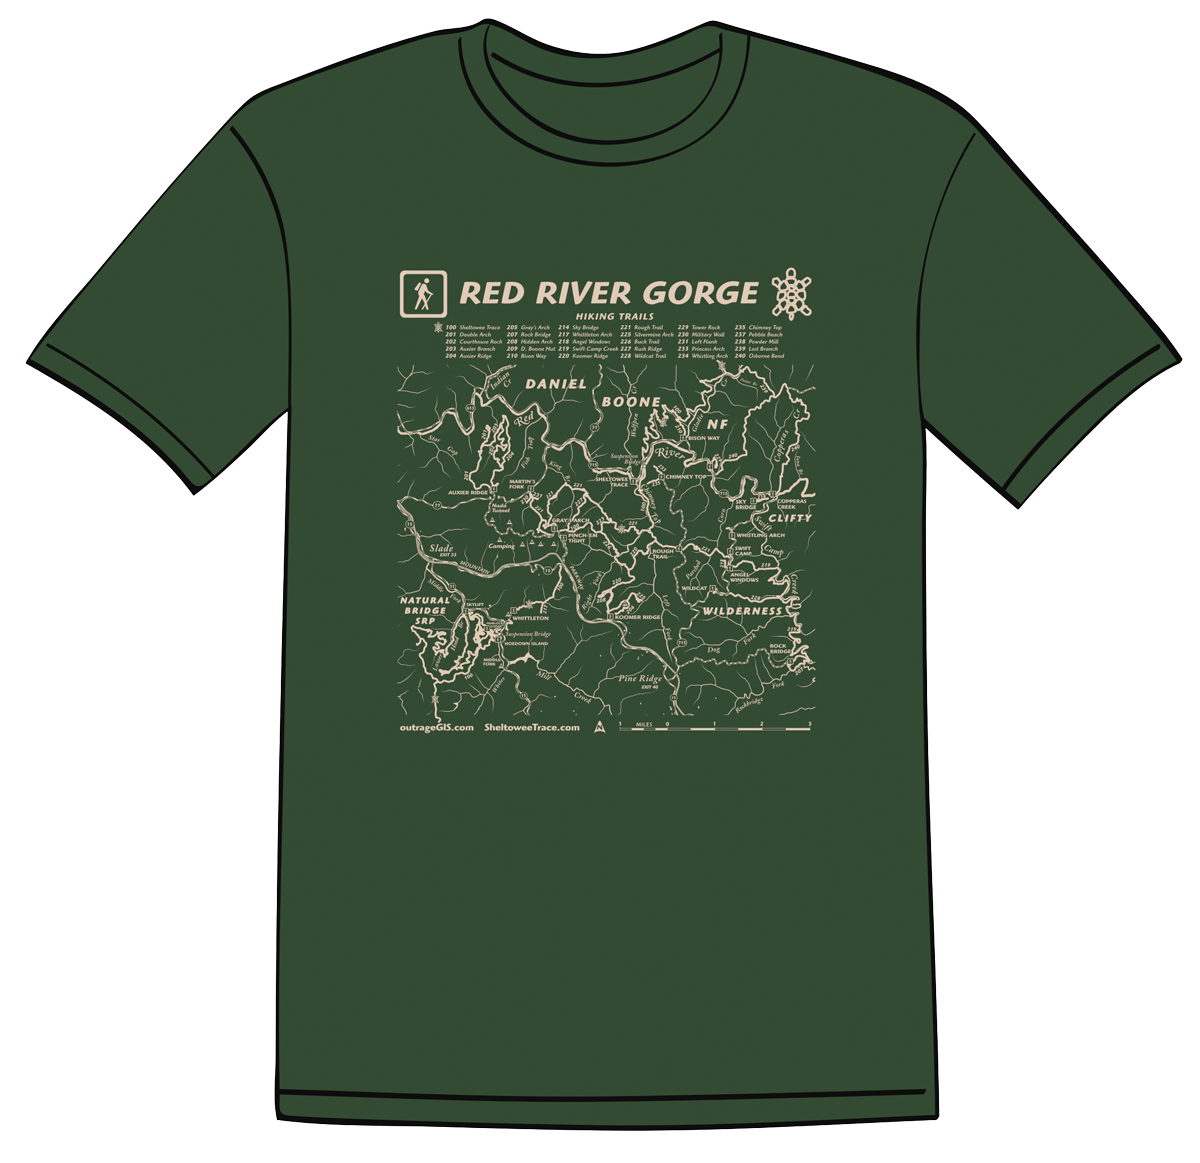
Audio driving tour on SoundCloud

Listen to audio

Listen to audio

We’ve added our audio driving tour for Cumberland Gap and Pine Mountain to SoundCloud. This self-guided tour will show you over ancient buffalo traces and Native American trails that frontier settlers cut into roads seeking the fertile lands of Kentucky. You will walk through Cumberland Gap where the Wilderness Road and the Warrior’s Path meet and look out upon America’s First Frontier. Along the Kingdom Come Scenic Parkway, you will hear the rushing headwaters of the mighty Cumberland River.

https://soundcloud.com/boydx

Download audio and maps: http://www.firstfrontier.org/tour/FirstFrontier-Audio196kbps.zip

East End Preservation Project map

East End Preservation Project map

East End Preservation Project map

A map historically significant homes and structures in the Martin Luther King and William Wells Brown neighborhood associations; many have connections to African-American work and life over the past two centuries. It was a pleasant afternoon walking Onabits, aka lil’ blue eyes, and taking photographs in my neighborhood. With the growth of the north Limestone corridor and the planned development of the Midland and 3rd street area, it’s important to recognize the history that resonates through downtown Lexington. We’ll come back in 10 years and see how many of these structures remain.

Base map for Salt Lake City hiking

East of Salt Lake City

East of Salt Lake City

A client needed a base map for an upcoming hiking guide to areas east of Salt Lake City. We came up with a simple, clean photoshop file using NAIP aerial imagery and 1/3 arc-second seamless DEM. The NAIP was used to create an NDVI and estimated canopy cover and the DEM was used as a shaded relief and to generate 40 ft contours. The NDVI and shaded relief were used for emphasis and helped make the aerial ‘pop’ a little more. Lakes and perennial streams were added, but as you can see the don’t register perfectly with the aerial image.

Norris Watershed Trail Map

Norris Watershed Trail Map

Norris Watershed Trail Map

Over the past year, we’ve refined a trail map for the City of Norris, Tennessee. The Norris Watershed Trail Map is probably printed by now and offers GPS mapped trails and mountain biking opportunities. The WPA era dam is pretty cool, too.

[Read more…]

City of Rocks and 3D mapping offer teaching moment

City of Rocks example visual

City of Rocks example visual

With the quality of elevation data increasing, especially with the availability of LiDAR data, we have an opportunity to make unique visuals. Recently Wolverine Publishing needed maps developed for the climbing area, City of Rocks in Idaho. The project needed high-resolution maps and the data was available through public sources. We like making the physiographic base maps for recreation areas and this offered a special challenge. [Read more…]

Lexington Bike/Ped versus Car Collision Analysis

Website of collision maps

Website of collision maps

For a GIS course at the University of Kentucky Department of Geography (GEO 409), we mapped and analyzed the incidences of car collisions with pedestrians and bicyclists. Using data from Kentucky Crash Analysis Wizard (crashinformationky.org), we harvested collisions for Fayette County from January 2004 until April 8, 2016, the entire dataset at that point in time. 

The website of collision maps is available here: http://boydx.github.io/collisions/ and the bike map is http://boydx.github.io/collisions/bikes

[Read more…]

Swift Camp Creek Trail interactive 3d map

Explore a 3D view of Swift Camp Creek

Explore a 3D view of Swift Camp Creek

This interactive 3D map was built in QGIS using a add-on named QGIS2Threejs. The add-on builds the model from digital elevation model in QGIS and drapes the layers symbolized in map view over the model. It utilizes javascript to make interactive in browser.

Explore the Swift Camp Creek Trail in the Red River Gorge with this 3D map. Learn more about this trail in our hiking trail page.

Weather station almost full!

Happy New Year to you! We invite you to our four year anniversary of documenting weather animations in the Great Smokies. When we move into 2016, we’ll cycle out the observations for 2012. Over the past dozen years we’ve documented weather for areas our maps cover. More recently, we’ve offered an online media library of webcam and satellite animations and daily weather summaries for the Great Smoky Mountain National Park. They’re offered as animated GIFs for three webcams and a visual GOES satellite for the region.

Four years of webcam animations

Four years of webcam animations

In short few hours, we’ll have four complete years of these webcams. If you need a nice sunset or sunrise, feel free to explore the archive.

As we look to the future, we’re excited to investigate the public data that many personal weather stations are feedings services like Weather Underground and Netatmo. We’ll start aggregating weather station data for our hiking areas and offer it here. That’s a goal for 2016!

Lexington’s Urban Canopy

An exploration of canopy cover measures

An exploration of canopy cover measures

How much tree canopy covers the urban service area of Lexington, Kentucky? Inspired by the Davey Resource Group’s October 2013 study of canopy cover using 2012 NAIP imagery within Lexington’s Urban Service Area, a GIS class at the University of Kentucky created a similar, though limited, evaluation. [Read more…]

Pine Mountain Canopy Tour

Canopy zipline tour mapping assignment

Canopy zipline tour mapping assignment

What wild weekend and mapping task! Boyd led an undergraduate GIS class at the University of Kentucky and endeavored to map and analyze environmental tourism assets on Pine Mountain. During discussions with Pine Mountain State Resort Park, we discovered a canopy zipline tour, one of the first in the state, was being installed in the park. [Read more…]

Sheltowee Trace South, 2015

Six 19" x 27" pages

Six 19″ x 27″ pages

We’ve finished our Sheltowee Trace South, 2015 map. This rich color topographic trail map includes almost the entire Big South Fork National Recreation and River Area and the southern half of the Daniel Boone National Forest.

Map is six 19″ x 27″ pages and is available laminated. Check it out!

Woodland Art Fair, 2015

Come down to the Woodland Art Fair this Saturday and Sunday,  August 15 and 16. We’ve made big progress on the Sheltowee Trace South map and we’ll have samples to show at our booth.  While in the same format as Sheltowee Trace North map, we’re adding an additional sheet to cover the Big South Area.

Working draft of the Sheltowee Trace South map

The fair runs from 10 a.m. to 5 p.m., or there abouts. We’ll stay as long as you’re visiting!

Our booth location and coordinates are shown on the below map. We’ll be between Troublesome and Difficulty Creeks, at least spirit! Find us on the Woodland Christian Church side of the fair at the shady bottom of the hill.

Robinson Forest Camp Trail Map Exercise

Robinson Forest Camp trail map

Robinson Forest Camp trail map

As part of UK Natural Resources and Environmental Sciences 2015 Summer Camp, I taught a one-day GPS and GIS exercise to map the interpretive trails around base camp. With seven undergraduates and their mobile devices and one Trimble ProXRS, we split into three teams. One team focused on the trail network and GPS mapped trail alignment and intersections. A second team mapped interpretive sites on the left-side of trials, while a third-team mapped right-side features.

In the second-half of the day, we worked in the classroom and on laptops to make a map in ArcGIS. Some students had GIS software experience and helped their fellow classmates to make a map as a geospatial PDF and use on their mobile devices. A GeoPDF is a mobile map that doesn’t require a cellular data connection to function.

Student Observations and Analysis of UK Campus Celebrations

Basketball Celebrations

Map of basketball celebrations

During two weekends this spring, students in UK GEO 309 (Introduction to GIS) were asked to log celebrations associated with UK men’s basketball NCAA tournament around campus in selected zones. Student teams were then tasked to map and analyze these patterns of celebrations during the last week of class. Their maps and photographs are shown here.

Their topics include: locations of campus rental properties, noise pollution from major party locations, population density, and changes in social media engagement during and after games. 

Distress In Kentucky

Distress In Kentucky: Link to image

Link to image

Severe socioeconomic distress exists in both urban and rural block groups. Of the 311,000 people in severely distressed block groups, 60% are urban. In rural block groups, as socioeconomic distress increases, so do indicators of environmental distress. Rates of wildfire and surface coal mining nearly double between distressed and severely distressed rural block groups (chart 1).

DistressInKentucky_byBlockGroup_2015_ChartOne

A broader point can be made with this analysis. Adventure tourism is a growing business nationally and a determined focus of economic development in Kentucky. Many of these types tourists seek a large network of land and water trails, especially in pristine areas. Much of eastern Kentucky had this potential, except for the cycle of unsustainable surface mining and the attending boom-bust economy that left derelict landscapes. Poor areas with scarred lands face a much harder path attaining success in this new tourism. But there is always hope. Perhaps the type of adventures grow (e.g., ATV and bridal parks on large reclaimed strip mines) or maybe regional coalitions stitch together corridors of unaltered land. The benefits are not just in tourism dollars, but also in the activity of recreation. Imagine a distress index map that also included bad health indicators.

Map was created by Boyd Shearer for GEO 309, Introduction to GIS in the Department of Geography, University of Kentucky during the Spring Semester, 2015.

Sources of data:
Kentucky Department for Natural Resources, Division of Forestry. January, 2015.
Kentucky Department for Natural Resources, Surface Mining Information System (SMIS) database, accessed March 15, 2015: http://minepermits.ky.gov/Pages/SpatialData.aspx
Short, Karen C. 2014. Spatial wildfire occurrence data for the United States, 1992-2012 [FPA_FOD_20140428]. 2nd Edition. Fort Collins, CO: Forest Service Research Data Archive. http://dx.doi.org/10.2737/RDS-2013-0009.2
US Census Bureau. 2015. 2009-2013 American Community Survey (ACS) 5-year Estimates.

0

Your Cart