
Selected attributes symbolized from the North American extract: download.geofabrik.de/north-america.html
Selected attributes symbolized from the North American extract: download.geofabrik.de/north-america.html
Visit the full-screen map.
I began teaching at New Maps Plus in October 2015. Students have made many awesome maps since then. This ‘map of maps’ shows projects going back to early 2017. Many of the early projects utilized CartoDB (now CARTO), which has evolved considerably over the years. While technology and visualization techniques change, a map is also an artistic pursuit and perhaps can withstand the ebb and flow of tech design styles.
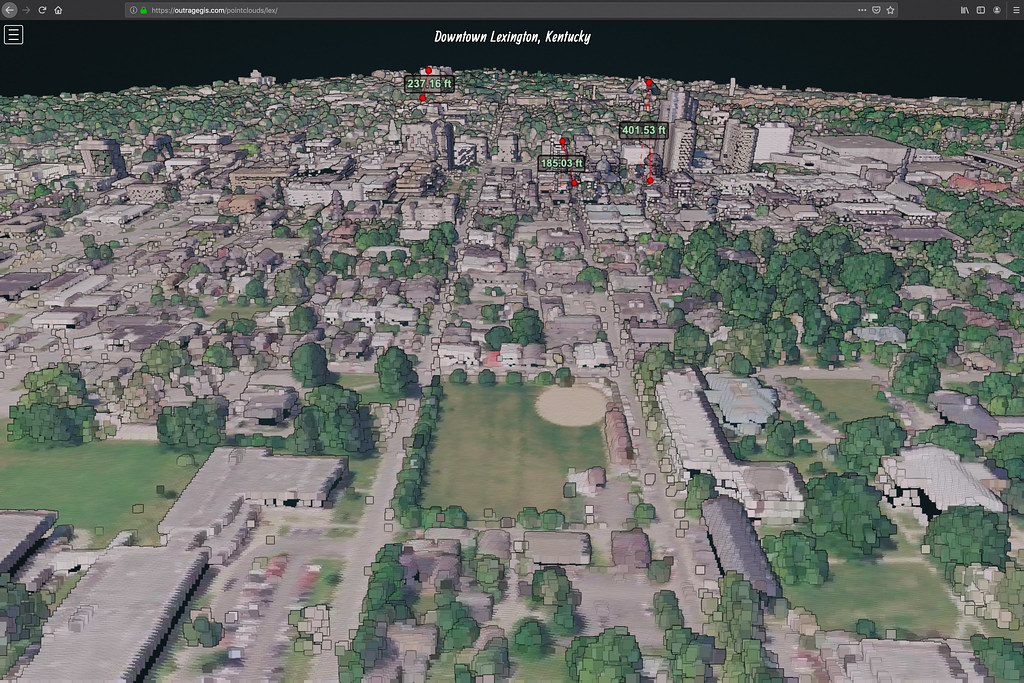
Lidar point cloud interactive visualization of downtown Lexington, Kentucky, and selected building heights. Visualization uses the Potree library, http://www.potree.org

Lidar point cloud interactive visualization of Lexington’s Legacy trail with a custom 100-ft buffer applied to the trial. outragegis.com/pointclouds/legacy

Over Christmas break, it was time to automate collecting and displaying the incredibly detailed imagery from the GOES-16 Advanced Baseline Imager. A problem that plagued previous efforts was not accessing the raw data, a netCDF formatted file for the contiguous U.S. which can be downloaded
This page offers a slippy map of grayscale and color imagery and is updated every 15 minutes. You can download GeoTIFFs of rendered layers that can be used in GIS applications.
During the Fall 2018 semester, students mapped and visited arches and waterfalls in Kentucky’s Red River Gorge Geological Area. They adopted an arch or waterfall and produced maps, analyses, 3D visualizations, and a web page that explores their arch. Visit the site.

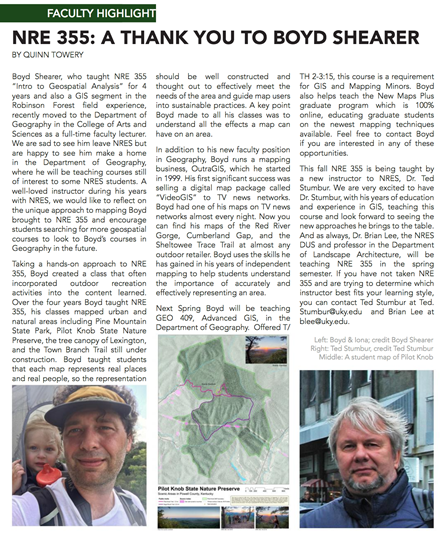
Thanks to students and crew in the University of Kentucky’s Natural Resources and Environmental Science (NRES) for this article in their Fall 2018 Newsletter.
![]() I am happy and proud to announce that I have accepted a faculty appointment as Lecturer in the University of Kentucky Department of Geography. Since 2008 I have been teaching in the department as an adjunct. With a potential move to the University of Wisconson Madison to teach GIS, I reflected on the possibilities of focusing on Kentucky and decided to stay in the Bluegrass.
I am happy and proud to announce that I have accepted a faculty appointment as Lecturer in the University of Kentucky Department of Geography. Since 2008 I have been teaching in the department as an adjunct. With a potential move to the University of Wisconson Madison to teach GIS, I reflected on the possibilities of focusing on Kentucky and decided to stay in the Bluegrass. ![]() My current teaching assignment spans open source and ArcGIS mapping platforms in both the traditional classroom and through online courses in New Maps Plus. Learn more about the opportunities and successes in mapping at the University of Kentucky and consider getting a Masters in Mapping or a graduate certificate in open source mapping.
My current teaching assignment spans open source and ArcGIS mapping platforms in both the traditional classroom and through online courses in New Maps Plus. Learn more about the opportunities and successes in mapping at the University of Kentucky and consider getting a Masters in Mapping or a graduate certificate in open source mapping.
How will this impact outrageGIS mapping? Not much. The topographic map shop will continue as normal and I will still explore and make unique maps and data for Kentucky and surrounding areas. The main change will be a deprioritizing client work in favor of university projects. For example, this year is the 75th Anniversary of the Department of Geography and is a priority project. outrageGIS mapping will also support the department’s Pauer Center for Cartography, so if you need a custom map we can make through the Center.
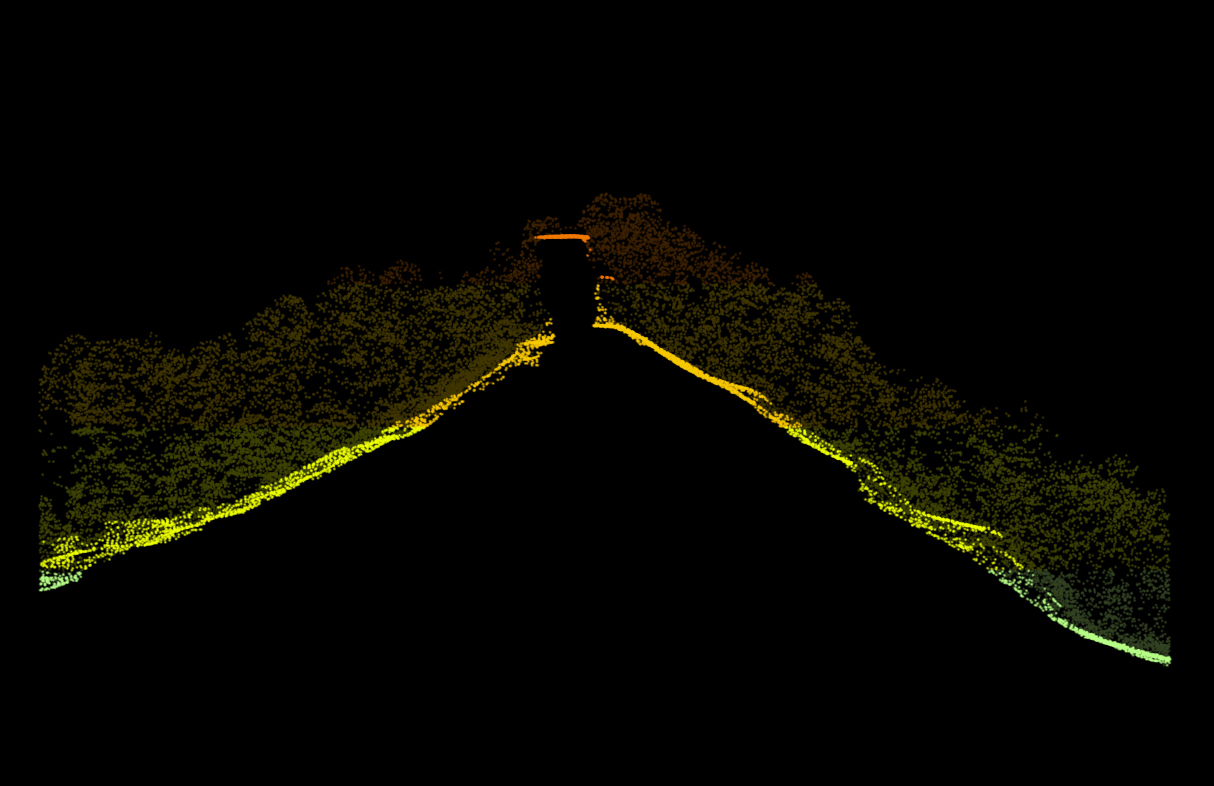
Natural Bridge profile from point cloud
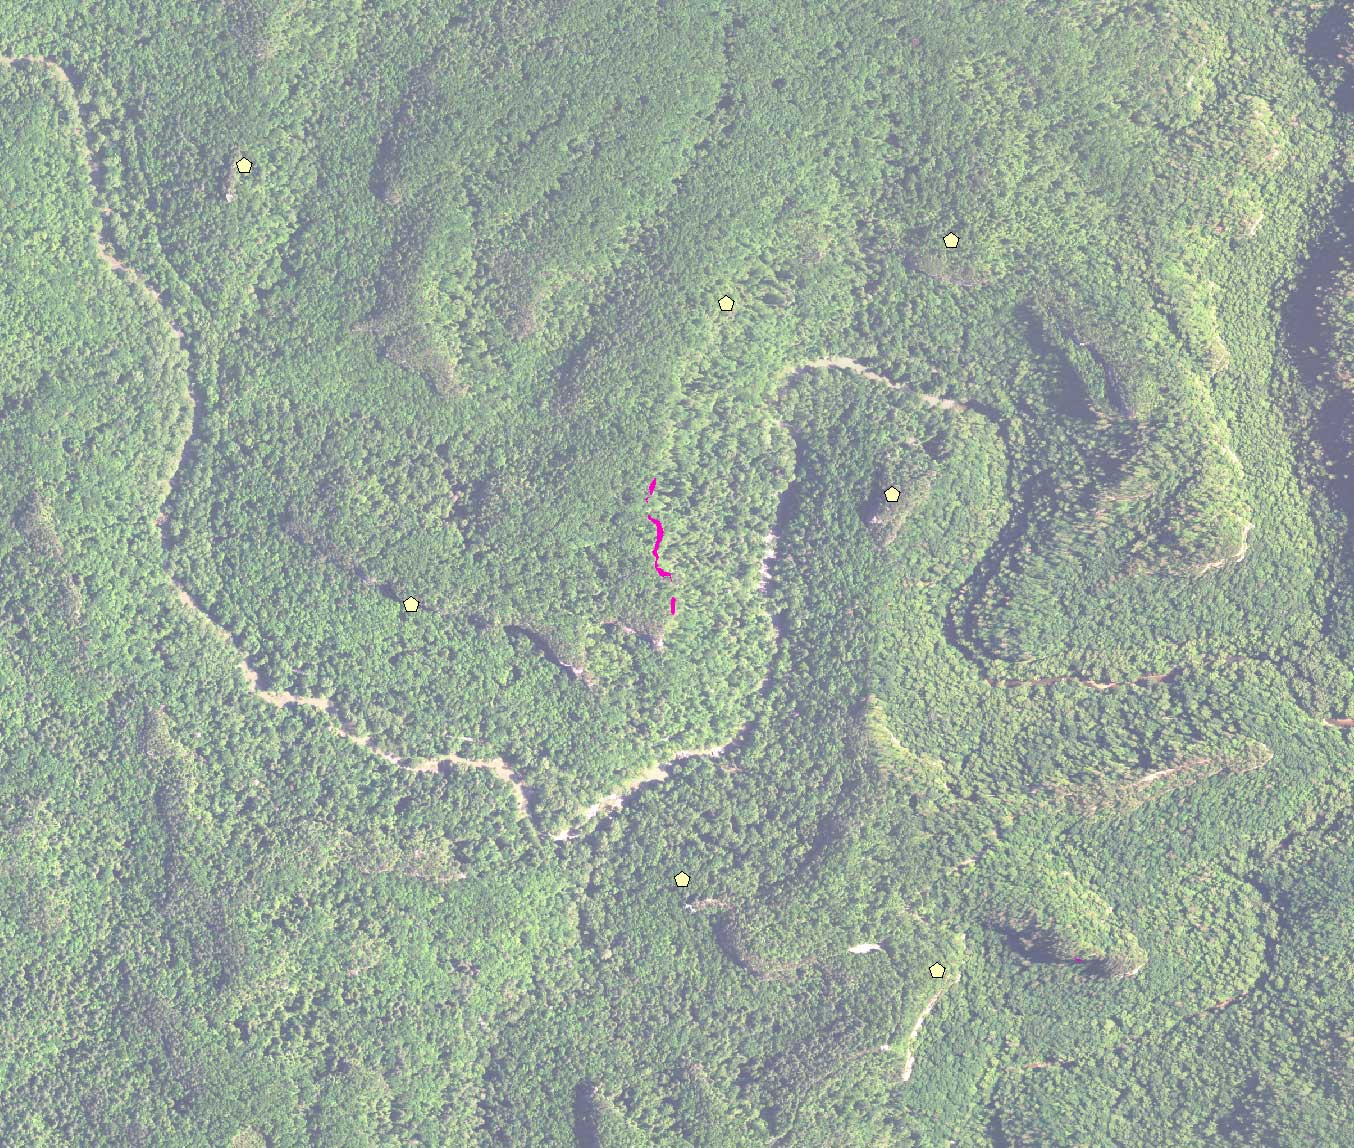
This summer we are planning an update to our popular Red River Gorge trail map. Since the release of the Lidar point cloud data for Daniel Boone National Forest, we have been excited to start the project. With a pixel resolution of 5-foot, this is the most detailed elevation layer we have for the Red River Gorge. Let’s take a look at some samples. An elevation profile of the well-known landmark, Natural Bridge arch, shows canopy slightly dimmed and you can clearly see the arch.
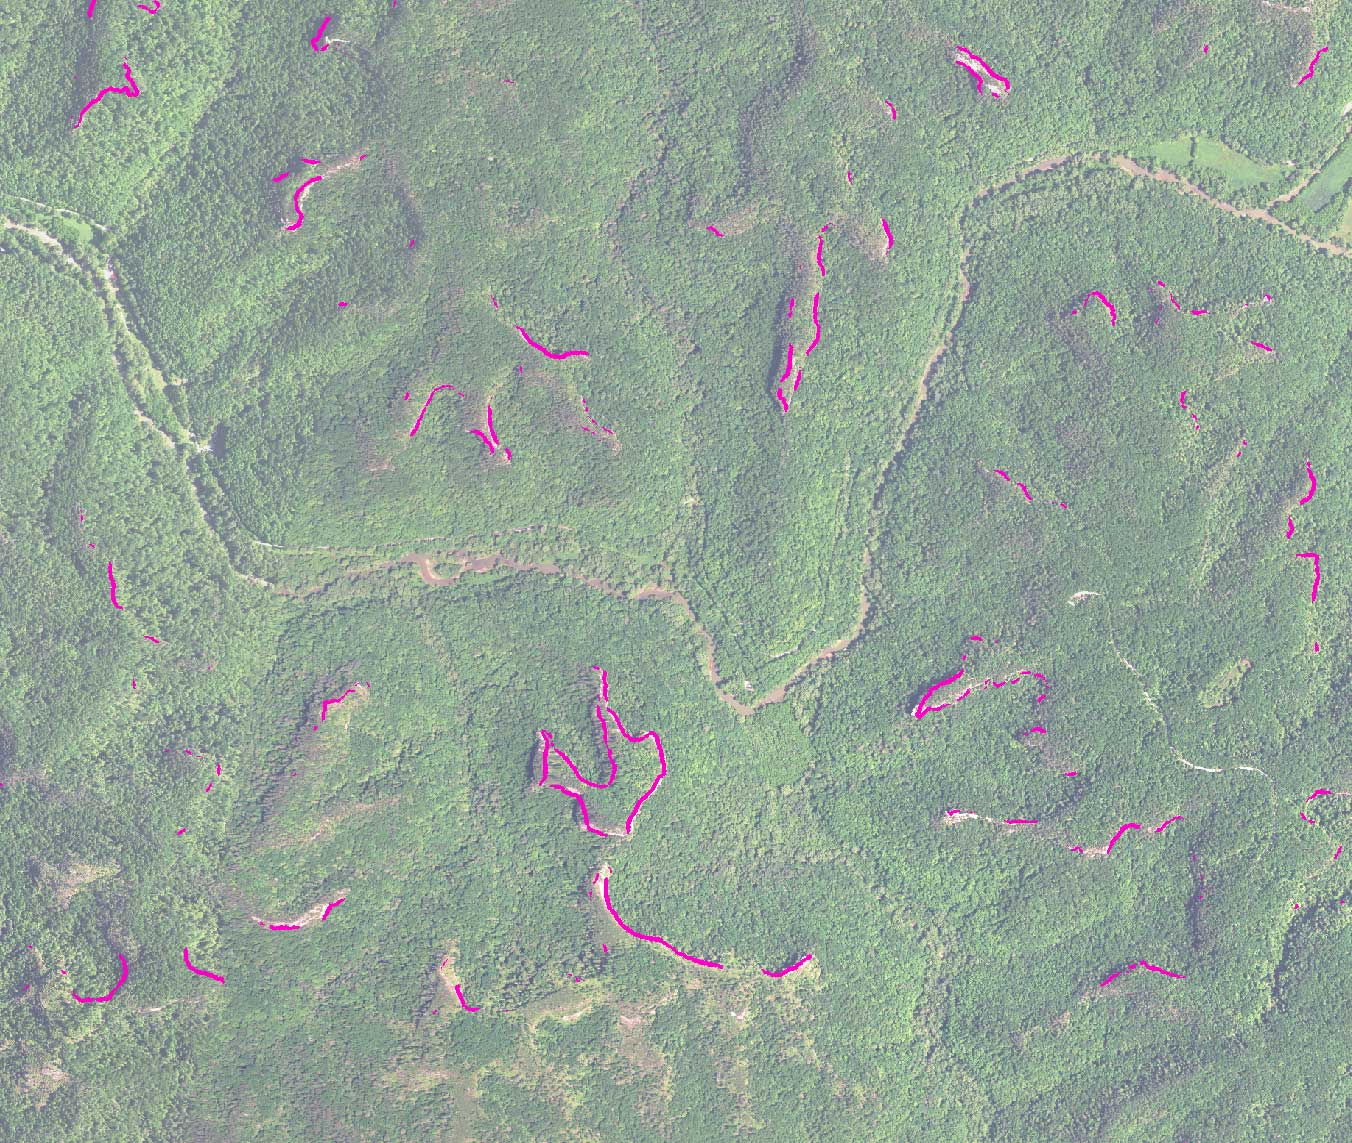
Cliffs over 100 feet in Chimney Top area
Many other interesting analyses are planned; for example, where are the high cliffs and overlooks? In the right image, we show the cliffs over 100-feet in height. We can clearly see the high cliffs of Pinch ‘Em Tight, Chimney Top, and the other high cliffs the line the Red River.
Cliffs over 220 feet in Small Wall area along Red River
Of course, the inclination is to find the highest cliff in the Red River Geological Area. With a preliminary analysis, we have found the Small Wall climbing area has one of the highest cliffs at 220-feet.
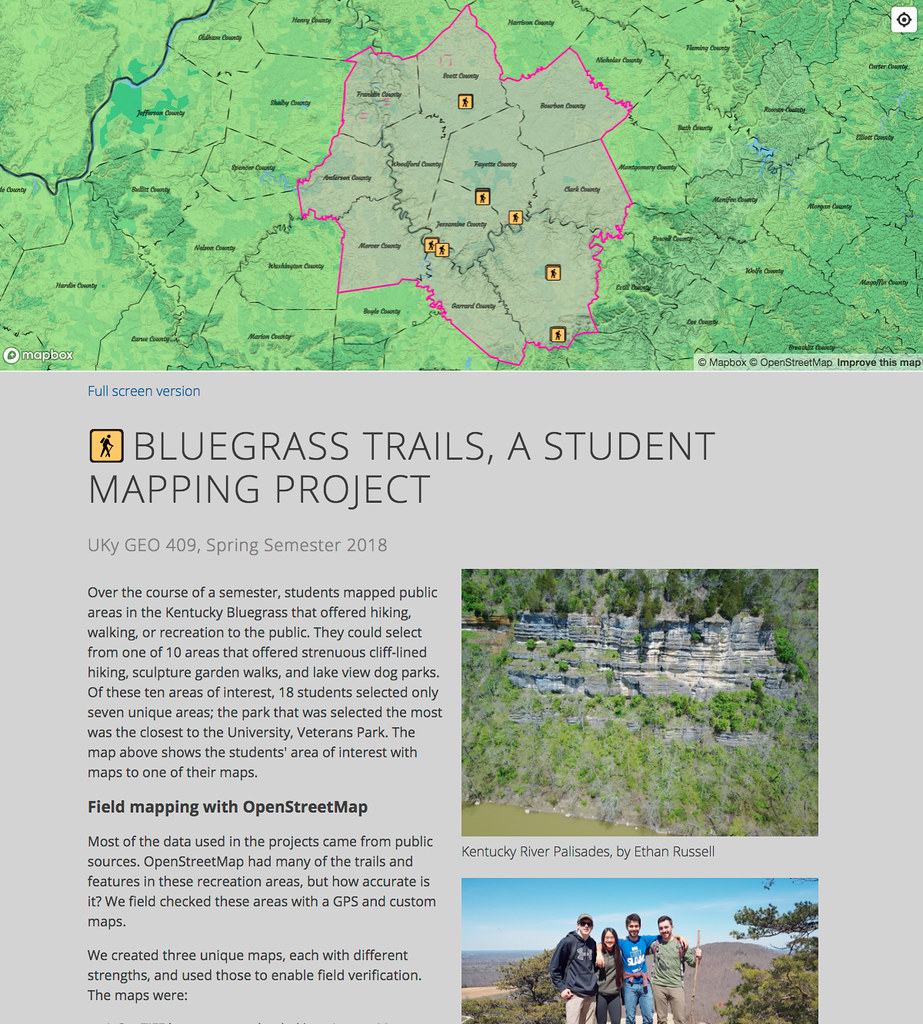
Over the course of the spring 2018 semester, UKy Geography students mapped public areas in the Kentucky Bluegrass that offered hiking, walking, or recreation to the public. They could select from one of 10 areas that offered strenuous cliff-lined hiking, sculpture garden walks, or lake-view dog parks.
Web page for student maps
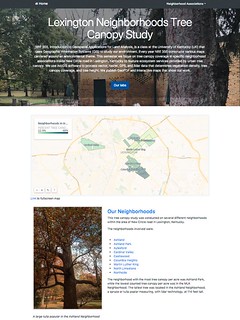
NRE 355, Introduction to Geospatial Applications for Land Analysis, is a class at the University of Kentucky (UK) that uses Geographic Information Systems (GIS) to study our environment. Every year NRE 355 constructs various maps centered around an environmental theme. Past themes have included Pilot Knob State Nature Preserve and Pine Mountain, both in Kentucky.
This semester our class focused on tree canopy coverage in specific neighborhood associations inside New Circle Road in Lexington, Kentucky to feature ecosystem services provided by urban tree canopy. We use ArcGIS software to process vector, raster, GPS, and lidar data that determines vegetation density, tree canopy coverage, and tree height. We publish GeoPDF and interactive maps that show our work.
This tree canopy study was conducted in several different neighborhoods within the area of New Circle Road in Lexington, Kentucky.
The neighborhoods involved were:
The neighborhood with the most tree canopy per acre was Ashland Park, while the lowest counted tree canopy per acre was in the MLK Neighborhood. The tallest tree was located in the Ashland Neighborhood, a spruce or tulip poplar measuring, with lidar technology, at 114 feet tall.
Visit the website: https://rvirto01.github.io/NRE355_Tree_canopy_study/
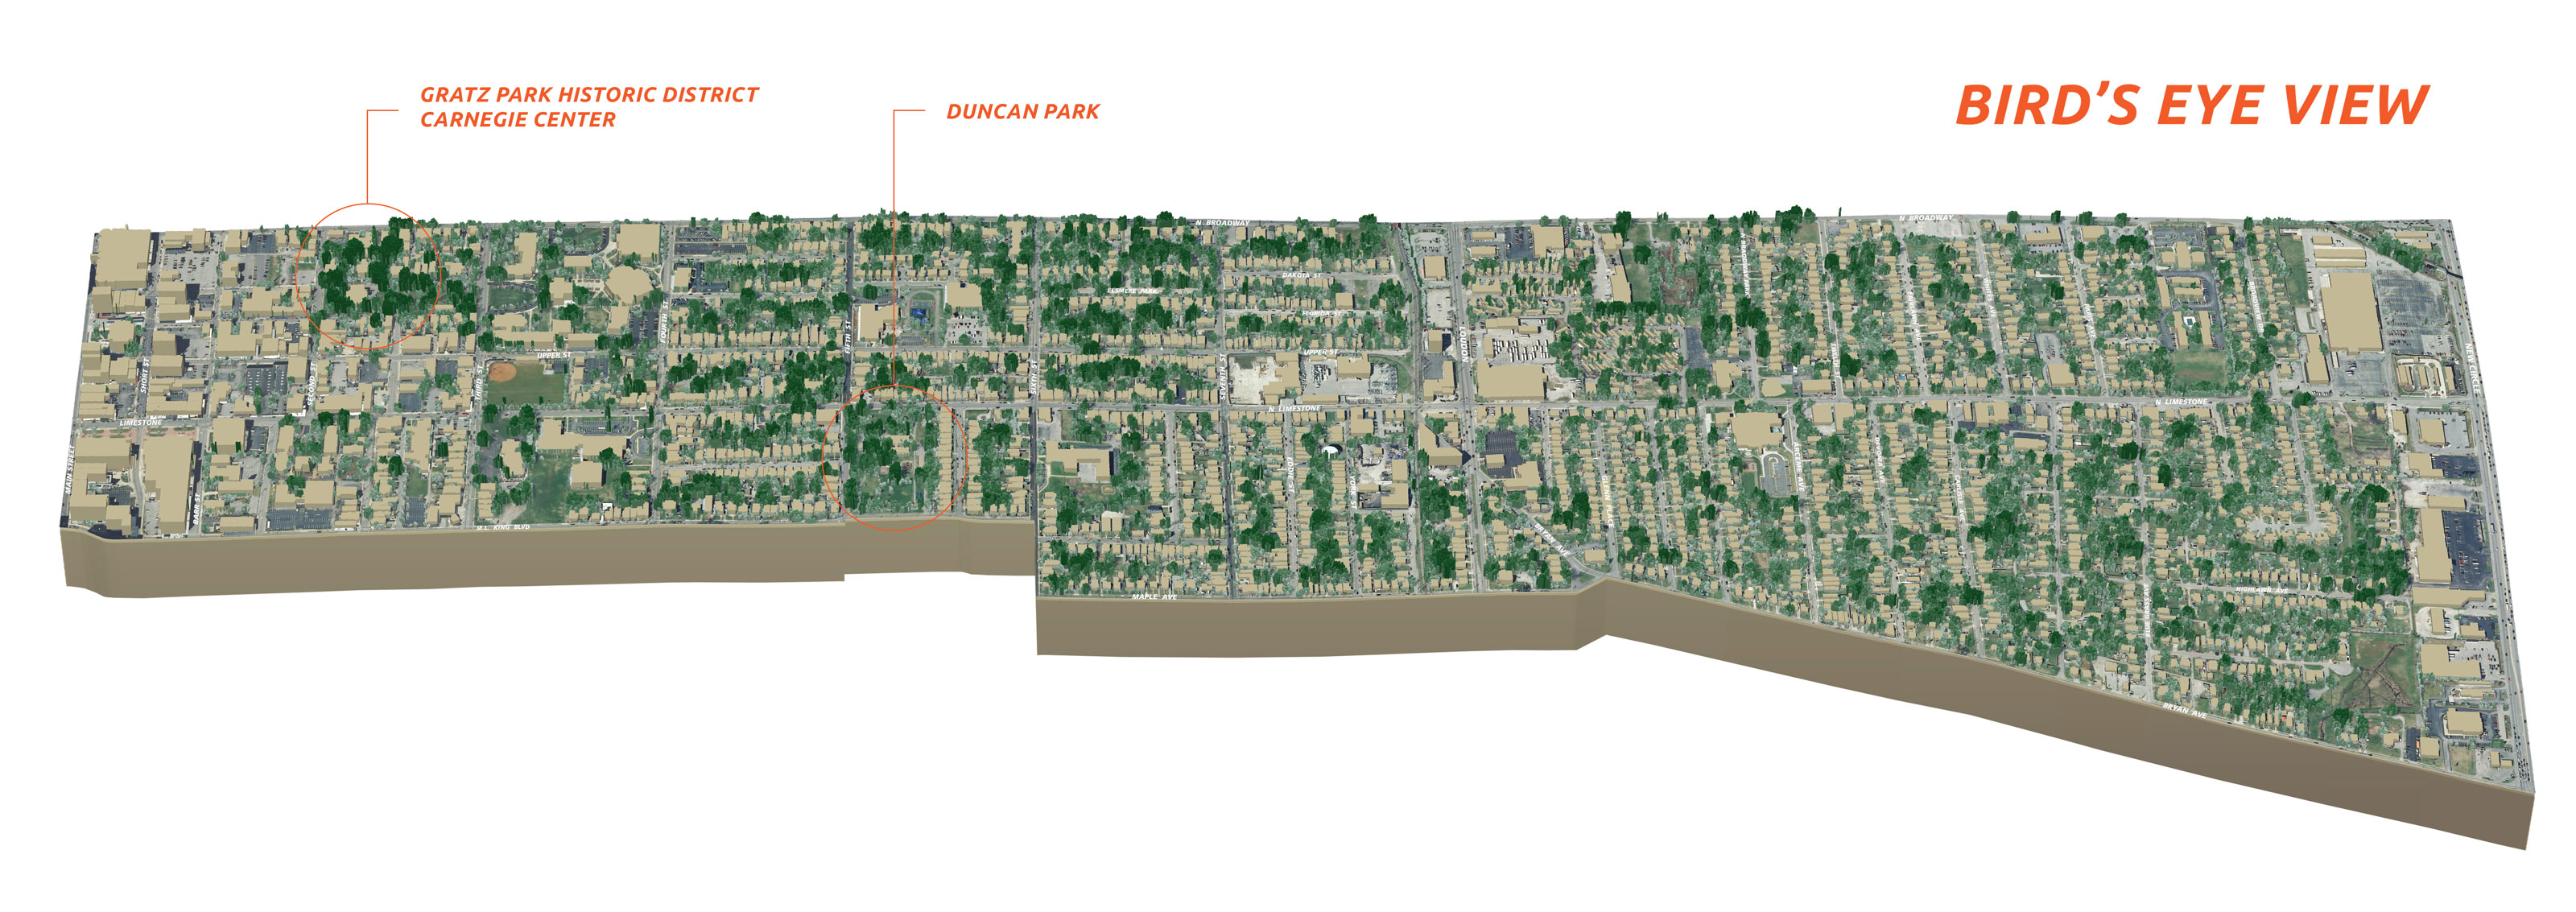
Bird’s eye view of the North Limestone Neighborhood Association showing tree heights relative to building heights
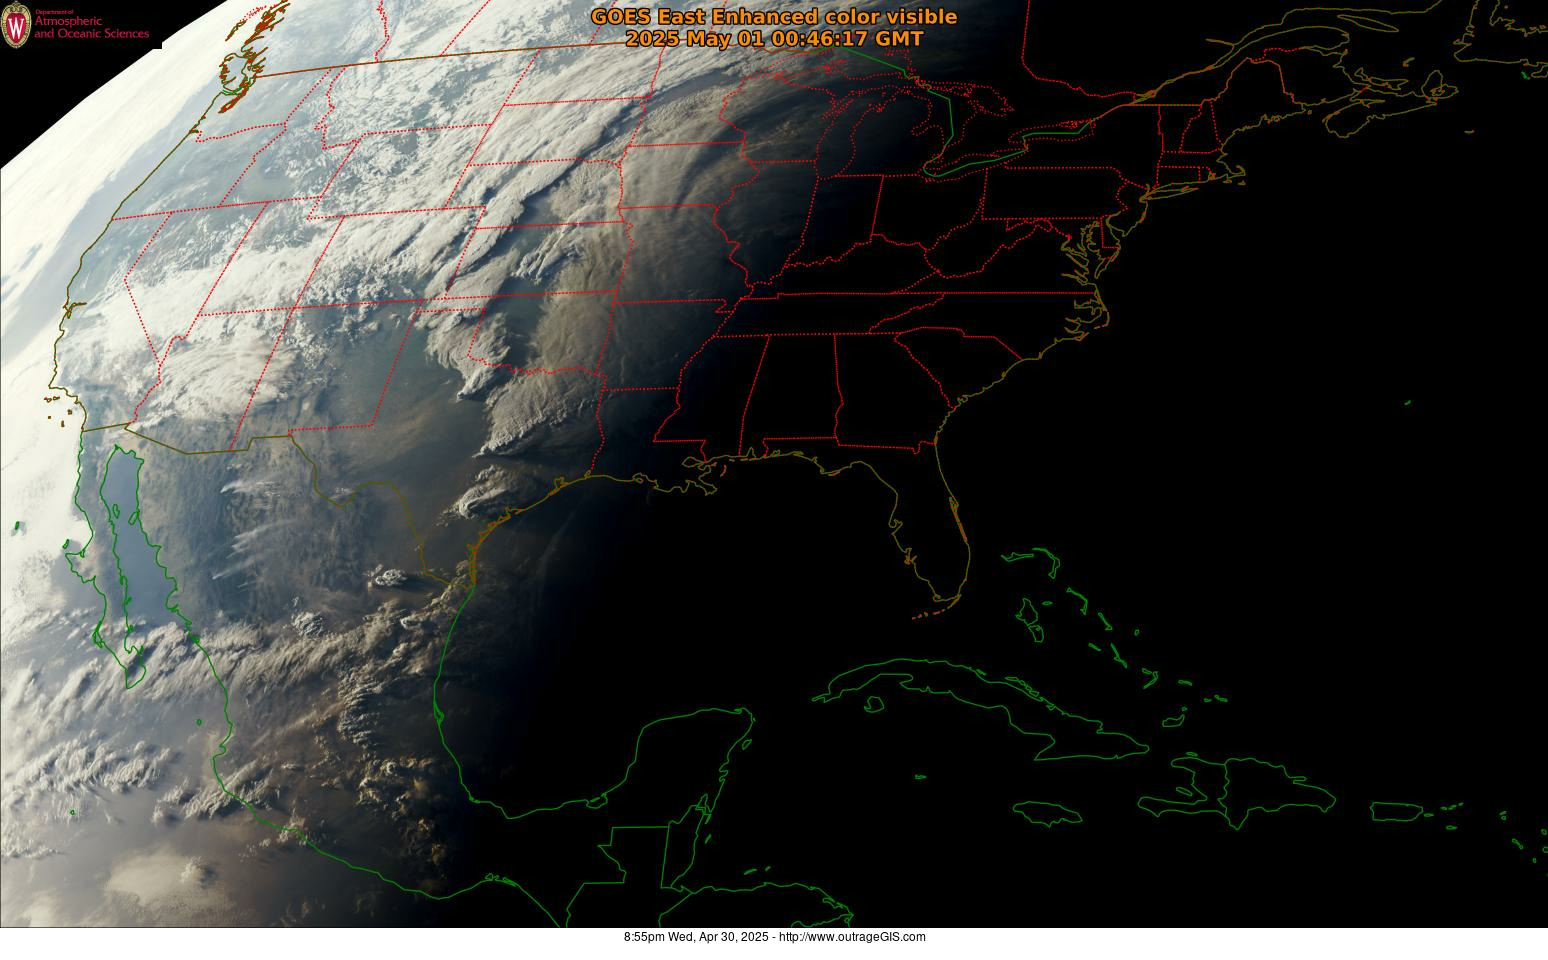
High-resolution weather imagery from GOES-16
This weather satellite captures 16 spectral bands with time resolutions as quick as every 30 seconds. The spatial resolution (the size of each pixel) is between 0.5 km and 2 km and the visible grayscale image for the continental US is 12,000 x 9,000 pixels and is collected every 5 minutes.
We wrote a series of crontab jobs to automate the processing of weather imagery to display on our website.


