Winner: Best Spatial Analysis at the 2023 Kentucky Association of Mapping Professionals annual conference.
This analysis shows the difference between two digital surface models (DSM) created from lidar point cloud data hosted by KentuckyFromAbove.gov. DSMs allow us to visualize surface features like buildings and trees. The calculation subtracts the 2010 DSM from the 2019 DSM to find the height difference. The resulting raster layer is multiplied over a shaded relief base map from the 2019 DSM.
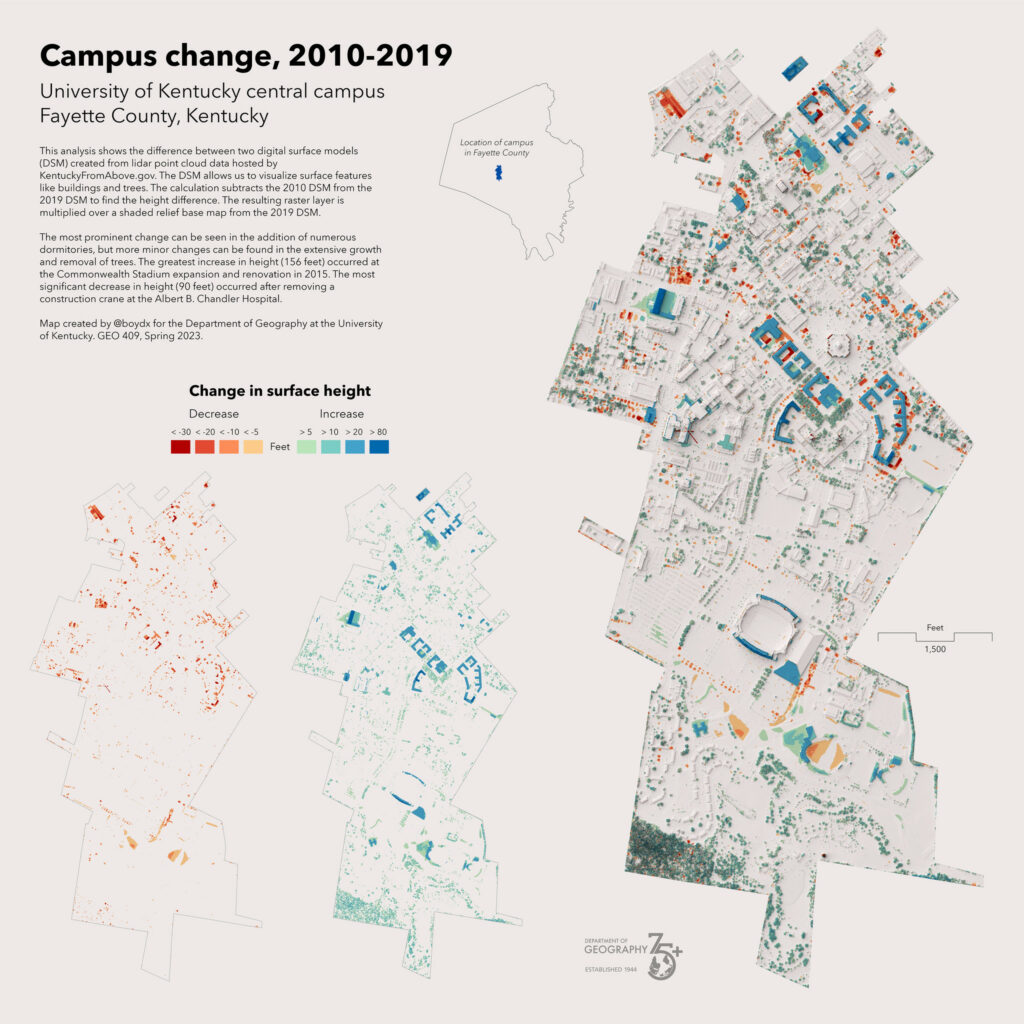
The most prominent change is the addition of numerous dormitories, but the more minor changes are the extensive growth and removal of trees. The greatest increase in height (156 feet) occurred at the Commonwealth Stadium expansion and renovation in 2015. The most significant decrease in height (90 feet) occurred after removing a construction crane at the Albert B. Chandler Hospital.
View map and other visualizations of change: https://boydx.github.io/uky-campus/
@boydx Department of Geography at the University of Kentucky. GEO 409 Spring 2023.
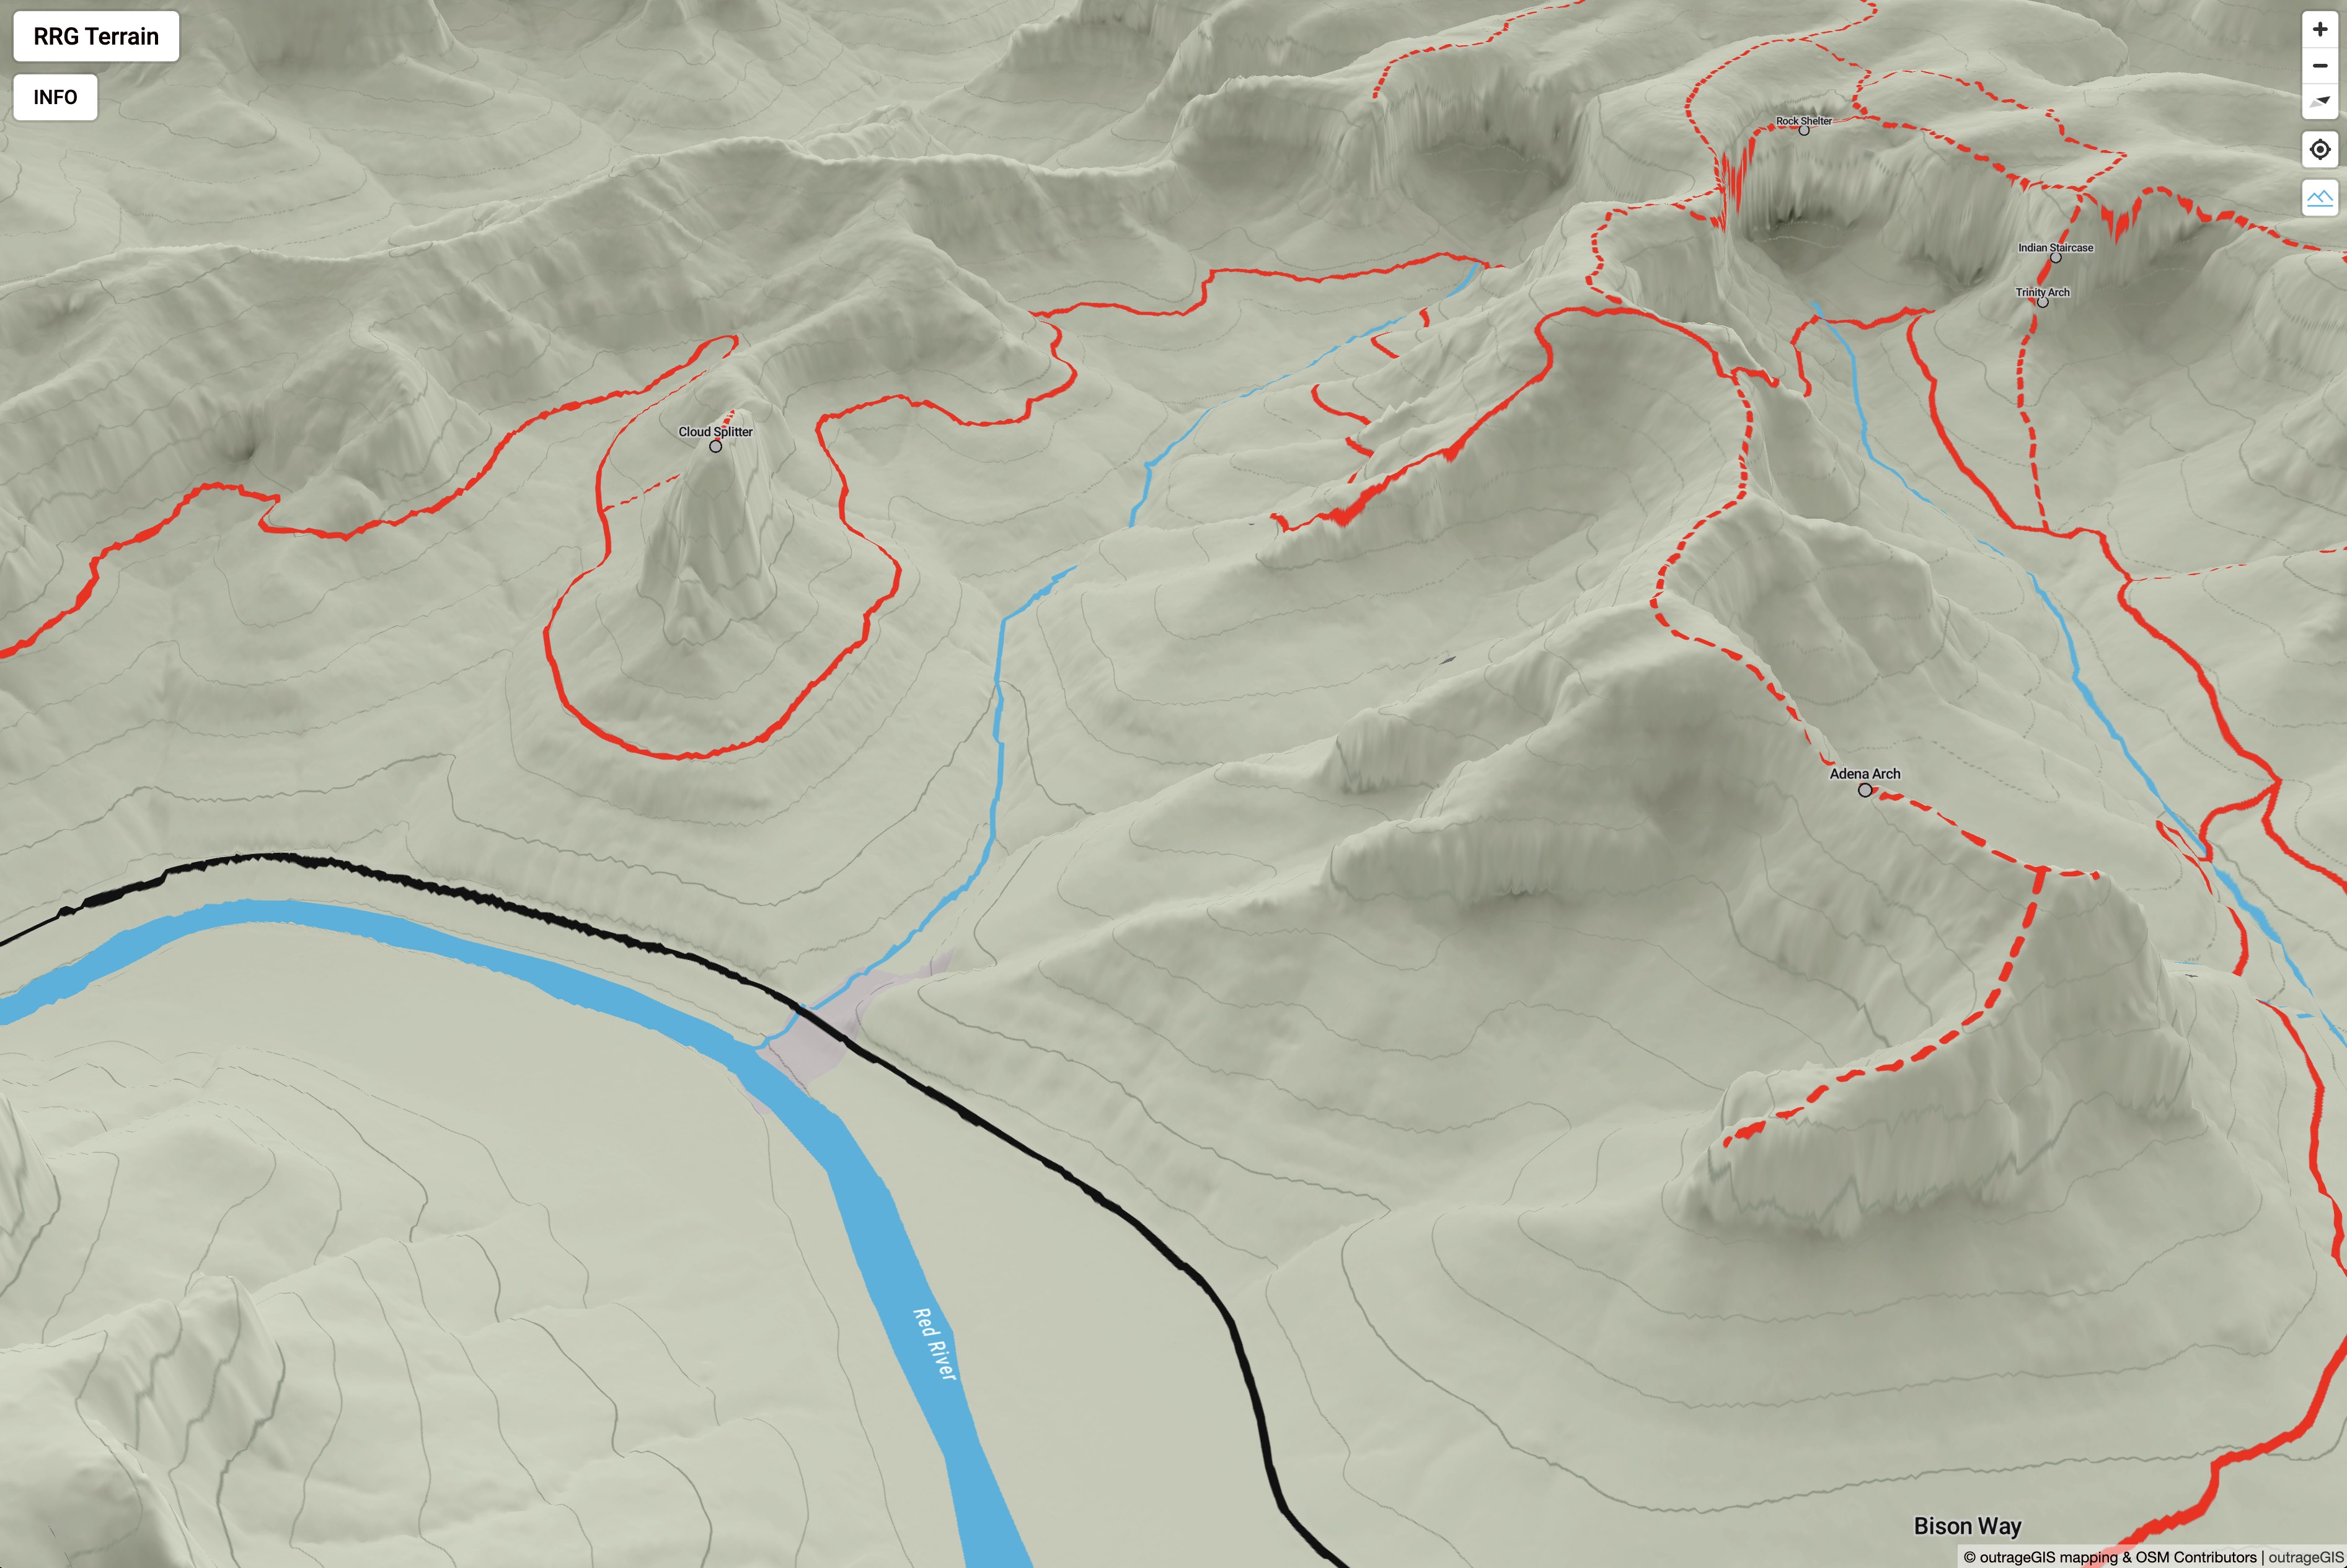
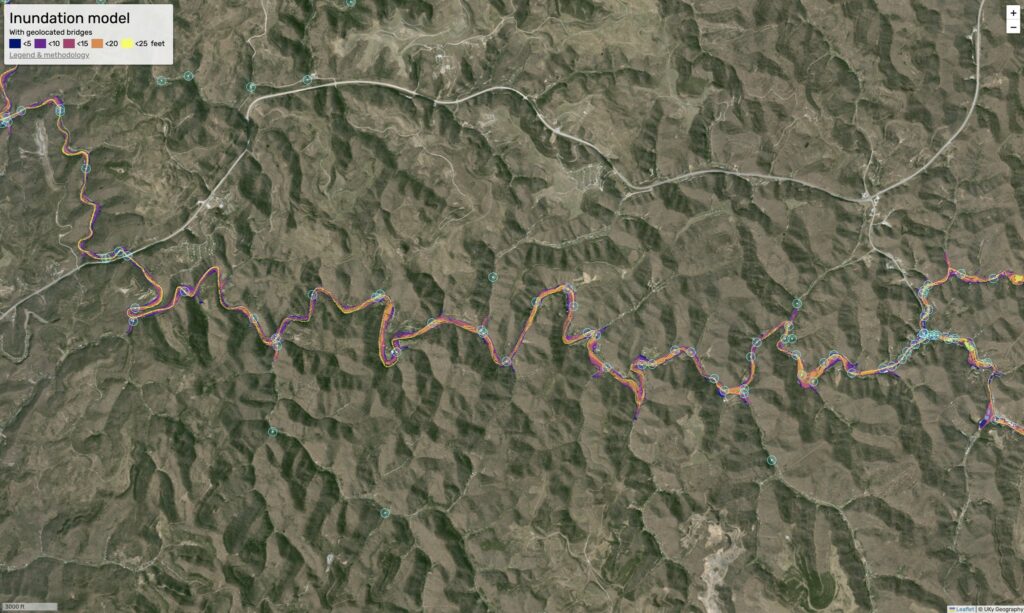
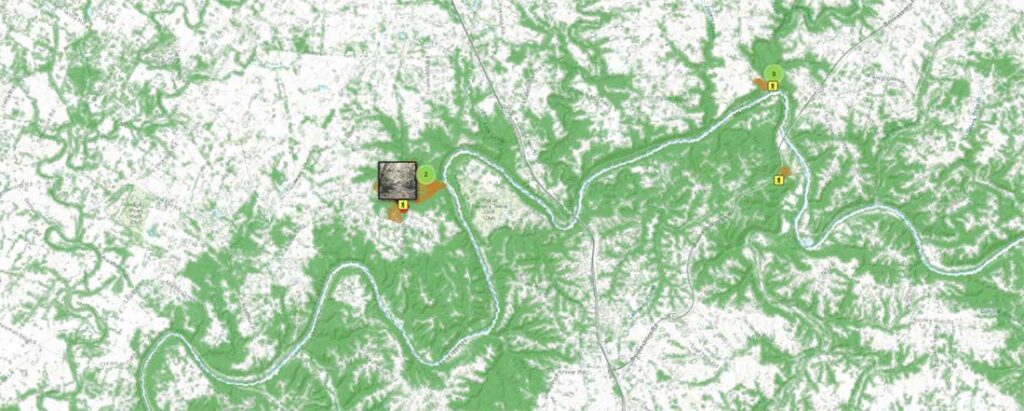
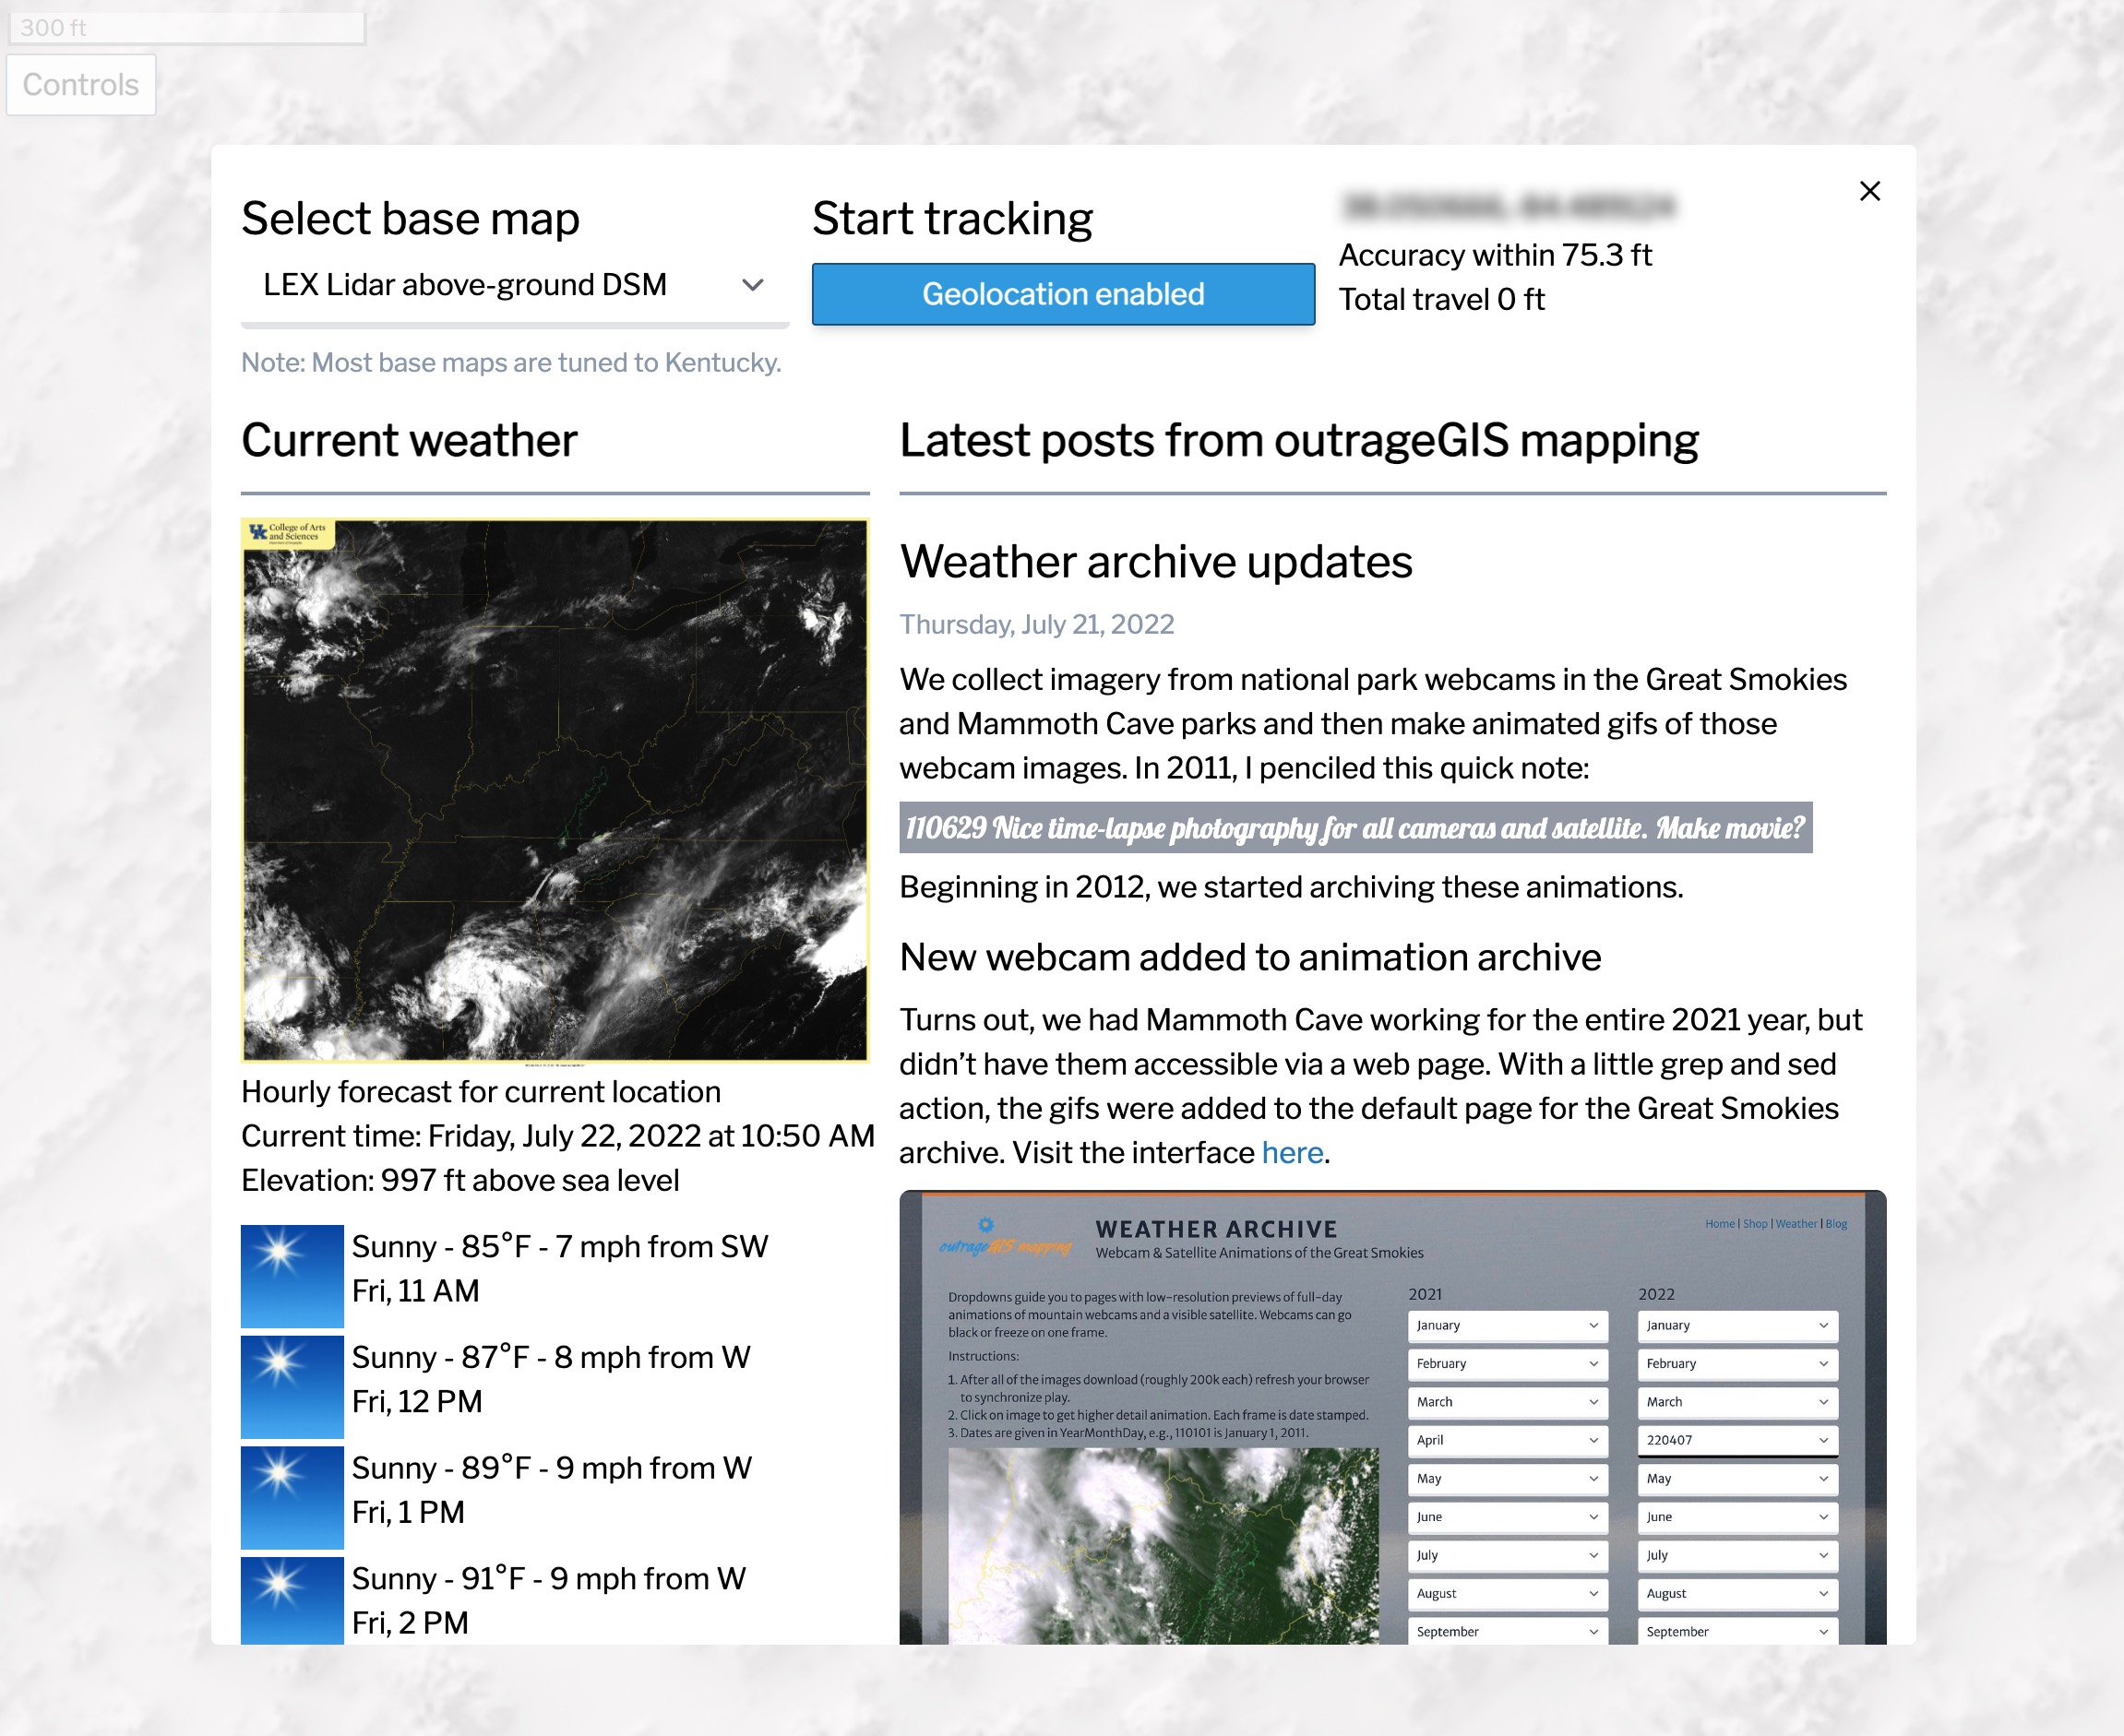
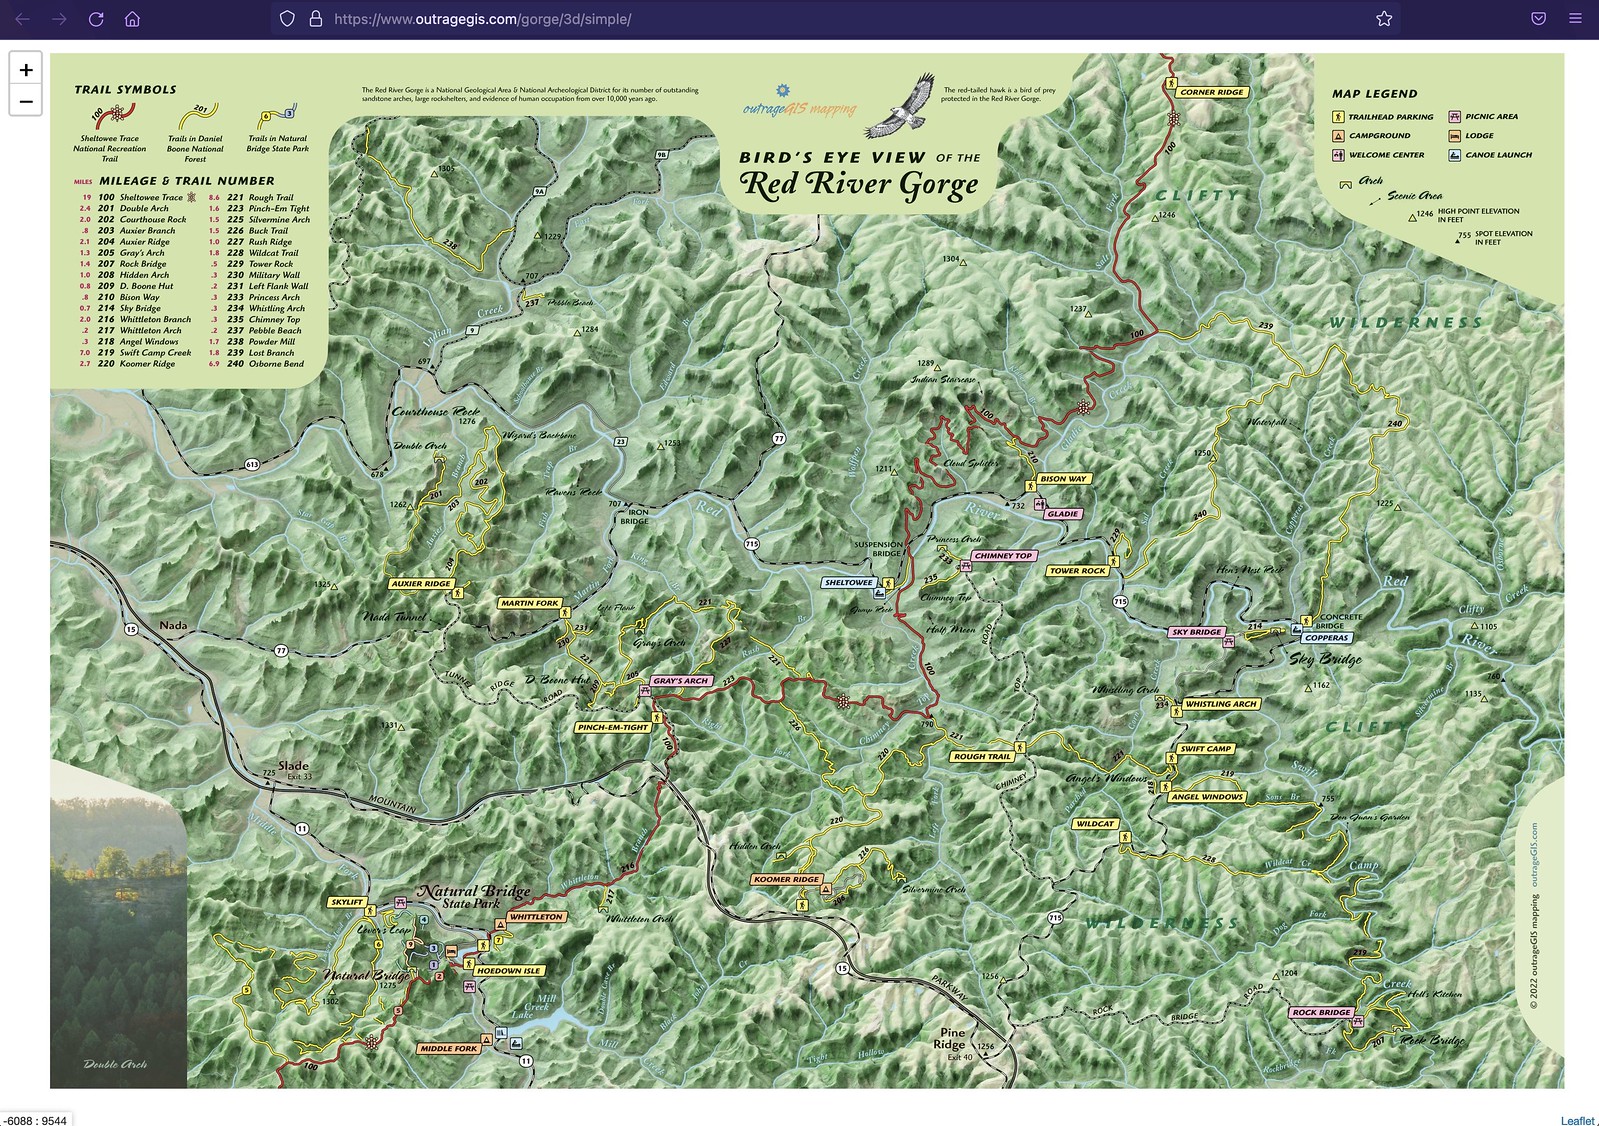
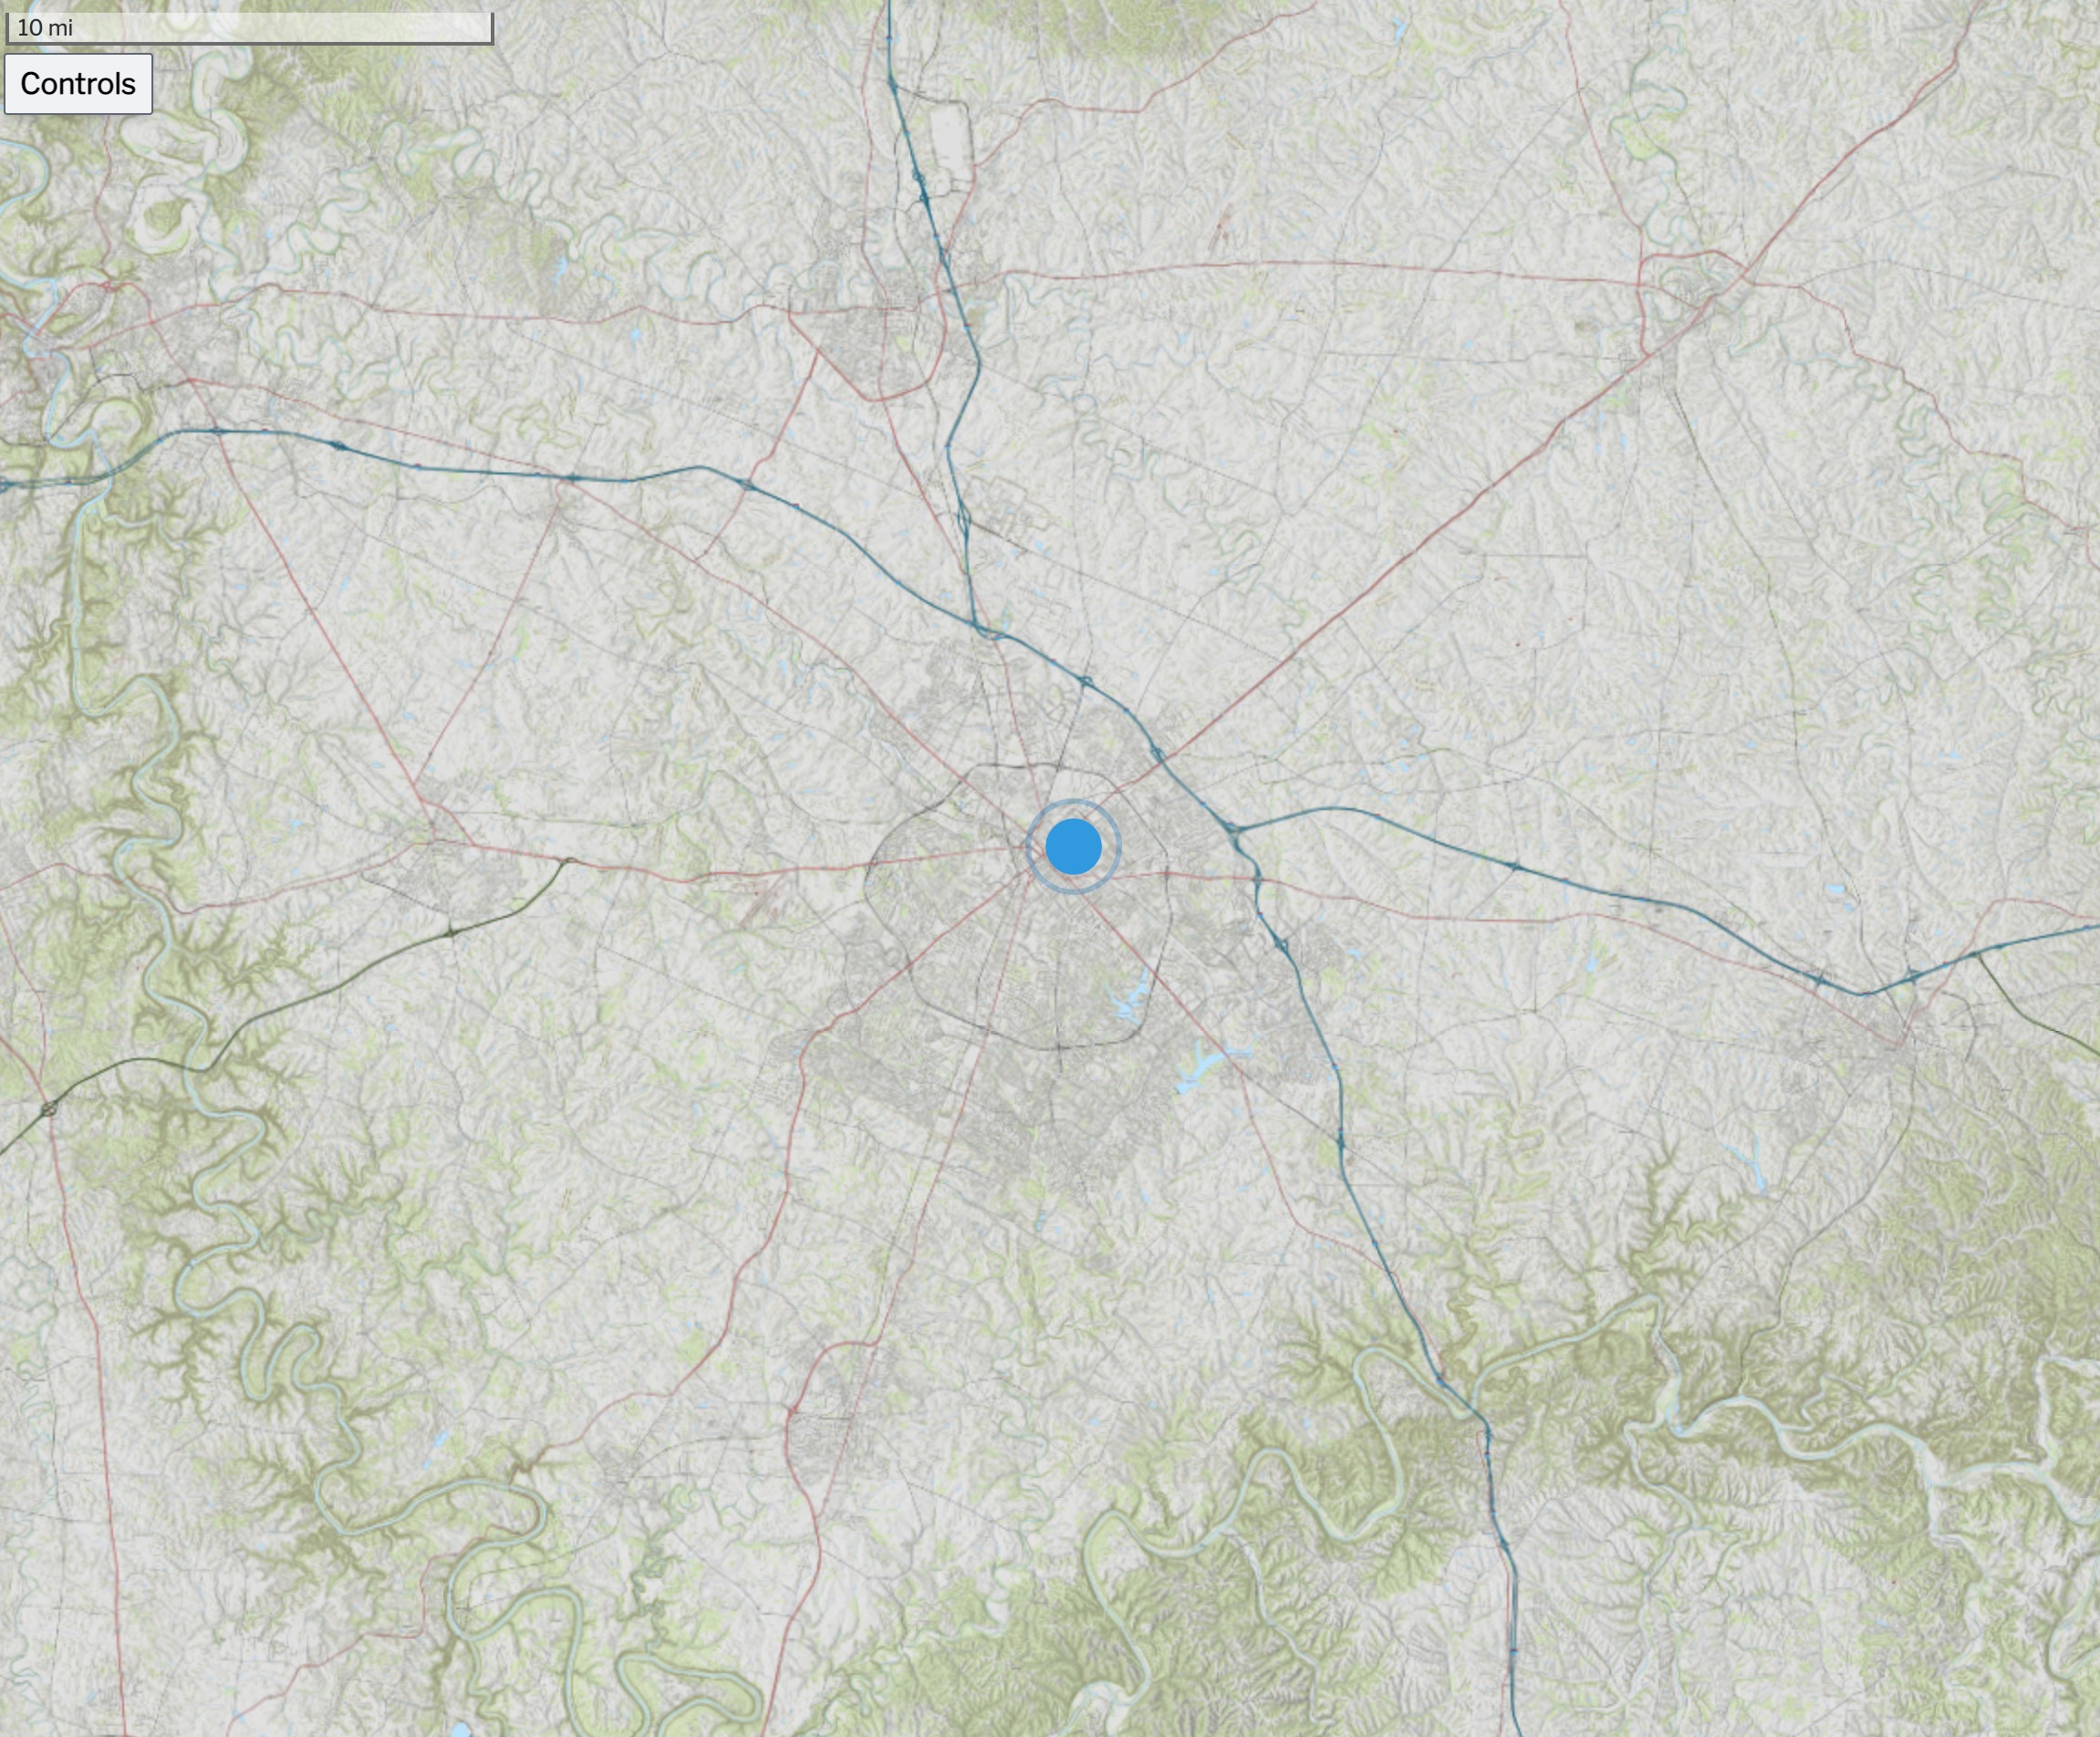 Above is an screen capture of the Kentucky Topo map for the state. Other base maps include, lidar-derived surface models and current GOES-16 imagery.
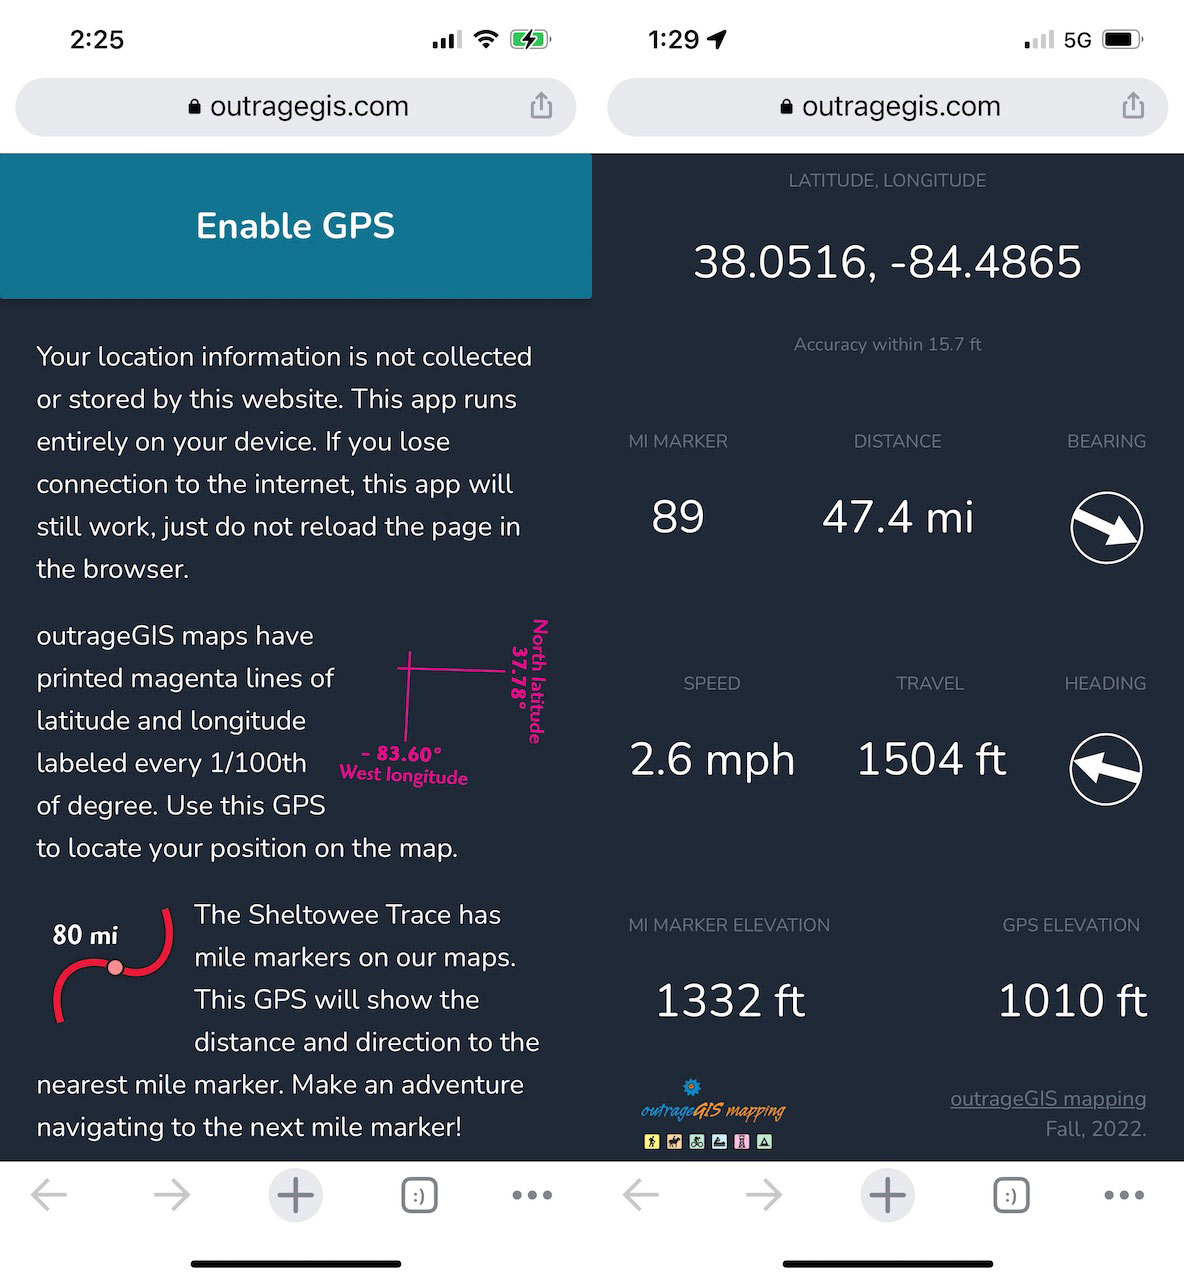
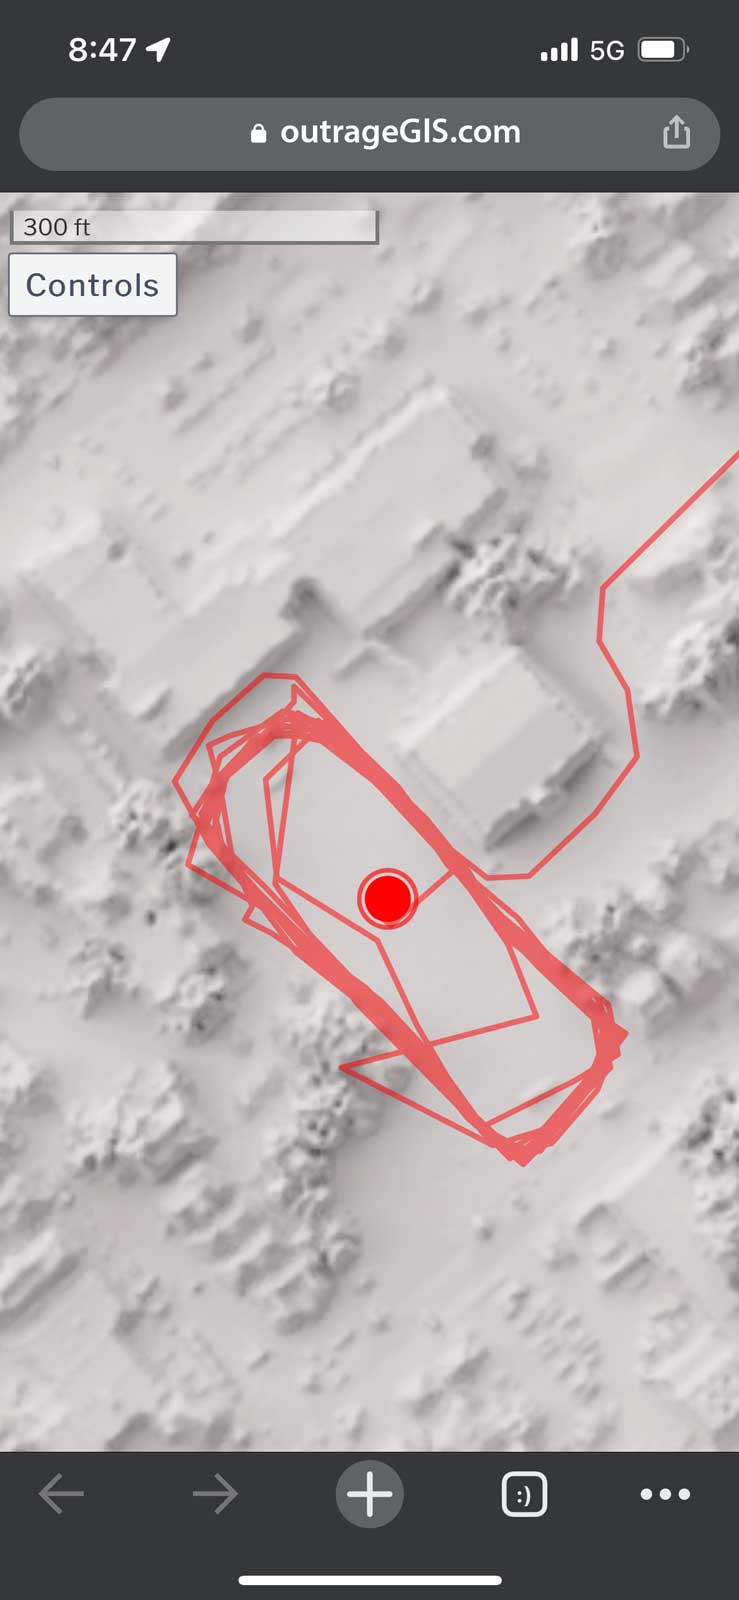 Screen capture of track mapping on a mobile device
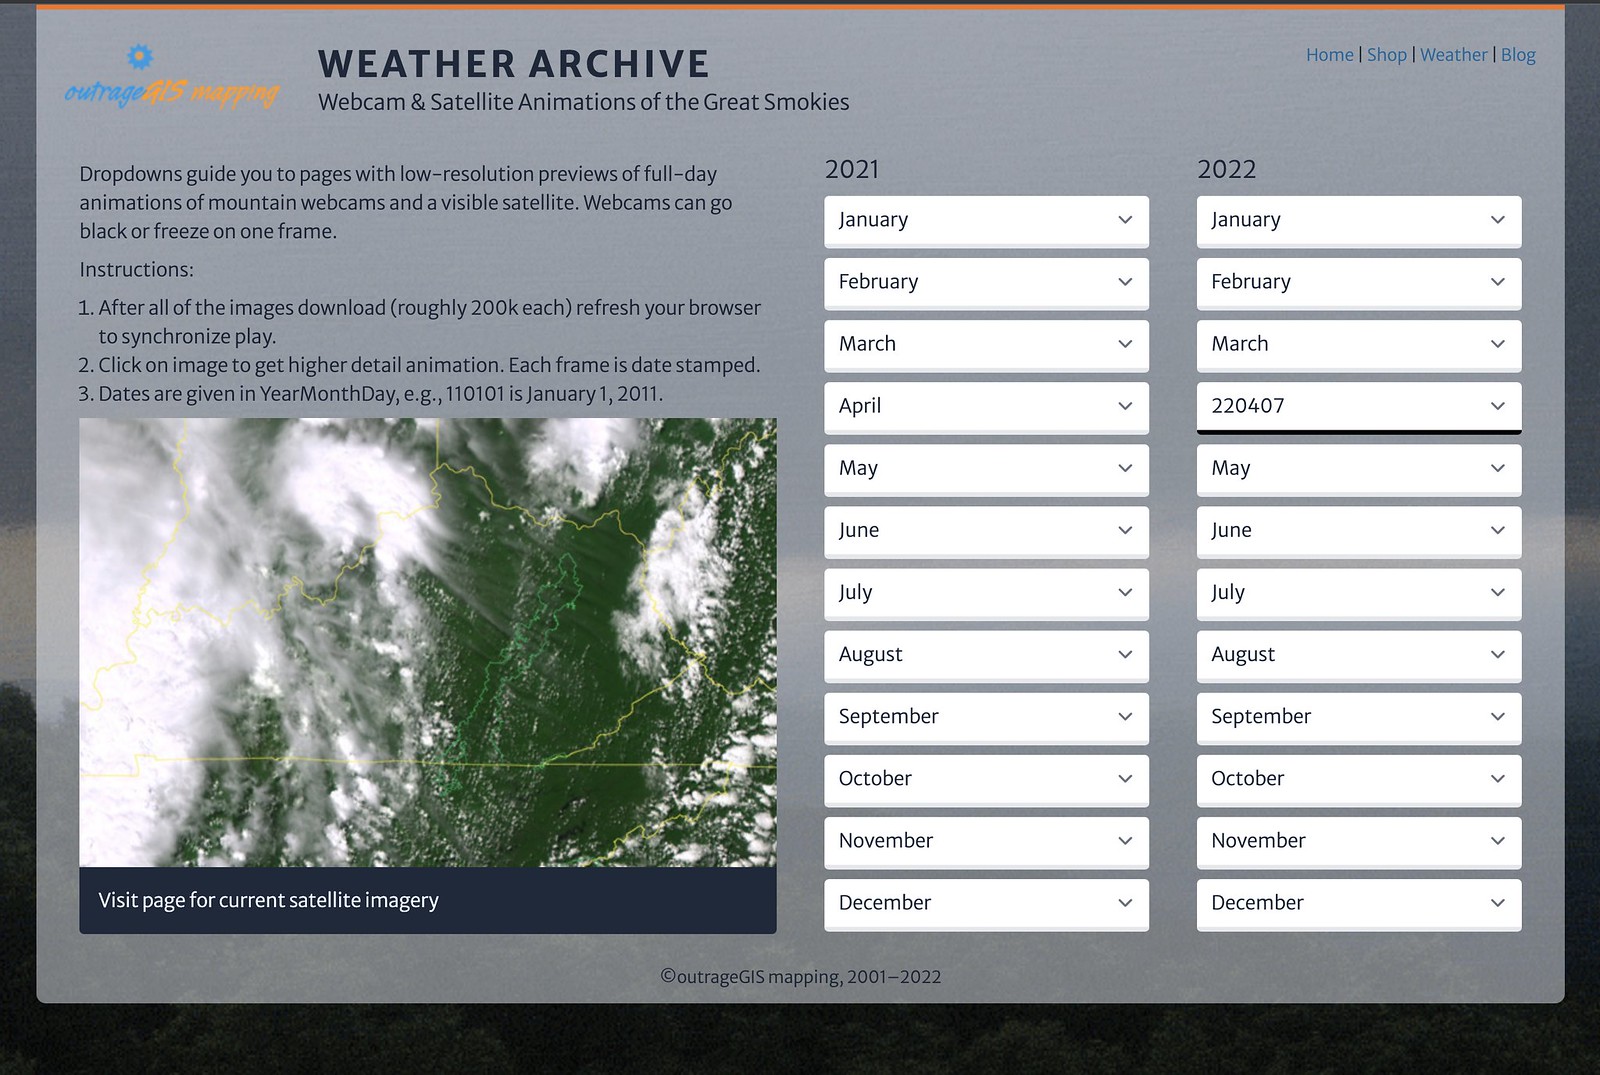


