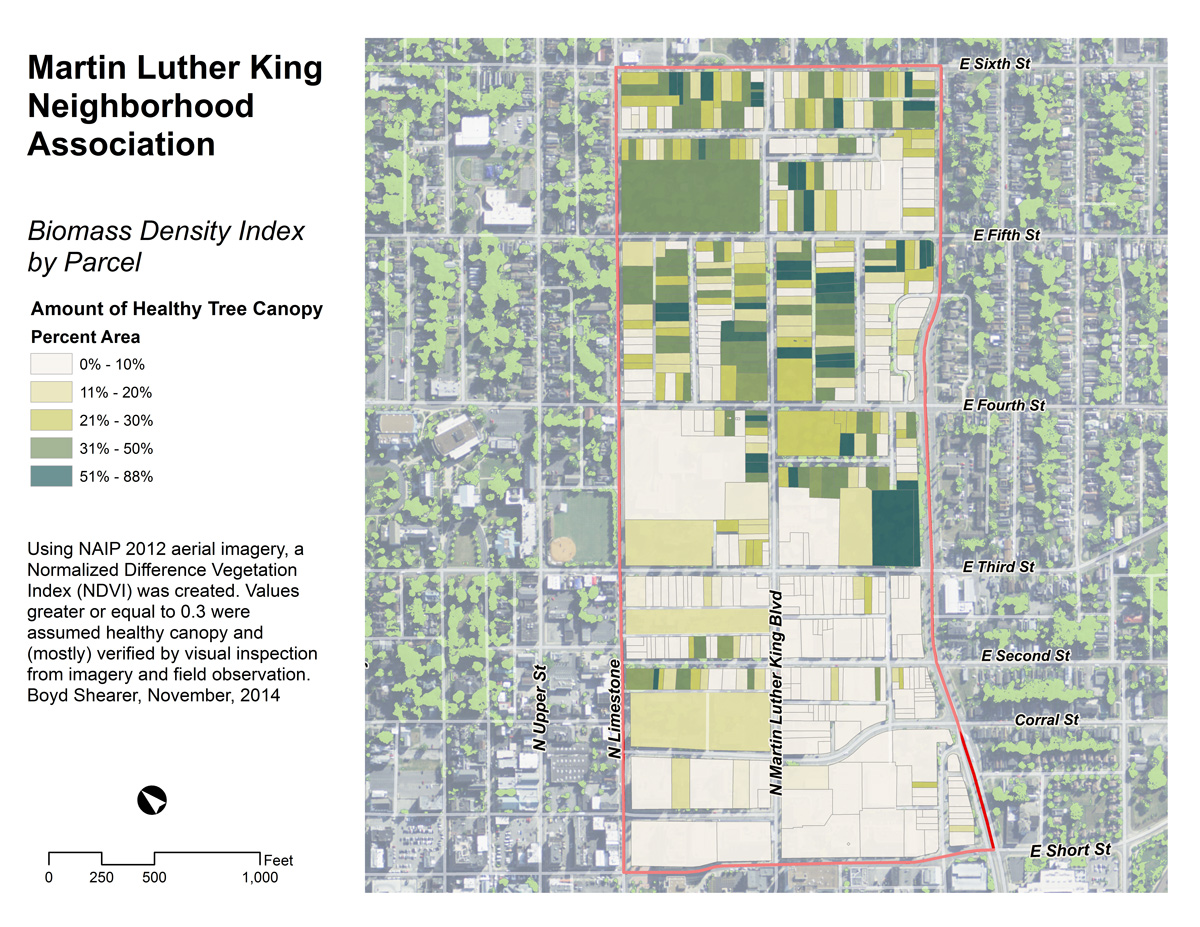
How much tree canopy covers the urban service area of Lexington, Kentucky? Inspired by the Davey Resource Group’s October 2013 study of canopy cover using 2012 NAIP imagery within Lexington’s Urban Service Area, a GIS class at the University of Kentucky created a similar, though limited, evaluation. [Read more…]
Pine Mountain Canopy Tour
What wild weekend and mapping task! Boyd led an undergraduate GIS class at the University of Kentucky and endeavored to map and analyze environmental tourism assets on Pine Mountain. During discussions with Pine Mountain State Resort Park, we discovered a canopy zipline tour, one of the first in the state, was being installed in the park. [Read more…]
Robinson Forest Camp Trail Map Exercise
As part of UK Natural Resources and Environmental Sciences 2015 Summer Camp, I taught a one-day GPS and GIS exercise to map the interpretive trails around base camp. With seven undergraduates and their mobile devices and one Trimble ProXRS, we split into three teams. One team focused on the trail network and GPS mapped trail alignment and intersections. A second team mapped interpretive sites on the left-side of trials, while a third-team mapped right-side features.
In the second-half of the day, we worked in the classroom and on laptops to make a map in ArcGIS. Some students had GIS software experience and helped their fellow classmates to make a map as a geospatial PDF and use on their mobile devices. A GeoPDF is a mobile map that doesn’t require a cellular data connection to function.
Topography and Hemlock Habitat
Sheltered coves and north-facing cliffs are hemlock habitats in Eastern Kentucky. This map shows range of elevation change within a 164-foot square area. Red areas indicate the highest relief, which are mountain slopes in the coal fields, and cliffs along the Pottsville Escarpment and Pine and Cumberland Mountains fault. Since most cliff is sandstone, areas indicated as cliffs would presumably have sandy soils, which is a condition for other evergreen species habitats, e.g., mountain laurel and rhododendron.
This is first-run test. Further analysis would include adding aspect, evergreen canopy cover, and soils to better refine predicting hemlock habitat.
Town Branch Trail and Density of Healthy Canopy
Town Branch Trail is a developing shared-use trail connecting downtown Lexington with the city’s outer countryside. The exercise shows the completed and funded phases for the trail, and assesses the extent and health of trees along the trail.
Using National Agriculture Imagery Program (NAIP)  2012 imagery an NDVI (Normalized Difference Vegetation Index) was created and then shown as a ratio per parcel area. After viewing the initial results, a student said, “This is a realtor’s map!” and then quickly visited the PVA website to compare property values to its ‘green index.’
Mapping Kentucky’s Wildland Fires with Satellite Imagery
Kentucky has damaging wildland fires, while also using prescribed burns to manage habitat. An unfortunate statistic tells us that most wildland fires in Kentucky are from arson.
This student lab uses MODIS Active Fire Detection products and Landsat 8 near-infrared bands to locate and analyze the largest fires between April 2012 and October 2014. IÂ hope to get point locations of smaller fires from Kentucky Division of Forestry to compare with satellite-based observations.
Students Like Field Trips
What can students do with a smartphone, ArcMap, and a linux server? More than just have fun outside!
15 student teams from two GIS courses at the University of Kentucky mapped, measured, and photographed 603 trees in the Arboretum Woods. Each team (which adopted colorful team names) was given (approximately) an acre zone. They used common mobile devices and low-cost apps to GPS and photograph the most significant trees.Â
Each team made a poster and presented them during a 2014 International GIS Day event in the Thomas Poe Cooper building on UK’s campus. It was widely attended and praised for the strength of student teams’ achievement.Â
Since students photographed each tree, we made an interactive map that shows these photos and can be used for geolocation while in the woods. Using Leaflet, GeoJSON, and a Linux server, student SWEB accounts host data that feeds this interactive map:Â Look at trees now!
A Neighborhood’s ‘Green’ Index
A map showing ratio of property parcels covered in healthy canopy in the Martin Luther King Neighborhood Association in Lexington, Kentucky.
Using National Agriculture Imagery Program (NAIP) 2012 aerial imagery, a Normalized Difference Vegetation Index (NDVI) was created. Values greater or equal to 0.3 were assumed healthy canopy and (mostly) verified by visual inspection from imagery and summer field observations.
Sheltowee Trace online map
We’ve started an online map for the Sheltowee Trace, because it keeps getting longer with each new season. This month, it is 319 miles (and some change) long.
This map is mobile compatible and will locate you on the trail if your device has GPS. Try it out and tell us what you think.
The map includes the new extension from Leatherwood Ford to Honey Creek.
Johnson Highway Day Map
On September 20, 2014 a downtown Lexington neighborhood hosted a block party and potluck. Raffles were held, which indeed included some outrageGIS mapping hiking maps. This map is entirely custom and shows only sidewalks and the location of the block party. The map layers two different tile sets. The minimal aspect focuses one’s attention to pedestrian modes of travel, since block parties kick out the cars.
University of Kentucky Alumni Map
A slippy map that shows alumni districts for the University of Kentucky. A shapefile of the districts was simplified with polygon edges snapped to align and then converted to a GeoJSON file. Tried to convert to TopoJSON with the hope to minimize file size, but unfortunately with little luck. District centroids were exported and converted to marker icons. A simple example of open source mapping.
More 3D maps
We’re almost finished with a 38″ x 13″ map of cabins and ziplines in Cliffview Resort. This is an unusual map, since it is a bird’s eye view with latitude and longitude as the index grid for locating cabins and other destinations. The base map is an ArcGIS terrain dataset with National Agriculture Imagery Program (NAIP) aerial photography draped over a rendered TIN surface in ArcScene. The maps was then composited and illustrated in Photoshop and Illustrator.
Boone Trace, A Kentucky Frontier Trail
In 1775, Daniel Boone and his party blazed a route into Kentucky and created the pioneer settlement, Boonesborough. The Trace is often confused with the Wilderness Road, since they follow the same route through southern Kentucky, but the Trace predates the Wilderness Road. Boone established the main road through the Kentucky mountains and into the outer Bluegrass. That road would later be known as the Wilderness Road. Boone Trace leaves the Wilderness Road south of Richmond, Kentucky and travels north to Fort Boonesboro.
Today, plenty of historical monuments exists along drivable portions of the Trace. BooneTrace1775.org describes, “There is a monument at the Daniel Boone Park in Flat Lick, Ky. Emblazoned on it are these words which pretty much say it all–  ‘No other trail is of greater historical significant to the founding of Kentucky and opening of the west (than Boone Trace).'”
This map attempts to show a driving tour of the Trace and aggregates many of the cultural and historical destinations once could visit today. It was designed for mobile web browsers and uses Leaflet to power the interactivity.
It’s pretty amazing to see how much dynamic web mapping has changed over the past decade. Before, we had Flash content and static layouts, as illustrated by the Elkhorn City Living Cemetery project. Today, we have data-rich maps that take a fraction of the time to create.
Working on a Cumberland Falls map
This July we have started a topographic trail map for the Cumberland Falls State Resort Park. The map will use aerial photography, 20-foot elevation contours, and GPS mapped trails. This two-sided 13.5″ x 19″ full-color map will show the entire park and connecting trails into the Daniel Boone NF, including Dog Slaughter Falls. This map is at 1:15,000 scale. The second map will zoom into the central area of the park and show trails at 1:5,000 scale. We anticipate this will be an awesome map, especially when used under a moonbow.
McConnell Springs Trails
A perspective view of trails and destinations in Lexington’s McConnell Springs park. This historic location host notable destinations such as the Blue Hole, The Boils, the Old Bur Oak, and the Final Sink. This map will be offered to park after some additions and modification, perhaps adding a more realistic model of the Science Center.