Experimenting with Geolocation API

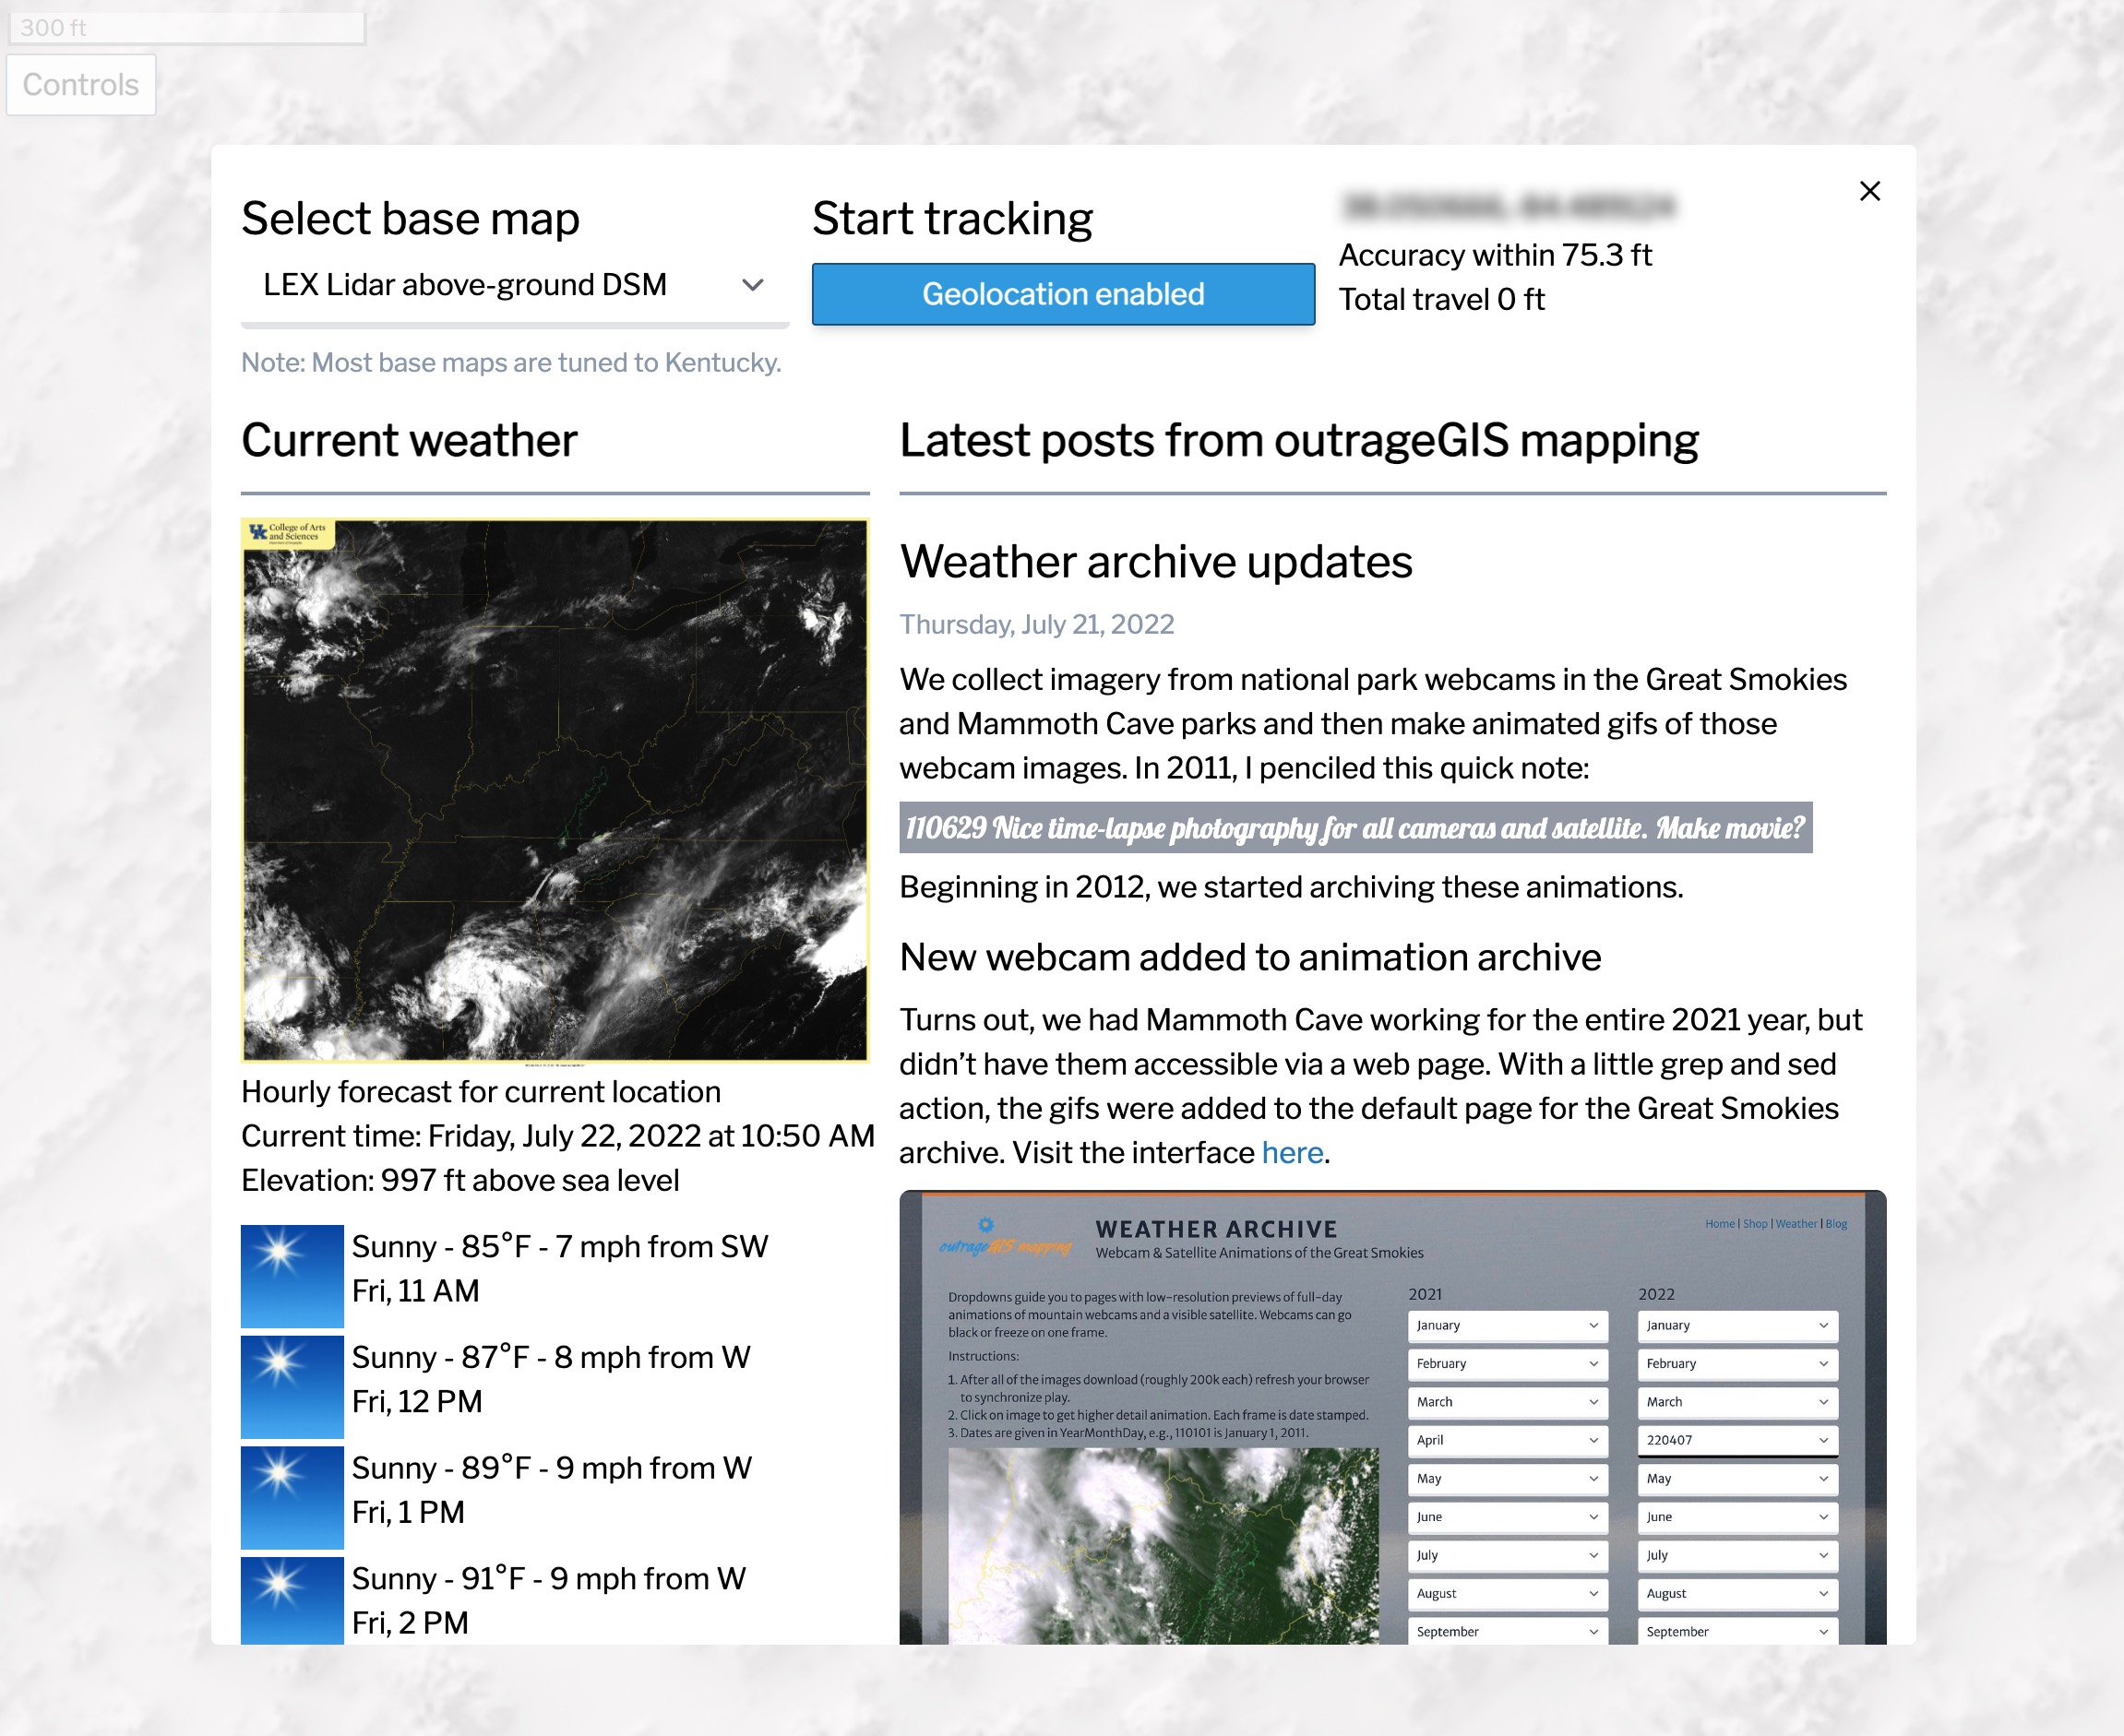
We have a lot of great raster base map services available in Kentucky and I wanted to access them for my current location when I use my mobile device in the field. While there are many ways to make a mobile map, I wanted use Leaflet JS and build a custom geolocation service using the Geolocation API. Some desired features for the web page:

  • The interface should be just the map, with a single button to access the controls
  • Location services should record a track of previous locations with distance covered
  • Location coordinates should be averaged over a sample period to help with accuracy
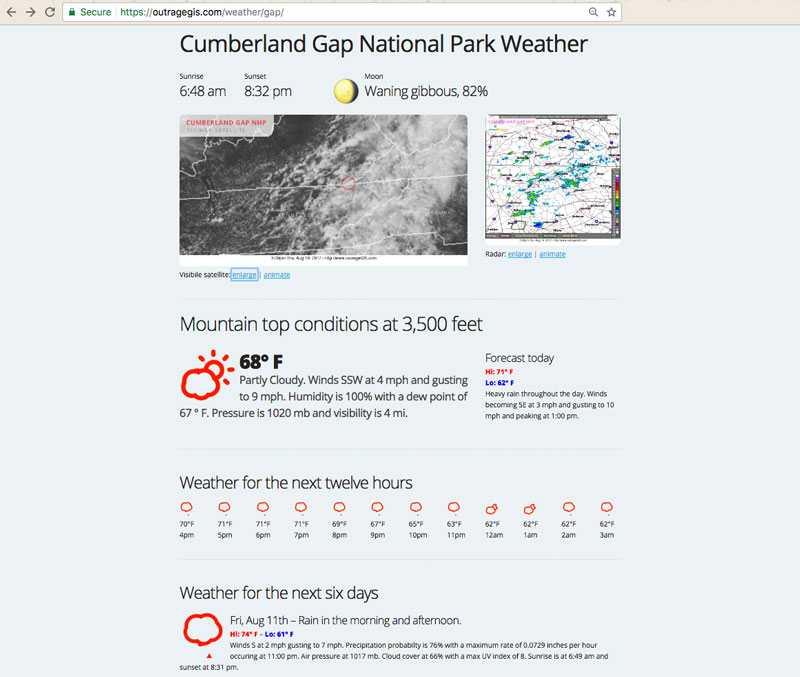
  • Other information for the current location should be offered on the page, e.g., hourly weather forecasts.

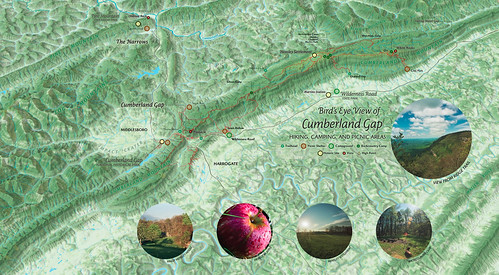
Map cound found here: https://outrageGIS.com/location

The below screen capture shows the control panel for selecting base map and enabling the the location services. It also gratuitously adds content from the last three posts to this forum. (Practicing with Tailwind CSS for potential site redesign.)

Screen Capture of control panel

Please feel to add your comments and tell how it works on your mobile device. It has tested on Chrome and Safari mobile browsers.

Some caveats.

  • The tracking feature is tuned to walking. If you drive or bike, the track will more generalized the faster you travel.
  • Of course, you’ll need to enable location for the page :). I promise that nothing is used or saved from your session. This is a completely client-side app.
  • If you refresh your browser, the page is reset and your track is lost. Working on a local database option to save the track.
  • This page requires an online connection. Working on an offline version, too.

Screen Capture of control panel 
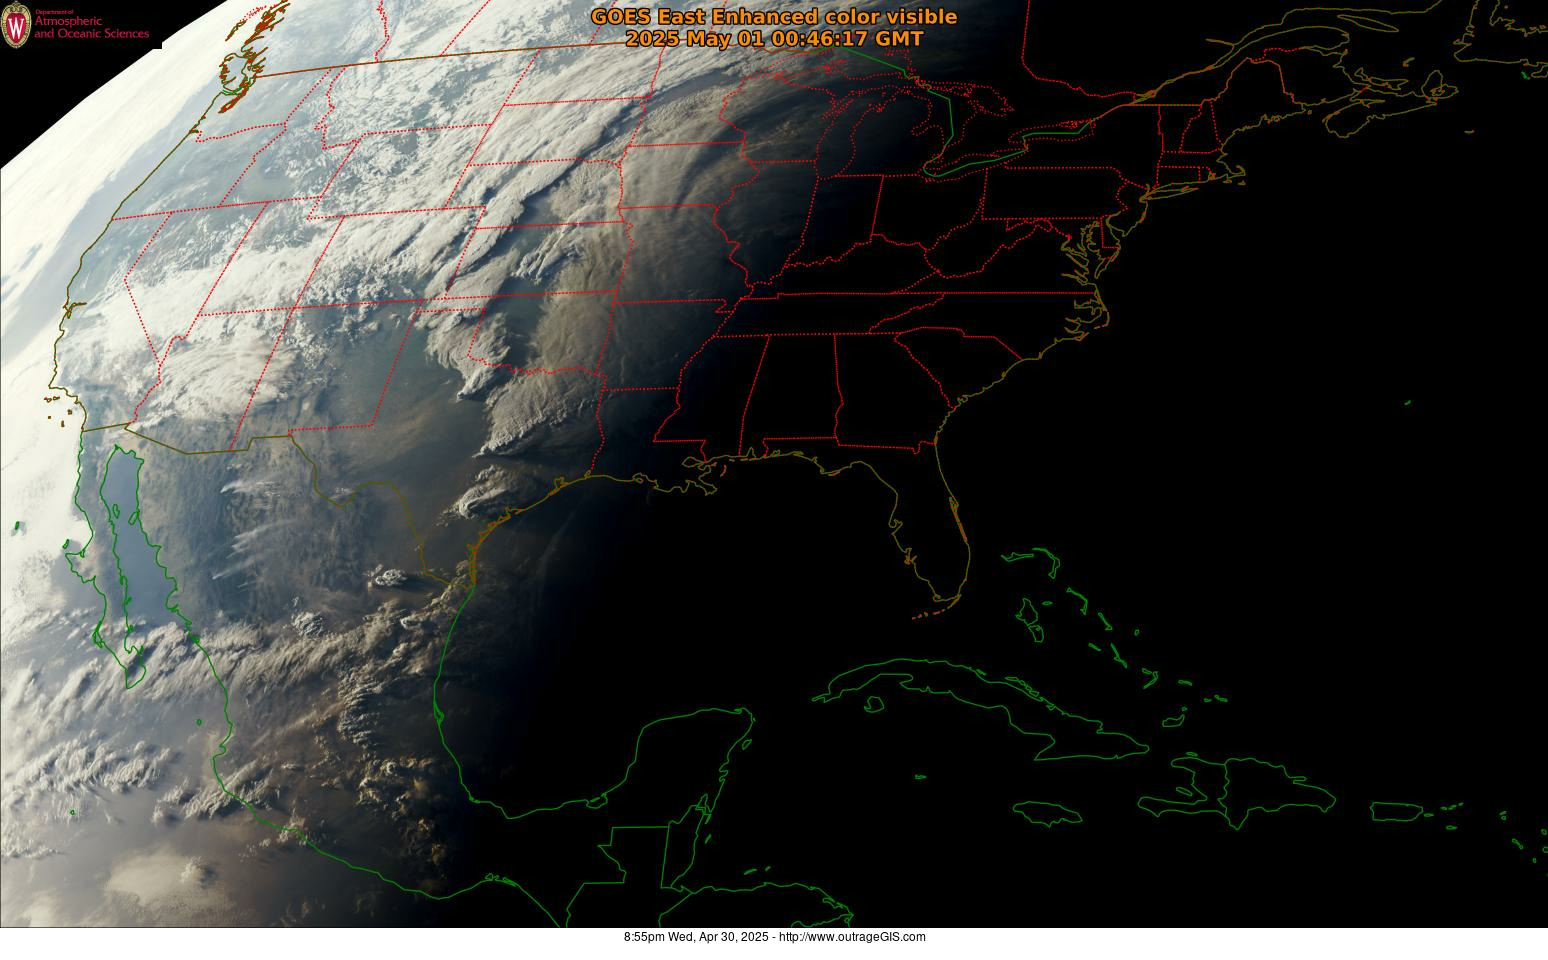
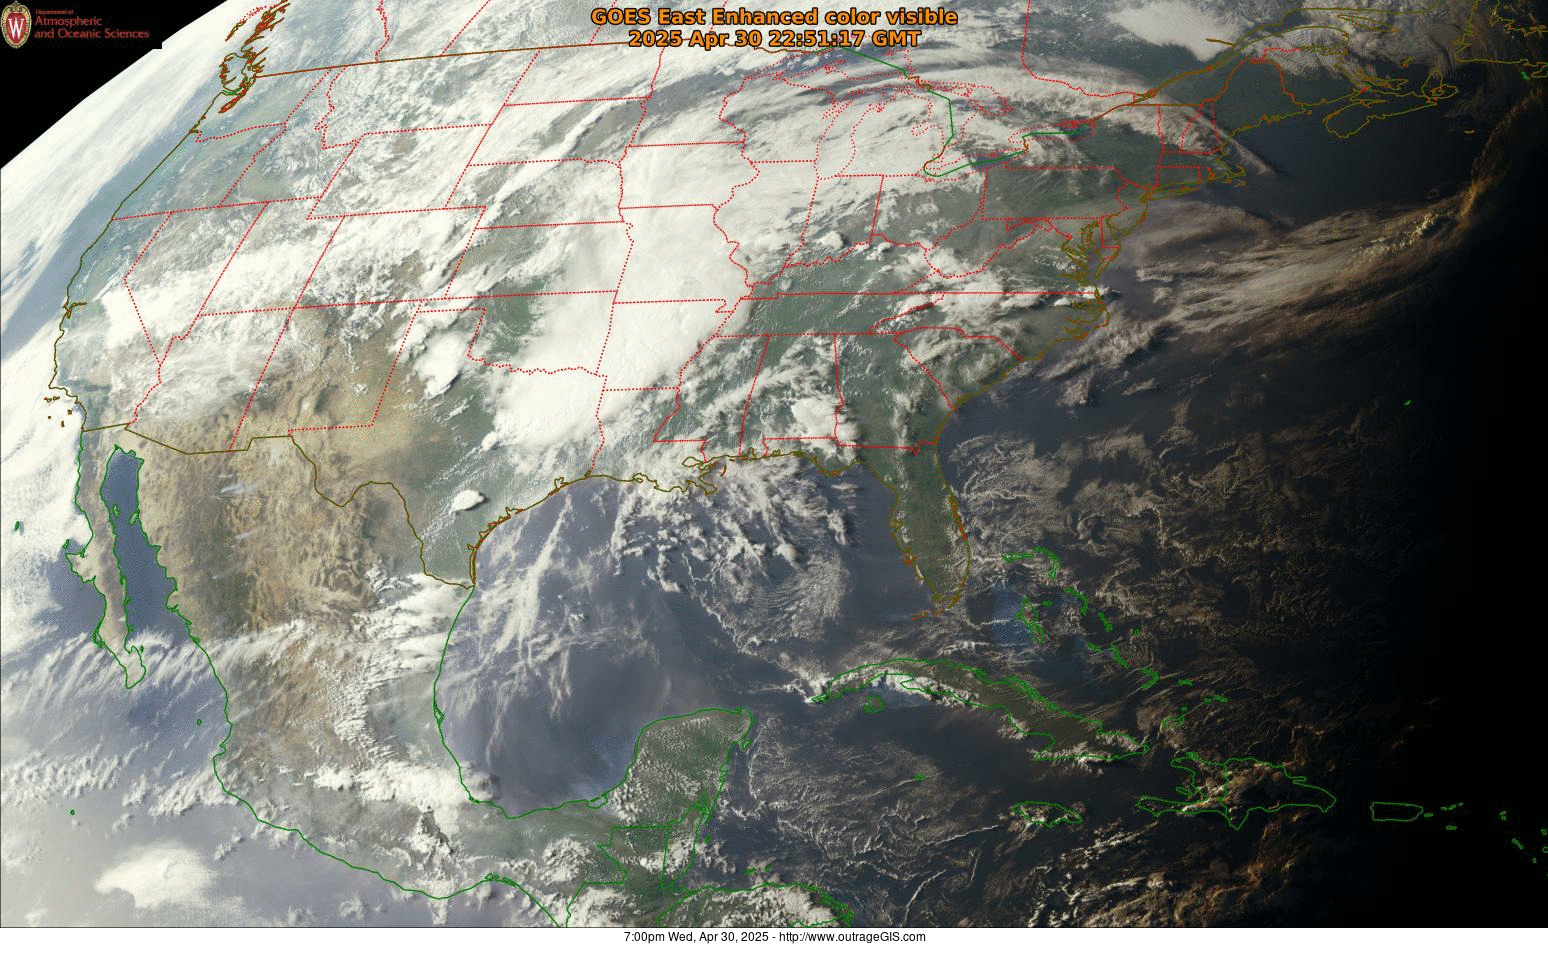
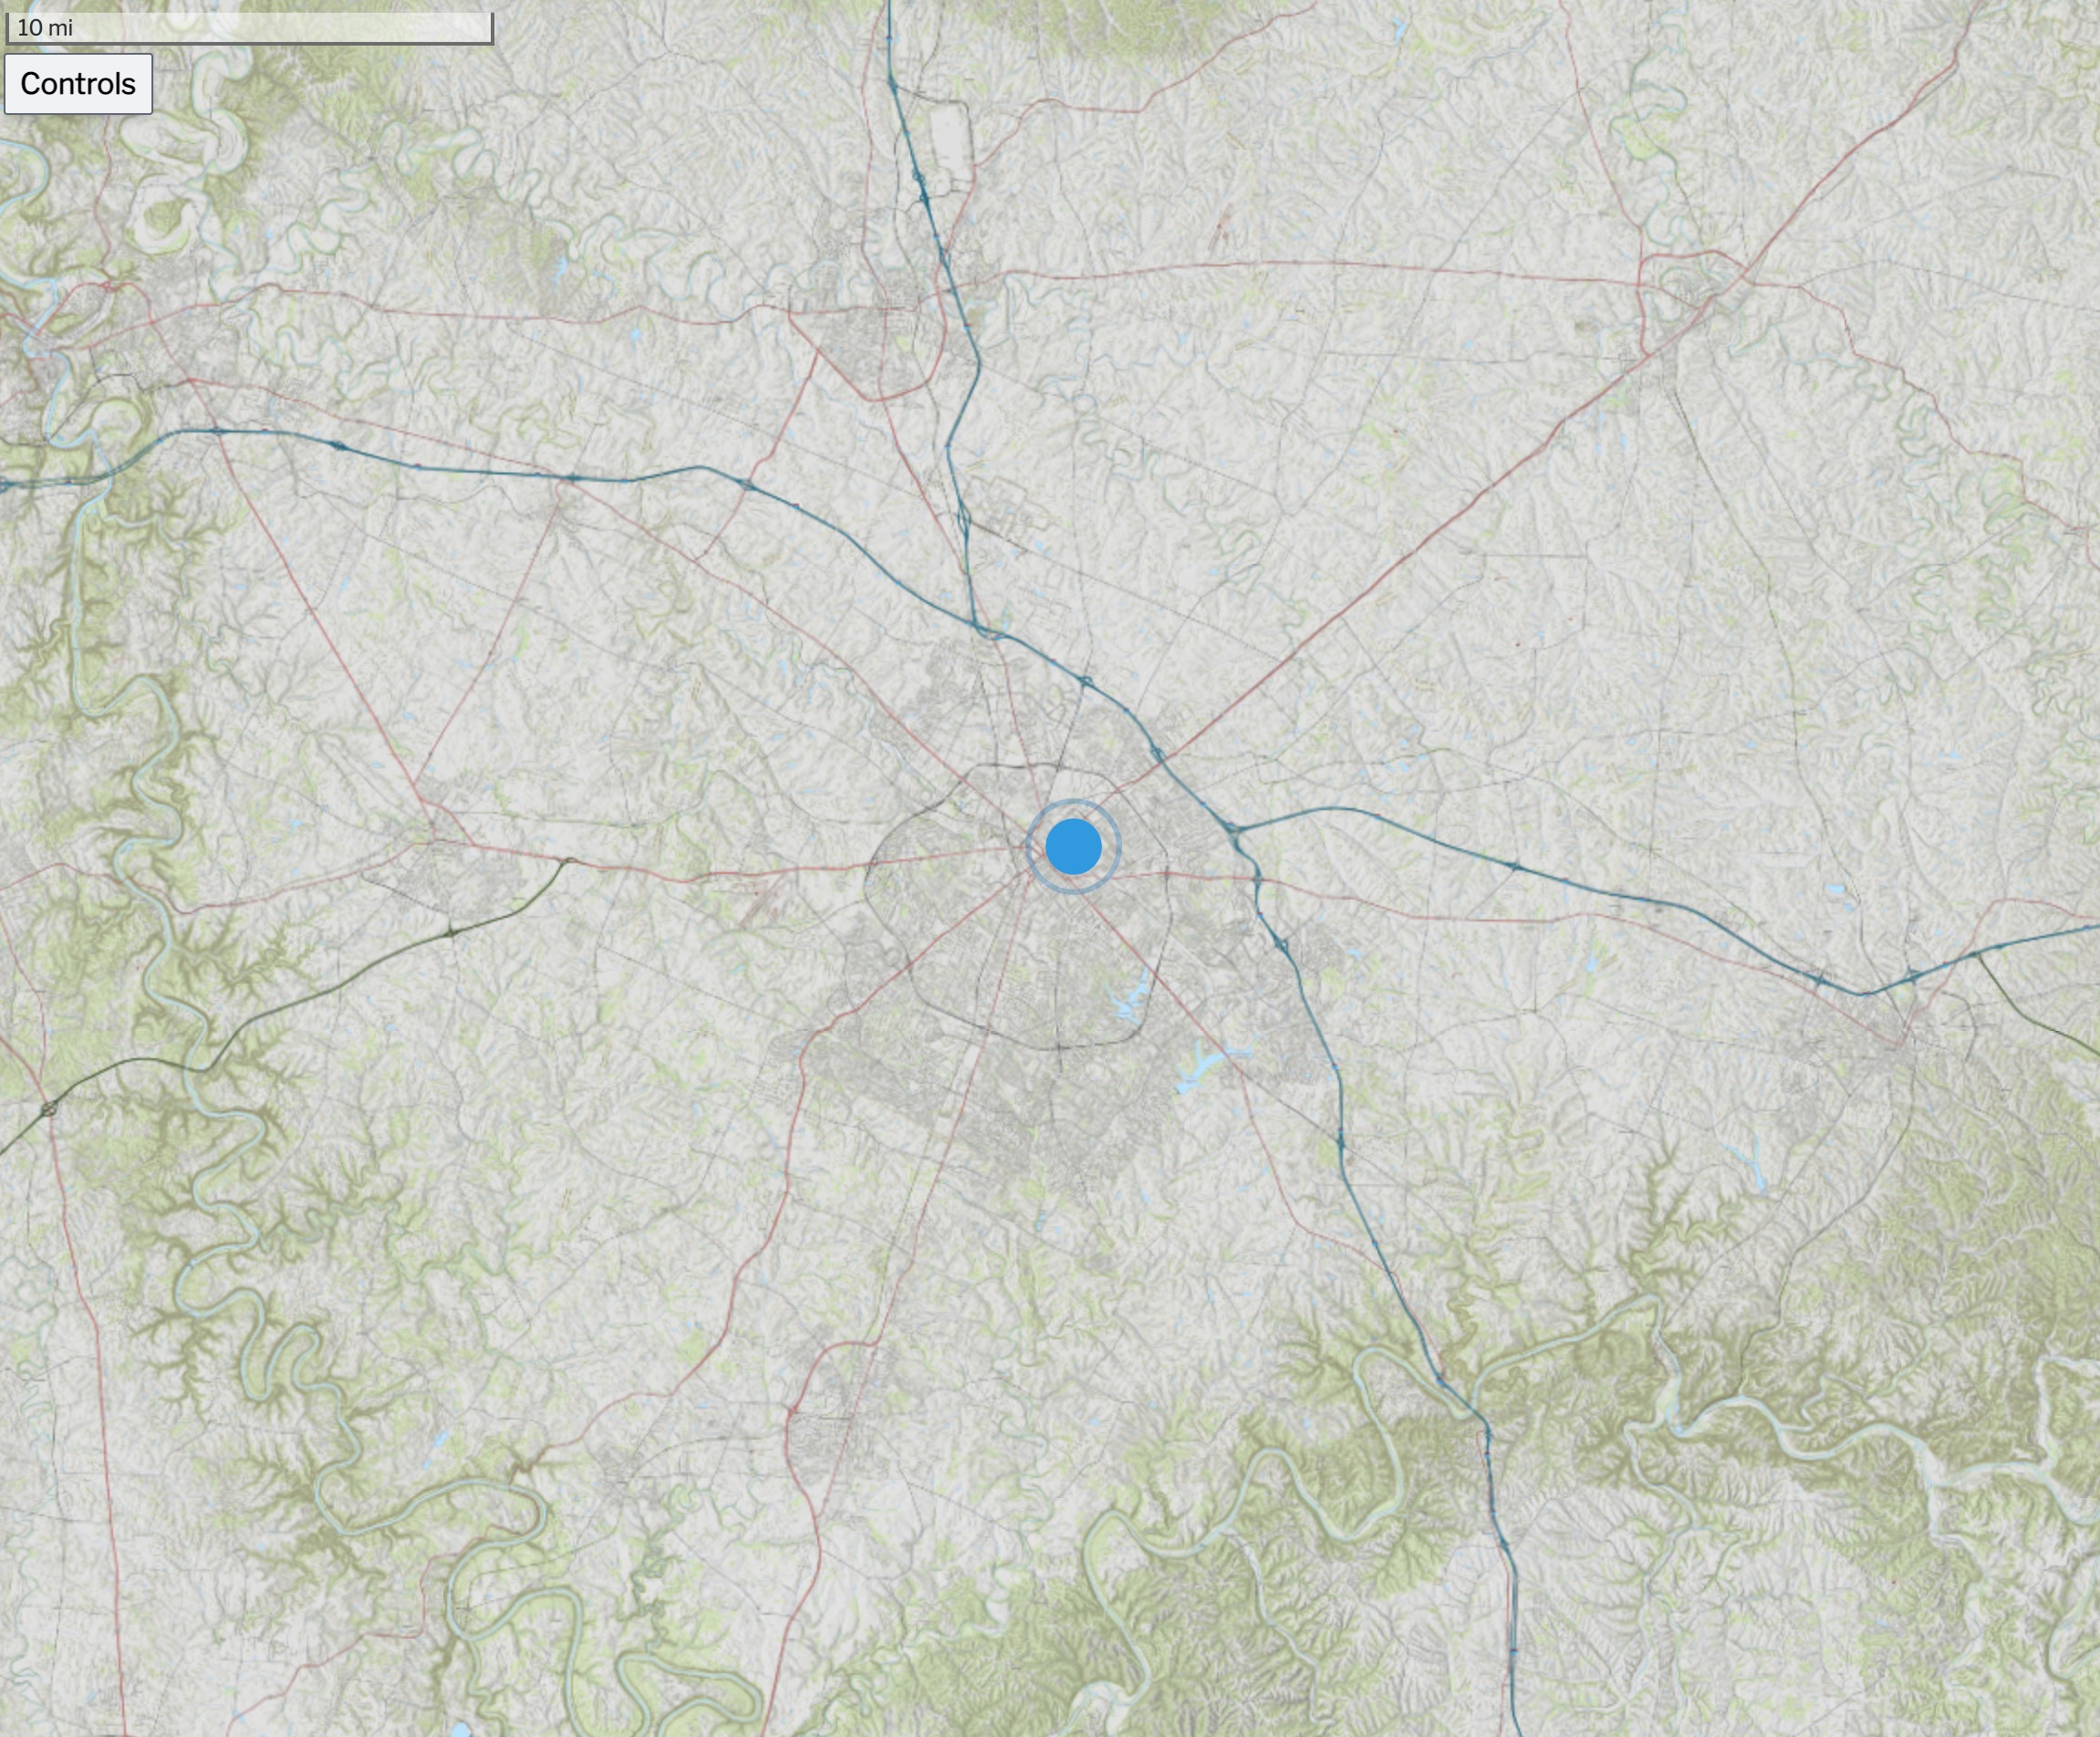
Above is an screen capture of the Kentucky Topo map for the state. Other base maps include, lidar-derived surface models and current GOES-16 imagery.

Screen capture of mobile device 
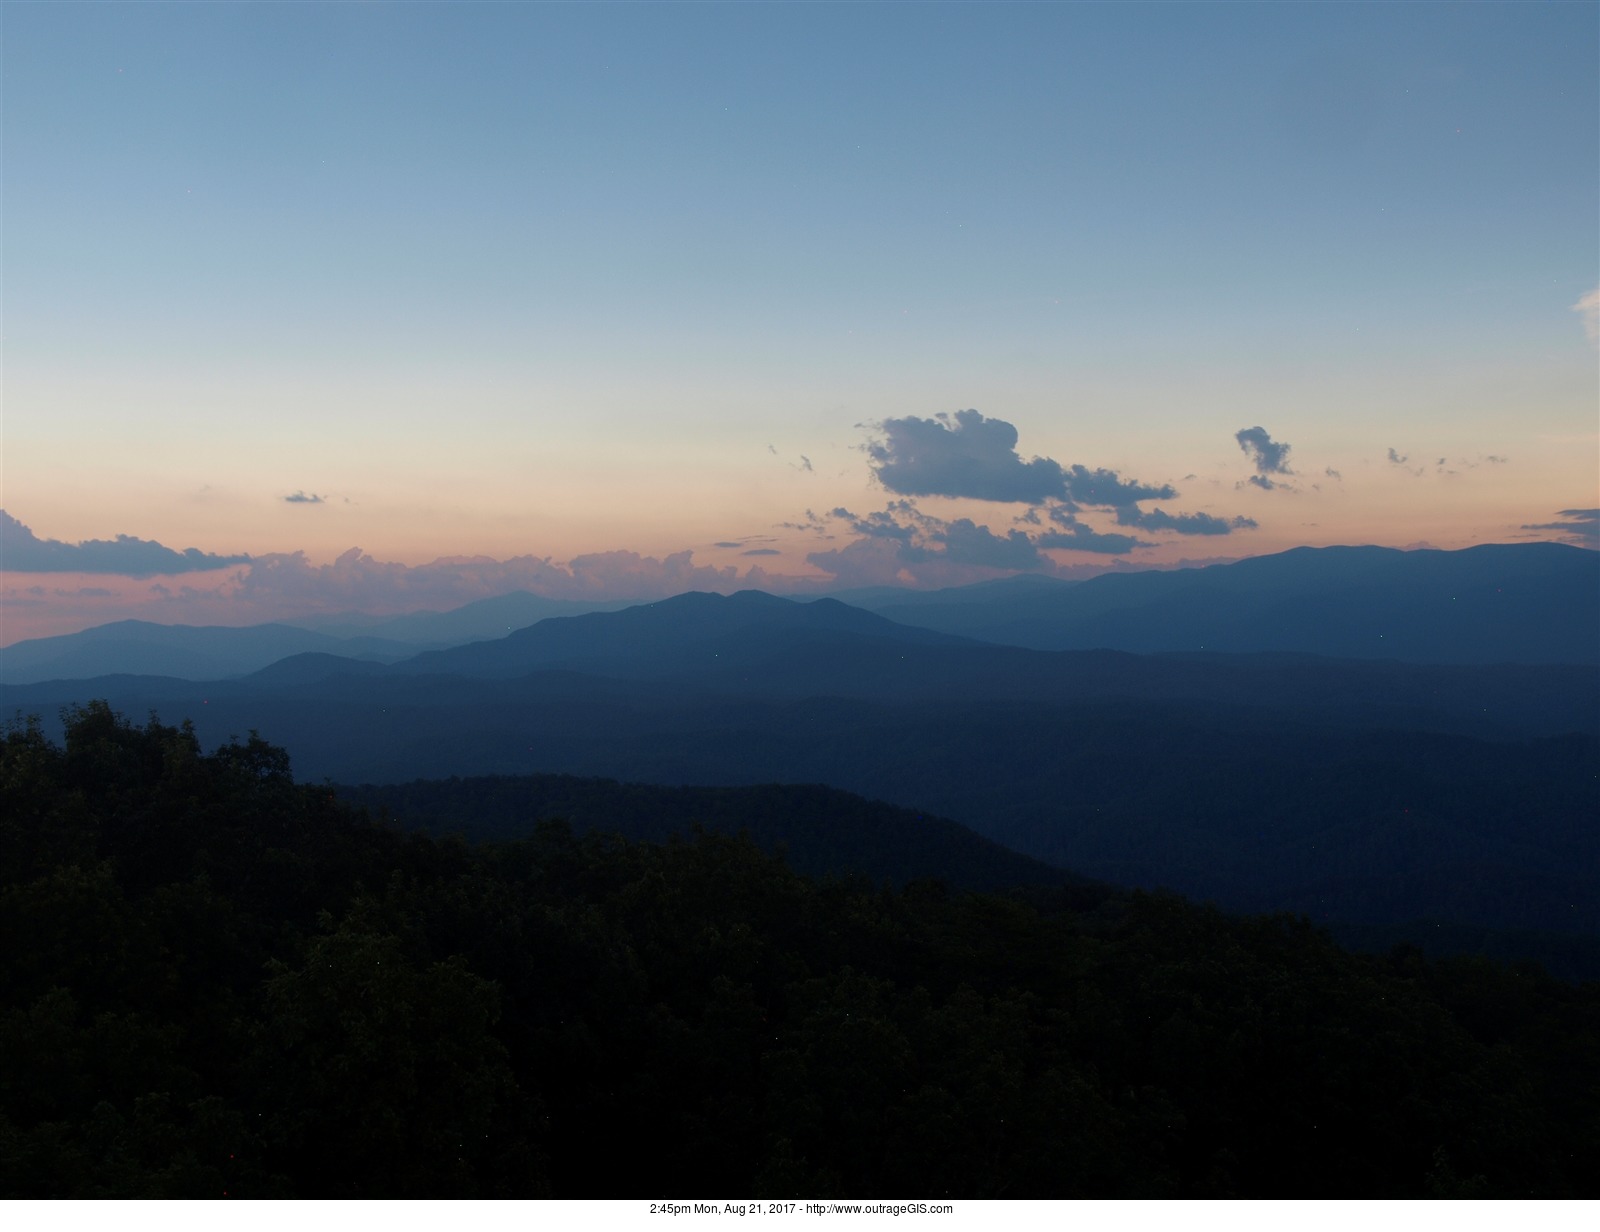
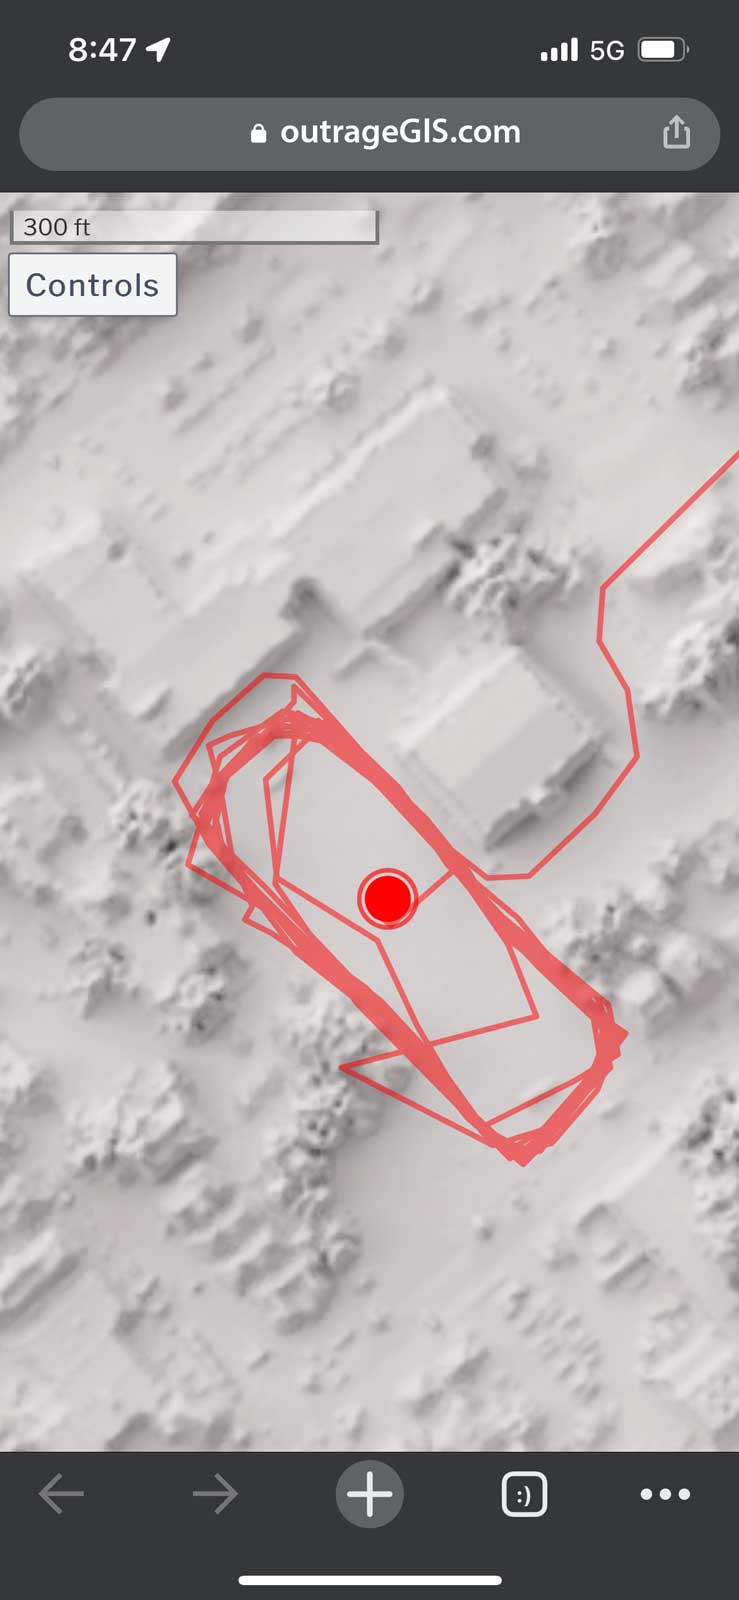
Screen capture of track mapping on a mobile device

Weather archive updates

We collect imagery from national park webcams in the Great Smokies and Mammoth Cave parks and then make animated gifs of those webcam images. In 2011, I penciled this quick note:

110629 Nice time-lapse photography for all cameras and satellite. Make movie?

Beginning in 2012, we started archiving these animations.

New webcam added to animation archive

Turns out, we had Mammoth Cave working for the entire 2021 year, but didn’t have them accessible via a web page. With a little grep and sed action, the gifs were added to the default page for the Great Smokies archive. Visit the interface here.

Weather and animation archive

We plan on having at least the last year covered in the archive. At 60 GB a year now with HD cameras, it can get expensive hosting multiple years. I do have the years back to 2012 stored offline.

New images and data from GOES-16

Visit the page to view and download imagery

Over Christmas break, it was time to automate collecting and displaying the incredibly detailed imagery from the GOES-16 Advanced Baseline Imager. A problem that plagued previous efforts was not accessing the raw data, a netCDF formatted file for the contiguous U.S. which can be downloaded freely from a variety of cloud data hosts. With the raw data, one can project, modify and use it in web mapping libraries like Leaflet.

This page offers a slippy map of grayscale and color imagery and is updated every 15 minutes. You can download GeoTIFFs of rendered layers that can be used in GIS applications.

New GOES-16 satellite imagery for Kentucky

High-resolution weather imagery from GOES-16

Though GOES-16 is not officially operational, the availability of imagery has steadily increased. We found the Department of Atmospheric and Oceanic Sciences at the University of Wisconsin-Madison hosts a set of imagery. The satellite will become fully online in November and undoubtedly many other data sources will be available.

This weather satellite captures 16 spectral bands with time resolutions as quick as every 30 seconds. The spatial resolution (the size of each pixel) is between 0.5 km and 2 km and the visible grayscale image for the continental US is 12,000 x 9,000 pixels and is collected every 5 minutes.

We wrote a series of crontab jobs to automate the processing of weather imagery to display on our website.

Real-time satellite image maps

Great Smokies solar eclipse images and animations

2:45pm looking across Rich Mountain and Cades Cove

For over a decade we’ve collected views from reliable weather web cams to build daily time-lapse animations for the Great Smoky Mountains. We’ve called the project Yesterday in the Great Smokies and offer a daily archive for the past three calendar years.

The August total solar eclipse in the southern Great Smokies offered a great opportunity to showcase some unique images from the archive.  [Read more…]

Cumberland Gap weather station

Gap weather page using Dark Sky weather data

We’ve updated our Cumberland Gap National Historical Park weather station! With the release of our 2017 trail map for the Gap, we decided to go in a new direction for our weather station. Our stations for the Daniel Boone and Great Smokies pull data and images from the National Weather Service. We then use ImageMagick and other UNIX utilities to process the data. It is kinda old-school, but it has worked well for years.

With the Gap weather station, we decided to go with the Dark Sky team. They made a big impact a few years ago with their weather maps so we decided to try their extremely detailed point location forecast data.Their API is well documented and we use mostly Javascript to build the weather page. We focused on weather conditions at the top of the mountain since the park has over 2000 vertical feet of elevation relief. We couldn’t the same detail from the NWS. As we explore the mountains we’ll compare the relative advantages of both of these data sources.

You can find the mountain top weather page here: https://outrageGIS.com/weather/gap

Cumberland Gap NHP interactive map

Interactive 3d map using Leaflet

Interactive 3d map using Leaflet

A bird’s eye view map of Cumberland Gap National Historical Park created in conjunction with our 2016 new release of the park map. This map is not georeferenced to real-world coordinates and uses a javascript mapping library, Leaflet, to generate the interactivity. We think of the developing project as a gateway for multimedia about the park’s environment and history that we want to share.

https://outrageGIS.com/gap/3d


Elevation profile of connected interior spaces

Preview_LexingtonProfile

Enlarge this graphic

It’s downtown Lexington, summer, and hot. Poor air quality and oppressive heat are hazards for older walkers and those with cranky babies. An interior (mostly air conditioned) pedway exists that connects various buildings downtown and is a walking convenience for many folks. When Lexington has more shady pedestrian paths away from city streets, walking inside wouldn’t be so inviting and necessary. [Read more…]

Lexington Bike/Ped versus Car Collision Analysis

Website of collision maps

Website of collision maps

For a GIS course at the University of Kentucky Department of Geography (GEO 409), we mapped and analyzed the incidences of car collisions with pedestrians and bicyclists. Using data from Kentucky Crash Analysis Wizard (crashinformationky.org), we harvested collisions for Fayette County from January 2004 until April 8, 2016, the entire dataset at that point in time. 

The website of collision maps is available here: http://boydx.github.io/collisions/ and the bike map is http://boydx.github.io/collisions/bikes

[Read more…]

Lexington’s Urban Canopy

An exploration of canopy cover measures

An exploration of canopy cover measures

How much tree canopy covers the urban service area of Lexington, Kentucky? Inspired by the Davey Resource Group’s October 2013 study of canopy cover using 2012 NAIP imagery within Lexington’s Urban Service Area, a GIS class at the University of Kentucky created a similar, though limited, evaluation. [Read more…]

Topography and Hemlock Habitat

Elevation range in feet within an area 164-foot square

Elevation range in feet within an area 164-foot square

Sheltered coves and north-facing cliffs are hemlock habitats in Eastern Kentucky. This map shows range of elevation change within a 164-foot square area. Red areas indicate the highest relief, which are mountain slopes in the coal fields, and cliffs along the Pottsville Escarpment and Pine and Cumberland Mountains fault. Since most cliff is sandstone, areas indicated as cliffs would presumably have sandy soils, which is a condition for other evergreen species habitats, e.g., mountain laurel and rhododendron.

This is first-run test. Further analysis would include adding aspect, evergreen canopy cover, and soils to better refine predicting hemlock habitat.

A Postcard from Puerto Rico

Photos and a block diagram of NE Puerto Rico

We recently visited Puerto Rico and explored the island’s public parks and forests. Spanish forts in San Juan are wonderfully preserved by the National Park Service and the El Yunque cloud forest is the only tropical rain forest maintained by the National Forest Service. These ares are public treasures and hard to capture by photography alone. You might have seen postcards with extruded maps of mountainous areas and tourist destinations. That’s the quick experiment here, but done just two-dimensionally.

New Weather Graphs

Weekly graphs of weather variables

Weekly graphs of weather variables

Weather Underground’s weather stations are an awesome resource. Volunteers with weather stations feed their observations to site’s ‘big brain’ and make it publically available. We inserted weekly weather graphs for two stations near the Great Smokies; one on the west side in Tennessee and the other on the east side in North Carolina. Visit our GRSM weather page and tell us what you think.

Cold Mountain web cam back up

Cold Mountain in May

Cold Mountain in May

After a severe winter, the Cold Mountain webcam is back in operation. As we move into summer, we hope all cams remain healthy so we can collect and archive animated scenes.

What we have now is pure spring delight, so please enjoy.

Winter into Spring, Kentucky 2014

Winter to Spring in Satellite Images, 2014

Winter to Spring in Satellite Images, 2014

After an unusually long and cold winter, Kentucky has finally emerged to full-blown spring weather. These five images show the clearest, cloud-free day for each month from January 1 to May 5. Snow is clearly seen in the first two months and it’s striking how defined the snow lines are, perhaps 20 miles. You could have heavy snow in Lexington, but snow free in Richmond.

In the January image, we can see the hemlock and pine forest in the Red River Gorge and recently mined ares in eastern Kentucky. In the February image, Cave Run Lake appears frozen.

Another interesting observation is the rate pastures and forests leaf out. Kentucky’s pastures became green in early April, while the forests leaf out by the first days of May.

March is my favorite image. The sun is the highest while the vegetation is at the minimum.  Soon, the explosion of photosynthesis will sweeten the earth with life.

No wildfires are seen (maybe one in April image in eastern Kentucky).

0

Your Cart