
Lidar point cloud interactive visualization of Lexington’s Legacy trail with a custom 100-ft buffer applied to the trial. outragegis.com/pointclouds/legacy
Lidar point cloud interactive visualization of Lexington’s Legacy trail with a custom 100-ft buffer applied to the trial. outragegis.com/pointclouds/legacy

Over Christmas break, it was time to automate collecting and displaying the incredibly detailed imagery from the GOES-16 Advanced Baseline Imager. A problem that plagued previous efforts was not accessing the raw data, a netCDF formatted file for the contiguous U.S. which can be downloaded
This page offers a slippy map of grayscale and color imagery and is updated every 15 minutes. You can download GeoTIFFs of rendered layers that can be used in GIS applications.
During the Fall 2018 semester, students mapped and visited arches and waterfalls in Kentucky’s Red River Gorge Geological Area. They adopted an arch or waterfall and produced maps, analyses, 3D visualizations, and a web page that explores their arch. Visit the site.

Thanks to students and crew in the University of Kentucky’s Natural Resources and Environmental Science (NRES) for this article in their Fall 2018 Newsletter.
![]() I am happy and proud to announce that I have accepted a faculty appointment as Lecturer in the University of Kentucky Department of Geography. Since 2008 I have been teaching in the department as an adjunct. With a potential move to the University of Wisconson Madison to teach GIS, I reflected on the possibilities of focusing on Kentucky and decided to stay in the Bluegrass.
I am happy and proud to announce that I have accepted a faculty appointment as Lecturer in the University of Kentucky Department of Geography. Since 2008 I have been teaching in the department as an adjunct. With a potential move to the University of Wisconson Madison to teach GIS, I reflected on the possibilities of focusing on Kentucky and decided to stay in the Bluegrass. ![]() My current teaching assignment spans open source and ArcGIS mapping platforms in both the traditional classroom and through online courses in New Maps Plus. Learn more about the opportunities and successes in mapping at the University of Kentucky and consider getting a Masters in Mapping or a graduate certificate in open source mapping.
My current teaching assignment spans open source and ArcGIS mapping platforms in both the traditional classroom and through online courses in New Maps Plus. Learn more about the opportunities and successes in mapping at the University of Kentucky and consider getting a Masters in Mapping or a graduate certificate in open source mapping.
How will this impact outrageGIS mapping? Not much. The topographic map shop will continue as normal and I will still explore and make unique maps and data for Kentucky and surrounding areas. The main change will be a deprioritizing client work in favor of university projects. For example, this year is the 75th Anniversary of the Department of Geography and is a priority project. outrageGIS mapping will also support the department’s Pauer Center for Cartography, so if you need a custom map we can make through the Center.
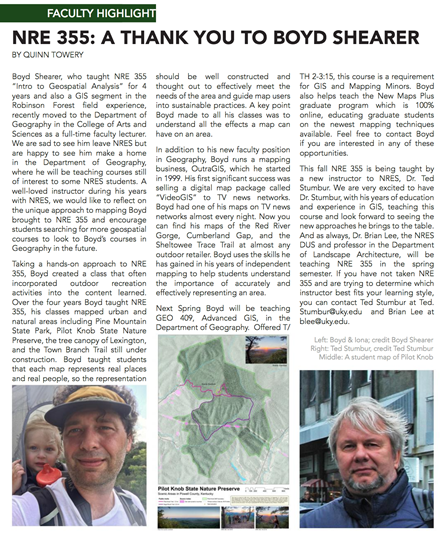
Natural Bridge profile from point cloud
This summer we are planning an update to our popular Red River Gorge trail map. Since the release of the Lidar point cloud data for Daniel Boone National Forest, we have been excited to start the project. With a pixel resolution of 5-foot, this is the most detailed elevation layer we have for the Red River Gorge. Let’s take a look at some samples. An elevation profile of the well-known landmark, Natural Bridge arch, shows canopy slightly dimmed and you can clearly see the arch.
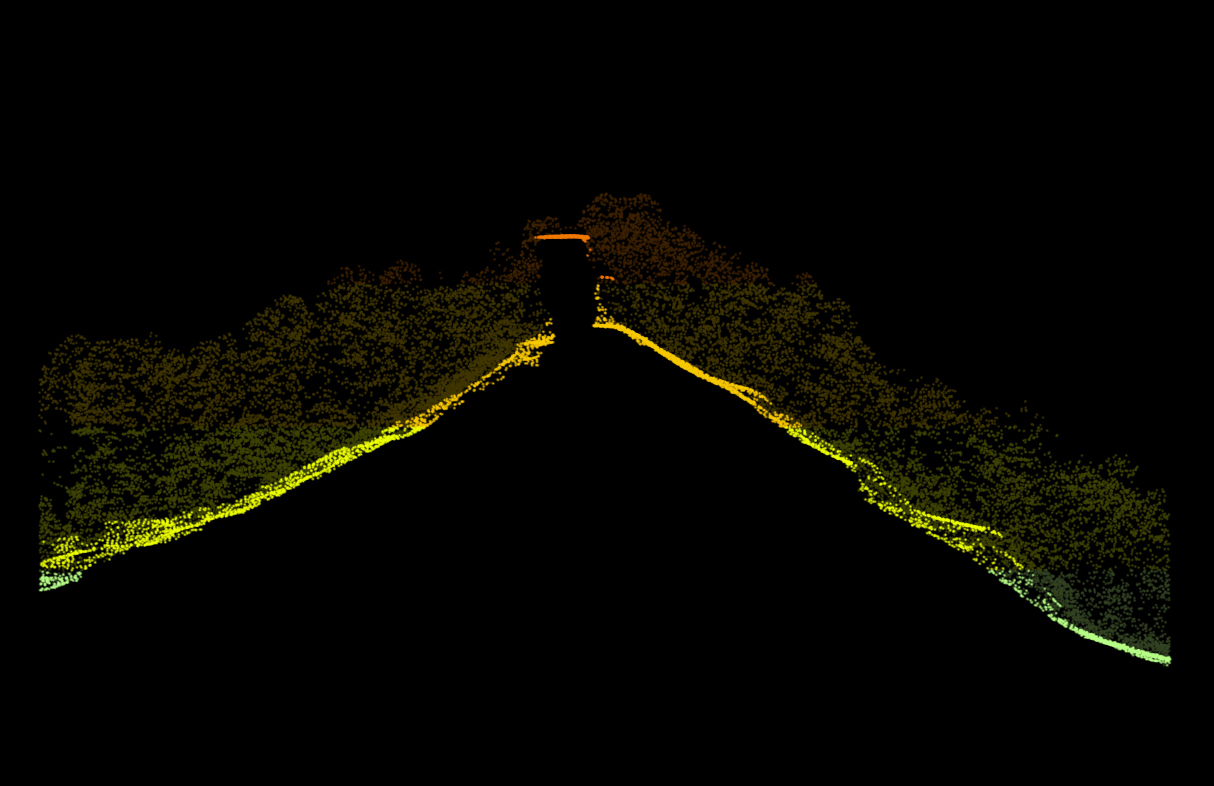
Cliffs over 100 feet in Chimney Top area
Many other interesting analyses are planned; for example, where are the high cliffs and overlooks? In the right image, we show the cliffs over 100-feet in height. We can clearly see the high cliffs of Pinch ‘Em Tight, Chimney Top, and the other high cliffs the line the Red River.
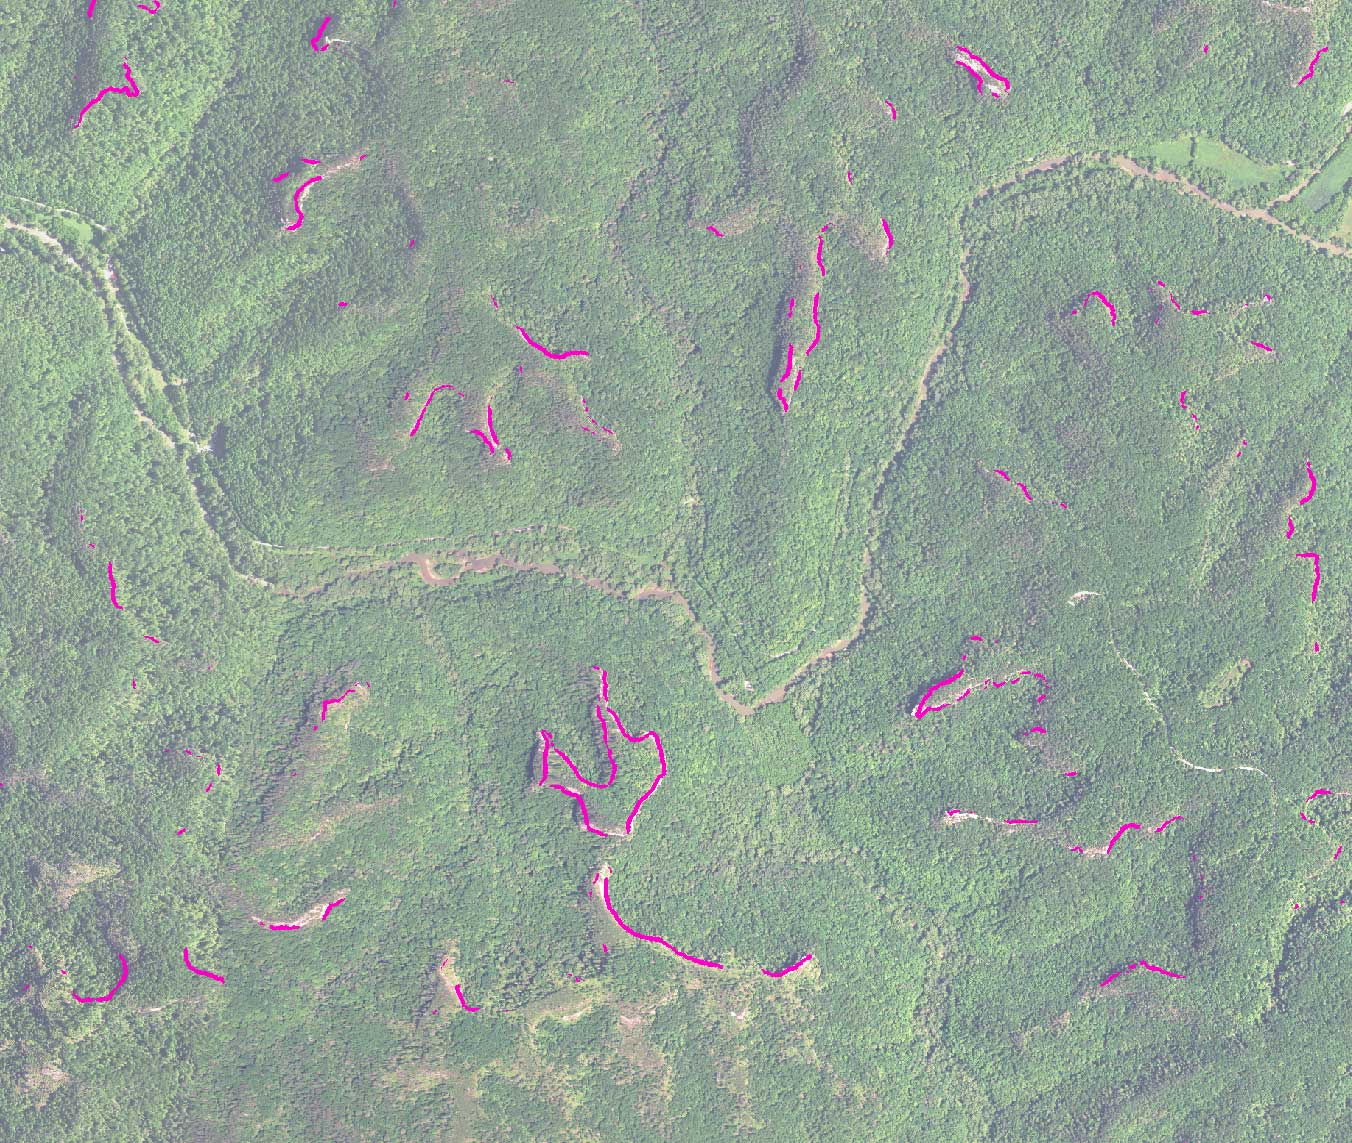
Cliffs over 220 feet in Small Wall area along Red River
Of course, the inclination is to find the highest cliff in the Red River Geological Area. With a preliminary analysis, we have found the Small Wall climbing area has one of the highest cliffs at 220-feet.
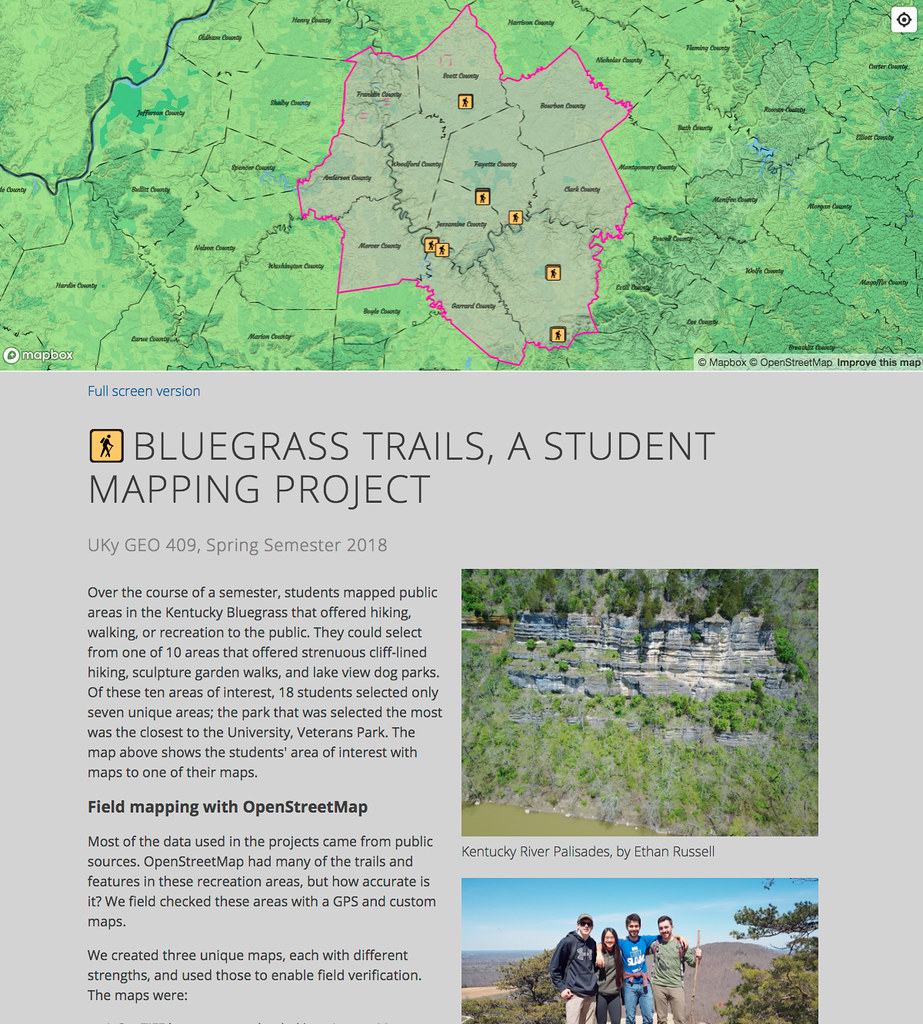
Over the course of the spring 2018 semester, UKy Geography students mapped public areas in the Kentucky Bluegrass that offered hiking, walking, or recreation to the public. They could select from one of 10 areas that offered strenuous cliff-lined hiking, sculpture garden walks, or lake-view dog parks.
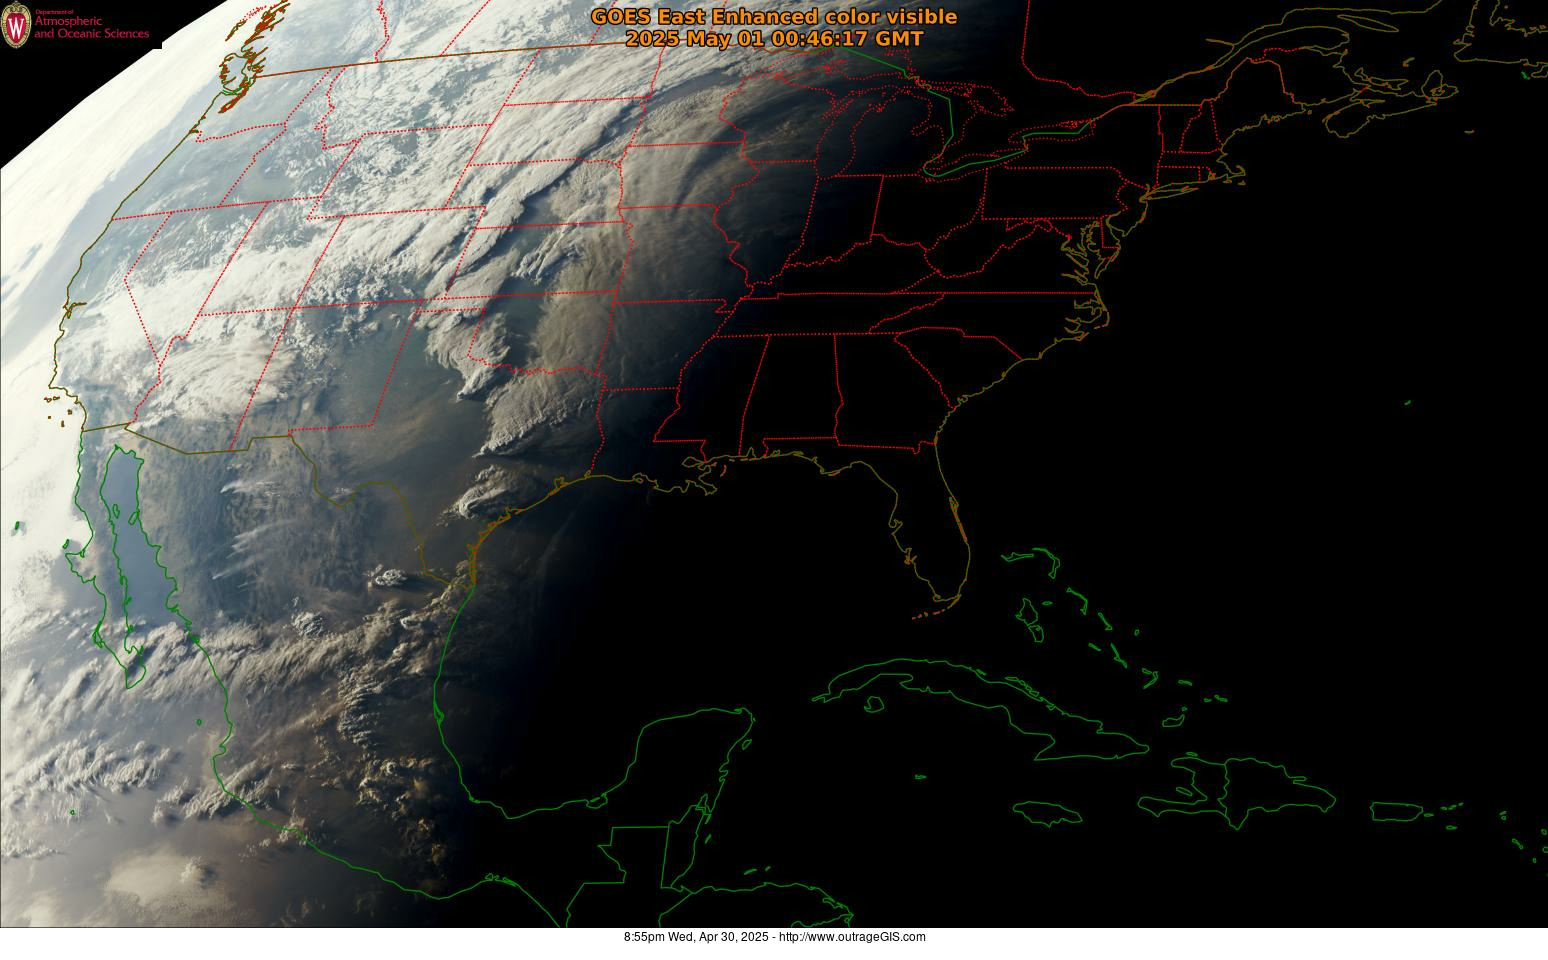
High-resolution weather imagery from GOES-16
This weather satellite captures 16 spectral bands with time resolutions as quick as every 30 seconds. The spatial resolution (the size of each pixel) is between 0.5 km and 2 km and the visible grayscale image for the continental US is 12,000 x 9,000 pixels and is collected every 5 minutes.
We wrote a series of crontab jobs to automate the processing of weather imagery to display on our website.
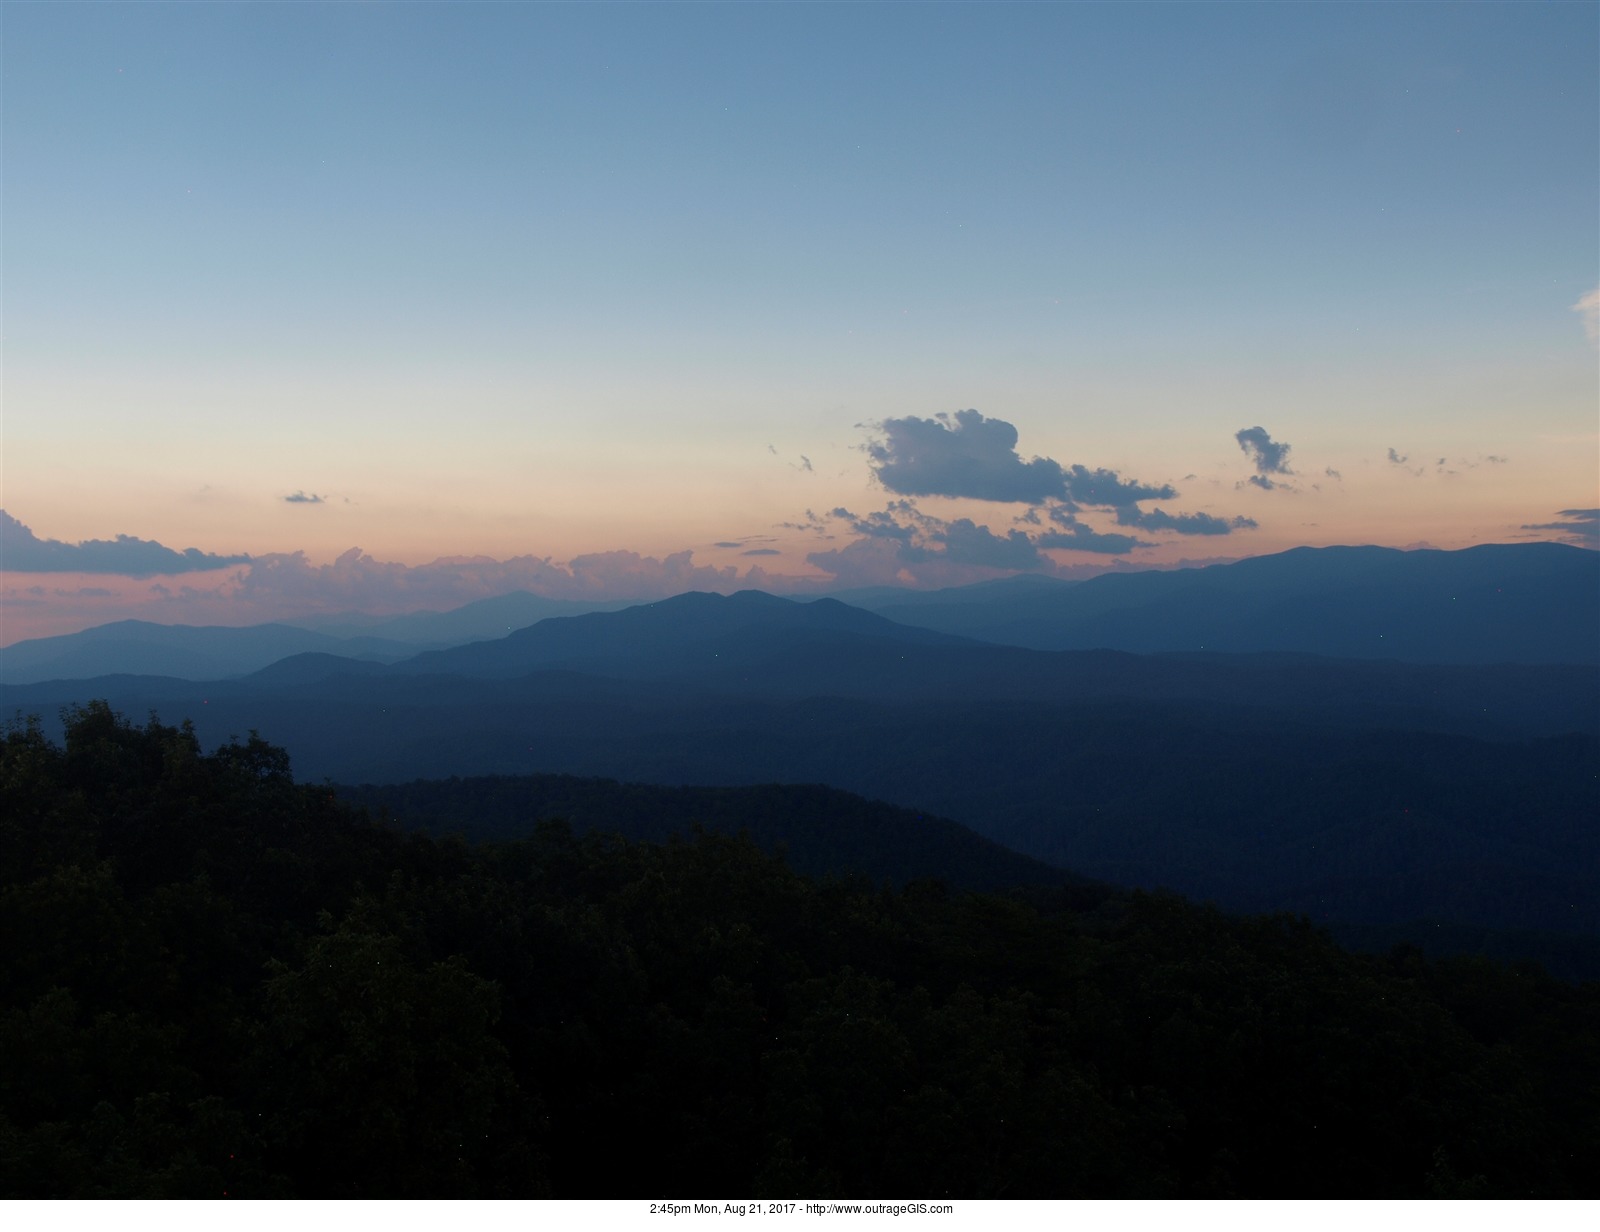
2:45pm looking across Rich Mountain and Cades Cove
For over a decade we’ve collected views from reliable weather web cams to build daily time-lapse animations for the Great Smoky Mountains. We’ve called the project Yesterday in the Great Smokies and offer a daily archive for the past three calendar years.
The August total solar eclipse in the southern Great Smokies offered a great opportunity to showcase some unique images from the archive. [Read more…]
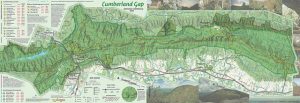
2016 Cumberland Gap trail map and hiking information
The update to our Cumberland Gap National Historical Park is now available. Much like the old map, our 2017 version is a 1 inch to 1/2 mile scale map with 50-foot contours, trail elevation profiles, and  GPS-mapped trails shown in vivid full-color printing. This year we added a layer that shows the density of canopy coverage and GPS-mapped Caldwell Gap Trail. The size of the park has increased since our last update, so we’ve included most of the additional land.
Gap weather page using Dark Sky weather data
We also have updated our weather page for the high mountain elevations for Cumberland Gap using hourly forecast information and time-lapse satellite photography. This will help plan your latest adventure to unique mountain environment of Cumberland Gap. You can find the weather station here: https://outrageGIS.com/weather/gap.
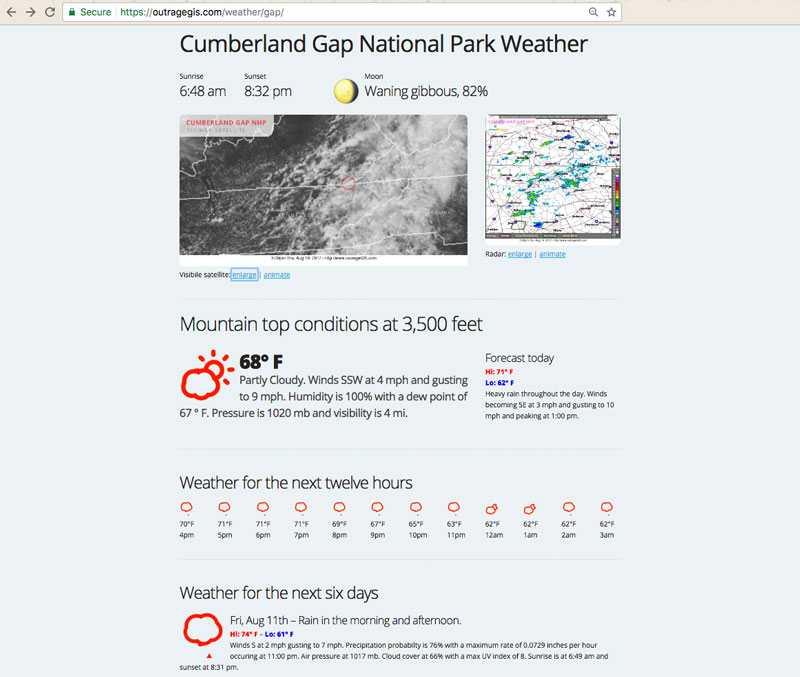
Gap weather page using Dark Sky weather data
We’ve updated our Cumberland Gap National Historical Park weather station! With the release of our 2017 trail map for the Gap, we decided to go in a new direction for our weather station. Our stations for the Daniel Boone and Great Smokies pull data and images from the National Weather Service. We then use ImageMagick and other UNIX utilities to process the data. It is kinda old-school, but it has worked well for years.
With the Gap weather station, we decided to go with the Dark Sky team. They made a big impact a few years ago with their weather maps so we decided to try their extremely detailed point location forecast data.Their API is well documented and we use mostly Javascript to build the weather page. We focused on weather conditions at the top of the mountain since the park has over 2000 vertical feet of elevation relief. We couldn’t the same detail from the NWS. As we explore the mountains we’ll compare the relative advantages of both of these data sources.
You can find the mountain top weather page here: https://outrageGIS.com/weather/gap
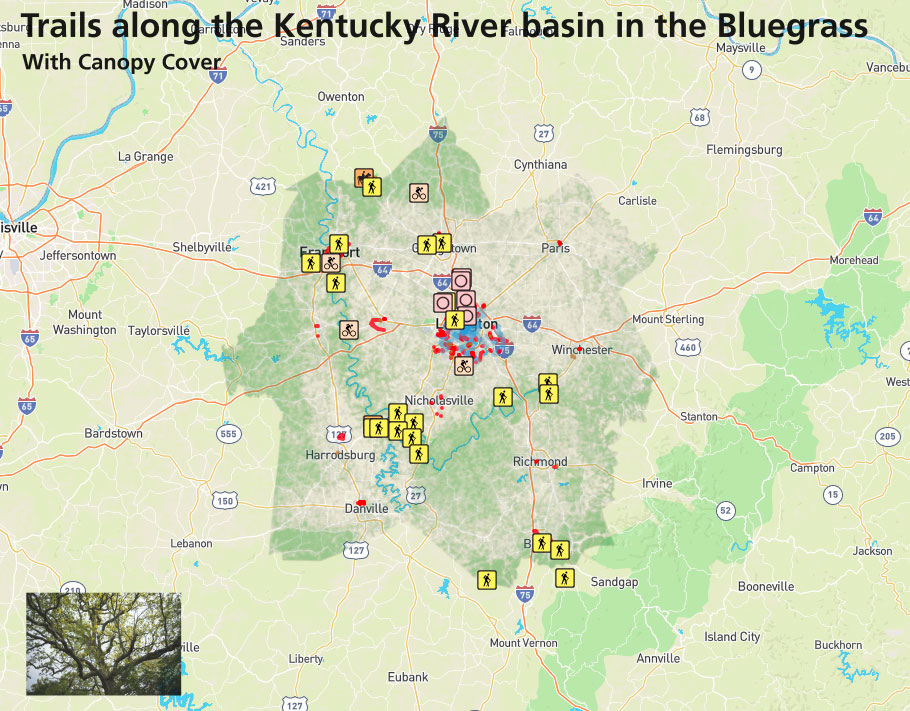
Trails and hikes along the Kentucky River and in the greater Lexington area.
We’re excited to start compiling great hikes near Lexington and along the Kentucky River. Often we feel compelled to travel long distances to find natural areas to enjoy. While the Daniel Boone and Big South Fork forests provide multiday excursions, we can find challenging explorations along the Kentucky River and shared use paths in the Bluegrass. We also wanted to focus on opportunities to enjoy our tree canopy since most of our surrounding countryside is dedicated to private pasture and farmland.
Our goal is to do good research and offer a free map here to use on your mobile device. We will focus on five types of trails.
Enlarge map: https://outrageGIS.com/maps/bluegrass
You can follow our explorations on Pixel’s Travels. Here is 360 photo of the John Holder Public Trail in the Lower Howard’s Creek Nature Preserve.
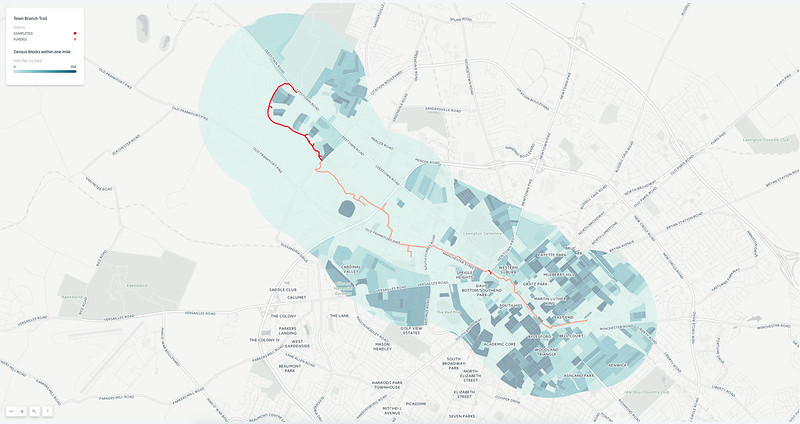
Town Branch Trail in maps
Students create many maps and a website for the soon-to-be-built Town Branch Trail during the Spring 2017 semester in the GEO 409 (Advanced Topics in GIS) in the Department of Geography, University of Kentucky. We used mainly open source GIS software QGIS and GitHub to create and publish our maps.
We used mainly open source GIS software QGIS and GitHub to create and publish our maps. For the final project, students grouped into separate teams for web page production, field GPS and photography, story production, and 3D mapping.
An interactive map of the content produced for the final project can be found in the following map:
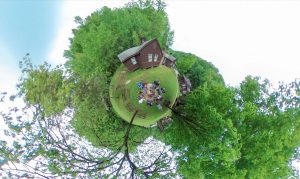
360 photography at camp
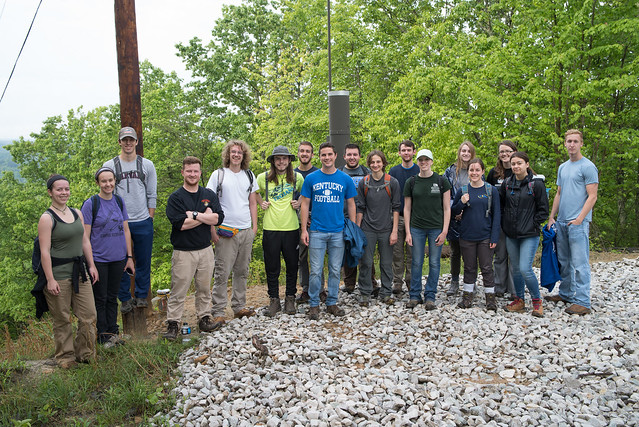
This is the third year teaching at the UK NRES (Natural Resources and Environmental Sciences) summer camp. This course was a one-day GPS and GIS exercise to map the interpretive trails around base camp. With seventeen undergraduates and their mobile devices, we split into two teams. One team focused on the trail network and GPS mapped trail alignment and intersections. A second team mapped points of interests and interpretive sites along the main hiking trail up to the fire tower.
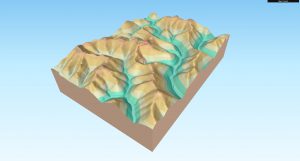
We worked in the camp classroom with QGIS, the leading free and open source GIS software, to make all of our maps. We imported our GPS data as KML or GPX formatted text files, which we then edited in QGIS. We created a shaded relief base map from DEM data (using the Terrain plugin!) over which we laid the cleaned trail data. We finally exported a GeoTIFF which could be loaded on mobile devices and used to locate position without requiring a cellular data connection.
Link to interactive map (6 MB)
We also touched on how to make interactive 3D maps. QGIS offers one of the richest environments to experiment with GIS data. We introduced a plugin, qgis2threejs, that is perhaps the easiest method to make online 3d maps. Take a look!
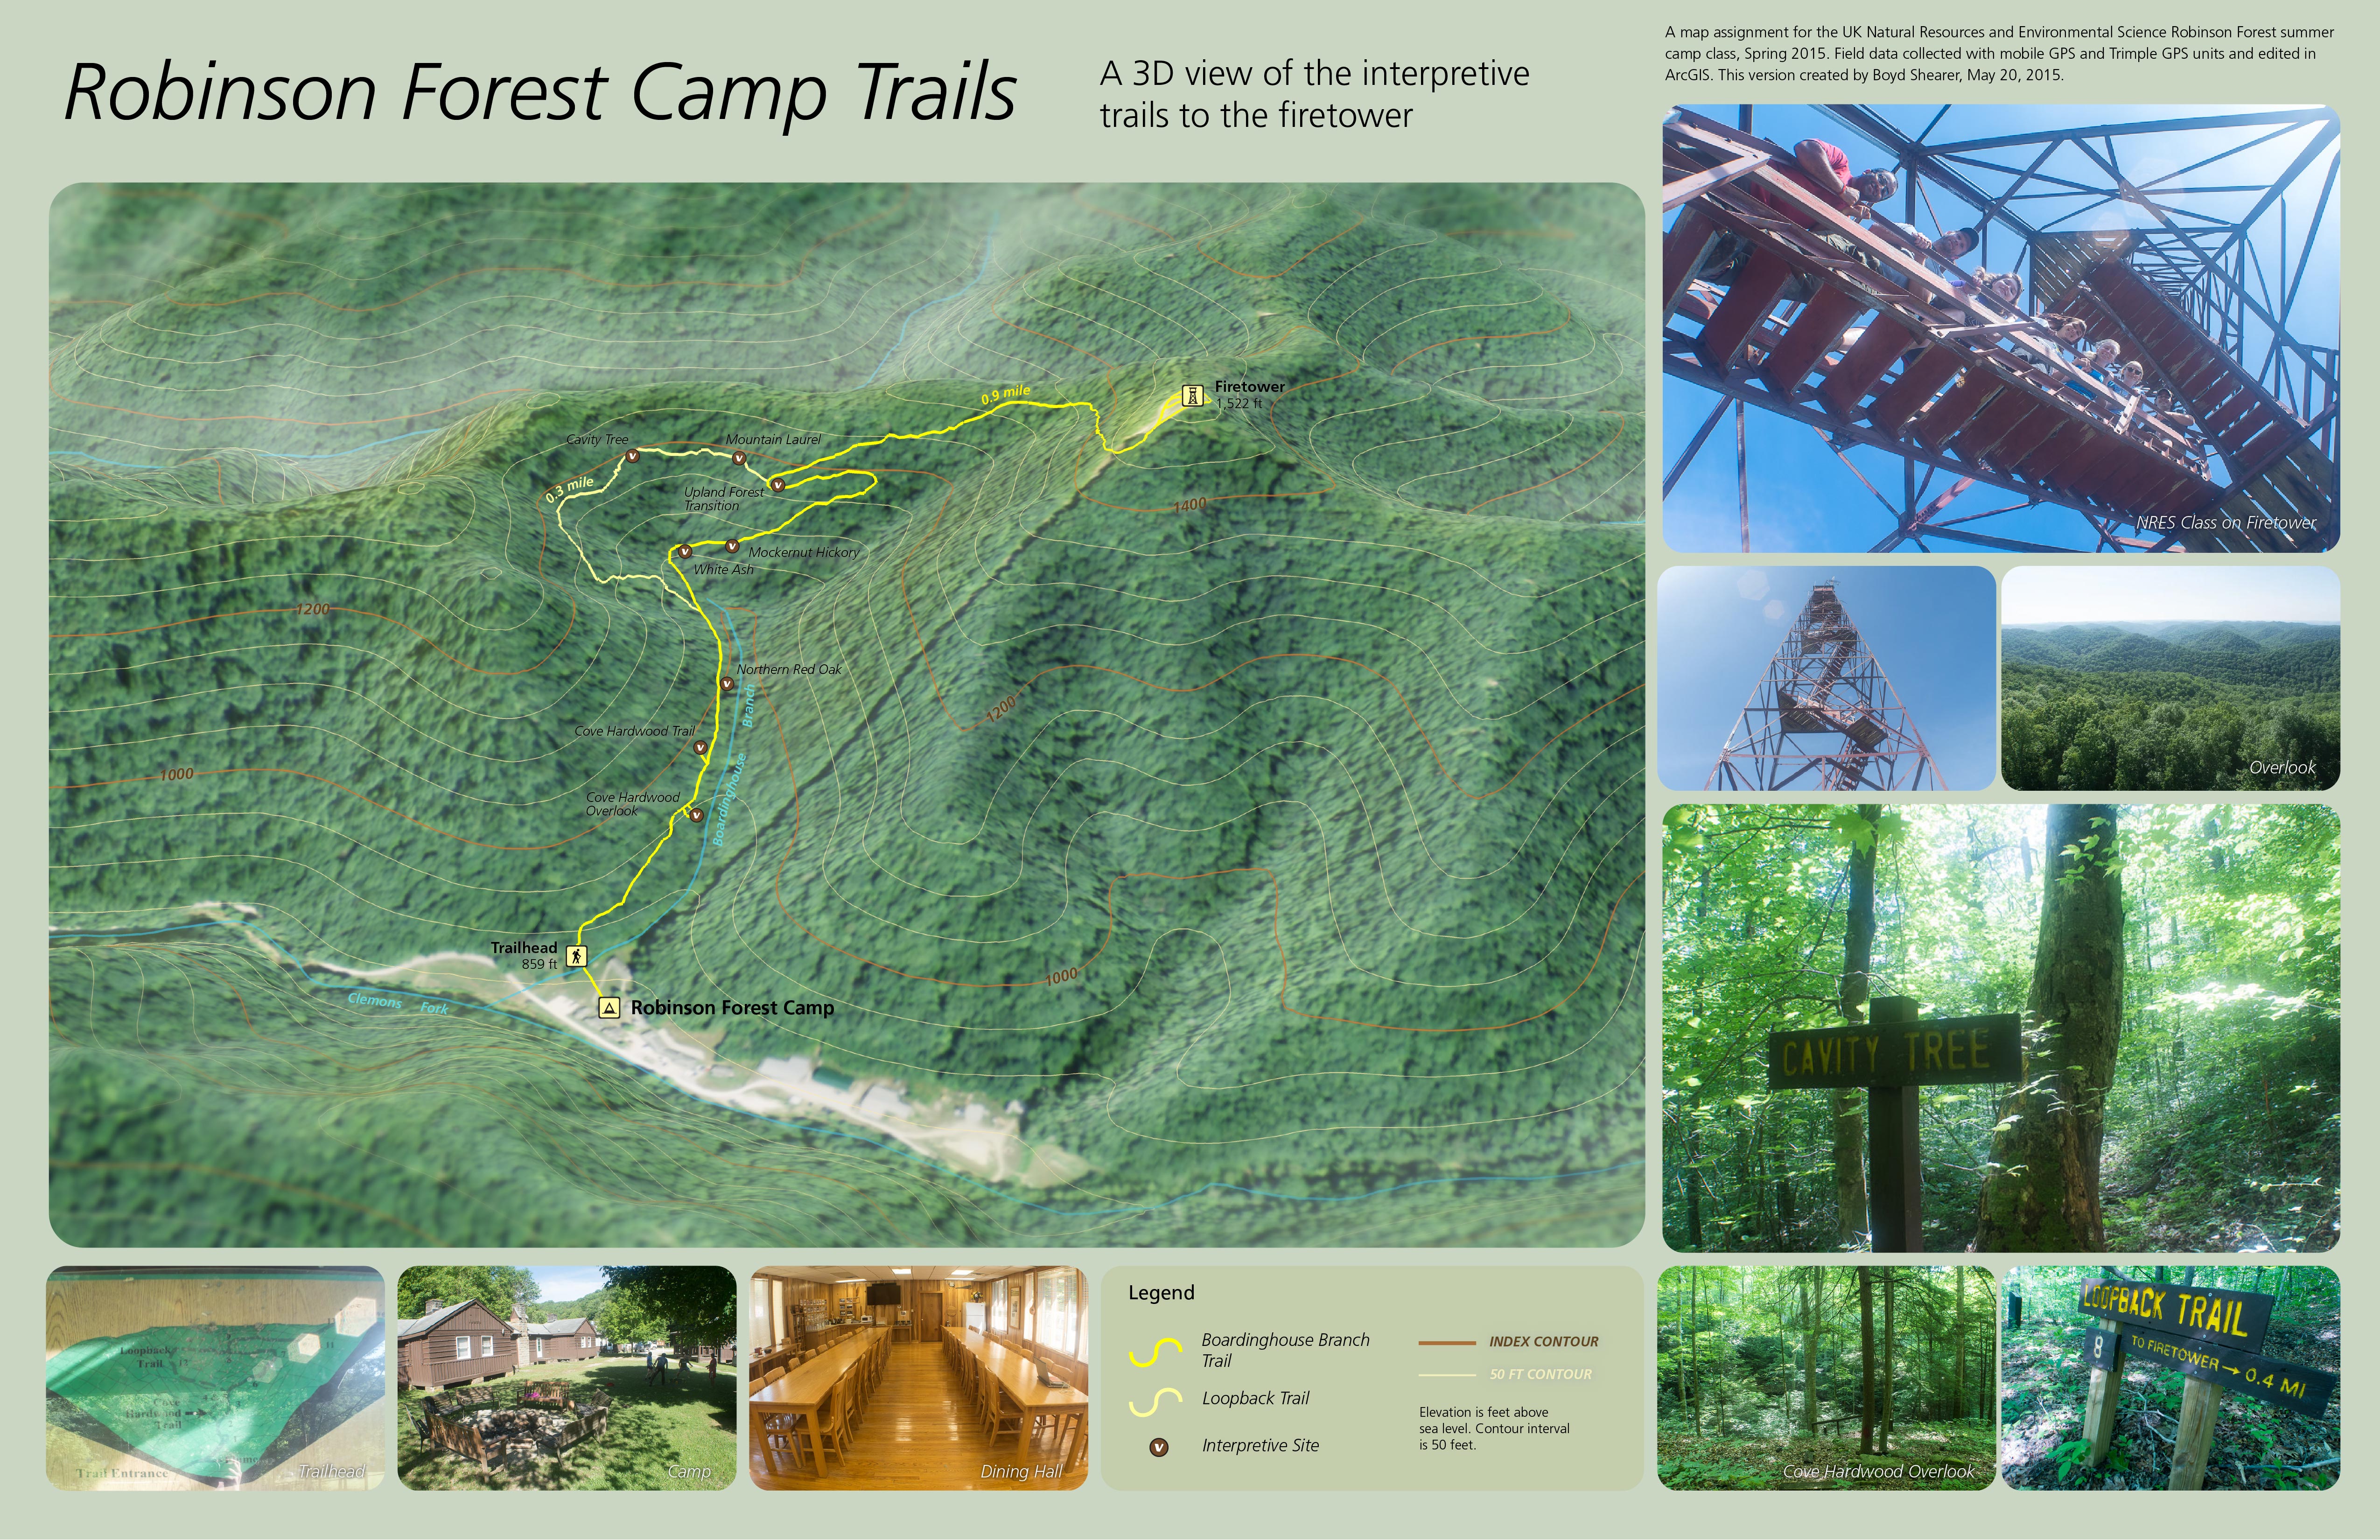
Robinson Forest Camp trail map
Last year, we GPS mapped the road to the fire tower. During the first year, we spent time making a static bird’s eye view of the main trail up to the fire tower. Since the first year, some students have asked about updating the map in the trailhead kiosk. It is a block diagram of the trail and its style is dated. This year, we discovered that theqgis2threejs QGIS plugin can make similar block diagrams. Maybe one year we can get one of these maps in the kiosk!
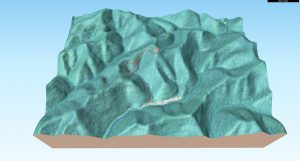
3D map with 2014 aerial photography (25 MB)


